

72% of support teams still lean on surveys or sampled ticket reviews to explain customer pain, and that's exactly why prioritization meetings turn into opinion contests. If you sat through one of those this week, you already know the role of sentiment gets overstated fast and understood badly.
The role of sentiment is real. Just smaller than most teams think, and much more useful when it's tied to drivers, evidence, and actual tickets.
Key Takeaways:
- Sentiment is a signal, not a decision system
- If sentiment isn't tied to drivers, you won't know what to fix
- Sampled reviews create false confidence once ticket volume passes a few hundred conversations a month
- A simple rule works: if a metric can't link back to quotes, it shouldn't drive roadmap priority on its own
- Custom metrics beat generic labels when your business language matters
- Teams move quicker when product, CX, and ops can inspect the same source conversations
Why the role of sentiment gets misunderstood in support analytics
The role of sentiment in support analytics is to flag emotional direction across conversations, not to explain root cause by itself. Sentiment can tell you where frustration is rising, but it can't tell you why unless you connect it to drivers, tags, and underlying tickets.

Most teams use sentiment like a weather app. Red means bad. Green means fine. Then they act surprised when nothing changes. That's because sentiment isn't a diagnosis. It's more like your check engine light. Useful, yes. But if you stop there, you're just staring at a warning icon and calling it strategy.
Picture a CX lead at 8:14 a.m. on Monday. She's got a Zendesk export open, a slide for the exec review due at 2 p.m., and one ugly trend line showing negative sentiment up 14% month over month. By 9:07, the VP has Slacked: "Can you show which accounts are driving this?" She can't. Not yet. So two managers spend half the day hunting screenshots, pulling ticket IDs, and arguing over whether the spike is billing confusion or a product regression. That's where the role of sentiment gets distorted: the number arrives first, the explanation limps in later.
Sentiment shows heat, not cause
A lot of dashboards confuse detection with understanding. That's the first mistake. Sentiment can surface where emotion is changing, but it does not explain the driver behind that change. A customer might sound negative because onboarding failed, because a billing policy felt unfair, or because an outage made work impossible. Same emotional label. Totally different action.

I use a simple model for this: the Signal-to-Driver Gap. If you have signal without driver, you're measuring mood. If you have driver without evidence, you're measuring theory. You only get to action when both are present. If negative sentiment rises in a segment and the same segment clusters around a driver like Account Access, then you've got something worth investigating. If not, you just have noise with a chart attached.
Some teams will say that's enough for a quick pulse check, and that's a fair point. For a tiny team reading 50 tickets a month, it might be. Once you cross roughly 300 to 500 conversations a month, though, pulse checks start hiding patterns instead of revealing them. Volume changes the game.
A clearer way to think about it: the role of sentiment is early detection, not final prioritization.
Scores create confidence faster than they create clarity
Clean scores win meetings. Messy evidence wins decisions.
Same thing with CSAT and NPS. They're easy to repeat, easy to trend, easy to defend in a meeting until somebody asks the one question that matters: what actually broke? Sentiment-only reporting has the same problem. It gives you a tidy surface but not the mechanism underneath. McKinsey's work on customer experience has been pointing in this direction for years: broad scores matter less when you can't connect them to the moments causing friction (McKinsey on customer experience measurement).
There's also a hidden cost. When the only common metric is a score, the room fills the gaps with anecdotes. Support remembers the loudest escalation. Product remembers the launch they shipped. Ops remembers staffing constraints. Everybody has a story. Nobody has a system.
If you want to see what that system looks like when sentiment, drivers, and evidence live together, Learn More.
The emotional trap is believing a number settled the argument
Ever notice how a single sentiment score can make a messy problem look finished? That's the trap.
Sentiment dashboards feel calming because they reduce messy conversations into one field. But the calm is fake. The moment a leader asks for examples, confidence drops and teams start scrambling through tickets manually. Not analysis. Cleanup.
The real problem isn't lack of data. It's lack of traceable structure. A score without evidence turns every meeting into cross-examination. And once that happens, the role of sentiment gets inflated because it's the only number anyone has.
That inflation gets expensive fast. So if sentiment isn't enough, what does a better operating model look like?
What sentiment can do well, and where it breaks first
Sentiment works well as a directional layer when it's used with thresholds, segments, and supporting metrics. It breaks first when teams ask it to explain cause, prioritize fixes alone, or stand in for full conversation analysis.
You don't need to throw sentiment out. That would be dumb. Sentiment is useful. I'd argue it's one of the best first-pass signals you can have. But first-pass is the key phrase. Treating it like final truth is where teams go wrong.
Use the 3-layer reading model
Start with what I call the 3-Layer Reading Model. Layer one is emotional direction: positive, neutral, negative. Layer two is business weight: effort, churn risk, outcome, or another metric that shows consequence. Layer three is explanation: drivers, tags, and quotes. If you only have layer one, you know something changed. If you have two layers, you know whether it matters. When all three line up, you've got a priority.
Say negative sentiment rises 9% in one enterprise segment. Alone, that's a weak signal. Add high customer effort and a churn risk flag, now it's more serious. Add a driver cluster around Billing and repeated quotes about fee confusion, now you've got a case to fix something specific. That's the difference between reporting and decision support.
Not everyone agrees with this approach. Some teams prefer to keep sentiment simple so more stakeholders can follow it. That's valid. Simplicity matters. But oversimplifying the role of sentiment usually pushes complexity somewhere else, and that somewhere else is manual investigation later.
Sampling breaks at a predictable threshold
At 100 tickets a month, sampling can still feel honest. At 1,000, it's usually theater.
Here's a rough rule I trust: if your team ingests more than 300 support conversations a month, sampled sentiment review becomes a risk, not a shortcut. Above that line, segment bias creeps in, edge cases multiply, and the loudest themes start crowding out quieter but more costly ones. Gartner has made similar arguments about the limits of sample-based customer insight programs as unstructured feedback volume climbs (Gartner on customer analytics and unstructured feedback).
Let's pretend you sample 10% of 2,000 monthly tickets. That's 200 conversations. Maybe enough to spot a giant outage. Probably not enough to detect that new customers in one onboarding path are showing unusually high effort and negative language before canceling. Smaller patterns die in samples. The expensive ones often start small.
That's why the role of sentiment shifts with scale. At low volume, it's a decent summary. At high volume, it has to be part of a full-coverage system.
Generic sentiment misses business language
A B2B SaaS support queue and a travel disruption queue can both look "negative" while requiring completely different fixes. That's the problem with generic sentiment.
A B2B SaaS team might care about implementation friction, expansion risk, procurement delay, or failed onboarding milestones. A travel brand might care about disruption severity and passenger comfort. A fintech team might care about trust, verification pain, or funds access. Generic sentiment won't capture that because it wasn't built to.
So use the If-Then Rule here. If a support theme affects retention, cost-to-serve, or product priority, then it deserves its own metric, not just a sentiment label. Before, the dashboard says customers are frustrated. After, the dashboard says enterprise renewals are at risk because implementation tickets are clustering around SSO setup. That's a very different conversation.
The role of sentiment gets healthier when it stops trying to do work that belongs to custom measurement.
Before you act, run a quick diagnostic
Before you change your workflow, diagnose it. Five questions usually tell you whether the role of sentiment is carrying too much weight.
- Can you trace a sentiment trend back to exact tickets and quotes?
- Can you separate sentiment by segment, driver, and effort level?
- Do you know which negative themes affect churn risk versus simple annoyance?
- Are you reviewing all conversations or a sample?
- Do your metrics reflect your business language or generic labels?
If you answered no to three or more, sentiment is probably doing too much work in your operating model. If you answered no to question one, that's the biggest red flag of all. A metric you can't inspect becomes political almost immediately.
And that raises the real question: once you diagnose the weakness, how do strong teams turn the role of sentiment into a decision process?
How high-performing teams turn sentiment into decisions
High-performing teams use sentiment as the front door, then route every meaningful signal through drivers, evidence, and segment analysis before they prioritize a fix. That's the role of sentiment in a mature system: alert first, explain second, decide third.
This is where the conversation gets practical. The goal isn't better dashboards. It's faster, cleaner decisions. Product wants to know what to fix first. CX wants to know where customers are struggling. Ops wants to know where pain is compounding. You need one operating model that can answer all three.
Start with the DRIVER stack
The framework I like here is DRIVER: Detect, Isolate, Validate, Rank, Investigate, Resolve.
Detect with sentiment and related signals. Isolate by segment, date range, or account type. Validate through source tickets and quotes. Rank by business impact using effort, churn risk, or custom metrics. Investigate the recurring cause using drivers and tags. Resolve by assigning the actual fix to the team that owns it.
That's a much better use of the role of sentiment. It becomes triage, not treatment. If negative sentiment rises but churn risk stays flat and effort is low, watch it. If negative sentiment rises with high effort in a high-value segment, act. If negative sentiment is stable but churn risk spikes around a driver, don't wait for the mood score to catch up.
Honestly, this is the part that changes executive conversations. You stop saying "sentiment is down." You start saying "negative sentiment and high effort are concentrated in onboarding for new mid-market accounts, and here are the five tickets that show exactly why."
Build metrics in business language, not generic AI language
A lot of teams inherit their metrics from whatever the vendor shipped first. That's backwards.
Your measurement model should reflect how your business makes decisions. If your product team debates expansion blockers, create a metric for expansion risk. If your support team keeps seeing refund confusion, classify that. If onboarding quality matters more than raw happiness, track onboarding friction directly. The threshold I use is simple: if a question comes up in three straight weekly meetings, it should probably become a named metric.
That might sound obvious. Nobody does it. Or rather, very few do.
This is where the role of sentiment settles into place. It becomes one column among several, not the executive summary of the whole customer experience. For support leaders and product managers, that shift matters because it reduces false certainty.
Use traceability as a trust filter
Trust is the hidden bottleneck in support analytics. Not data volume. Not even model quality. Trust.
A metric gets used when somebody can defend it in a room full of skeptical people. That means the metric needs a receipt: quote, ticket, transcript, something real. I call this the Traceability Test: if an insight cannot be walked back to source evidence in under 30 seconds, it should not drive roadmap priority.
That sounds strict. Good. It should be. Forrester has been making a version of this point in their work on customer analytics governance for years: insights get adopted when teams can inspect the logic behind them, not just consume the output (Forrester on customer analytics trust and governance). Black-box scores look smart right up until somebody important asks how they were produced.
The role of sentiment becomes much more useful once it's forced through that trust filter. Negative sentiment in abstract is arguable. Negative sentiment linked to exact quotes in a cluster of tickets is much harder to dismiss.
Segment before you escalate
What looks like a company-wide issue is often one cohort quietly getting hammered. Segment first. Always.
A sentiment shift across the entire support dataset can hide the real issue. Sometimes one customer cohort is getting crushed while the rest are fine: new customers, enterprise accounts, one geography, one product line. If you escalate before segmenting, you risk solving the wrong problem for the wrong customers.
Think of support analytics like air traffic control. The radar tells you something moved. It does not tell you whether it's a storm cell, a cargo plane, or a bird. The second layer of identification determines whether you reroute traffic, issue an alert, or ignore it. Same thing here.
So use this decision rule: if a sentiment change is smaller than 5% and not concentrated in a segment, monitor it. If it's above 5% and clustered around one driver or high-value segment, investigate immediately. If it pairs with high effort or churn risk, prioritize it even if total ticket volume is modest.
That's how you turn the role of sentiment into something operational instead of decorative. The next step is making that workflow fast enough to use every week.
How Revelir AI makes the role of sentiment actually useful
Revelir AI turns the role of sentiment from a loose signal into an evidence-backed decision workflow. It does that by pairing sentiment with custom metrics, drivers, full ticket coverage, and direct links back to the source conversations and quotes.
This is the difference between a sentiment dashboard and a support intelligence layer. Revelir AI doesn't ask you to trust a score in isolation. It gives you the surrounding structure that makes the score useful in the first place.
Evidence first, not score first
Revelir AI applies its AI Metrics Engine to support conversations so sentiment becomes a structured field you can actually work with, alongside churn risk, customer effort, and conversation outcome. More important, though, is Evidence-Backed Traceability: every aggregate number links back to the source conversations and quotes.
That changes the meeting dynamic fast. Instead of saying negative sentiment is rising and then scrambling for examples, you can move from the metric straight into the tickets behind it. Revelir AI also includes Conversation Insights, so teams can drill into full transcripts, AI-generated summaries, assigned tags, drivers, and AI metrics to validate what the pattern really means.
If your current workflow still depends on screenshots and manual ticket hunts, that's where the time goes. Revelir AI cuts that loop down because the evidence sits with the metric.
Custom metrics make sentiment fit your business
Generic sentiment is rarely enough, especially for product and CX leaders trying to prioritize fixes faster. Revelir AI includes Custom AI Metrics, which means you can define domain-specific classifiers in your own language and use those results as columns across filtering and analysis.
Same thing with tagging. Revelir AI uses a Hybrid Tagging System with Raw Tags and Canonical Tags, so emerging themes can surface quickly while reporting stays aligned to human-friendly categories. Add Drivers on top, and now the role of sentiment has context. You can see not just that customers are upset, but which driver is producing that response and whether the issue appears in the segments you care about most.
Revelir AI also processes 100% of ingested tickets through Full-Coverage Processing, whether the data comes through Zendesk Integration or CSV Ingestion. That matters because sampled sentiment is where blind spots start.
Analysis gets faster when everything sits in one layer
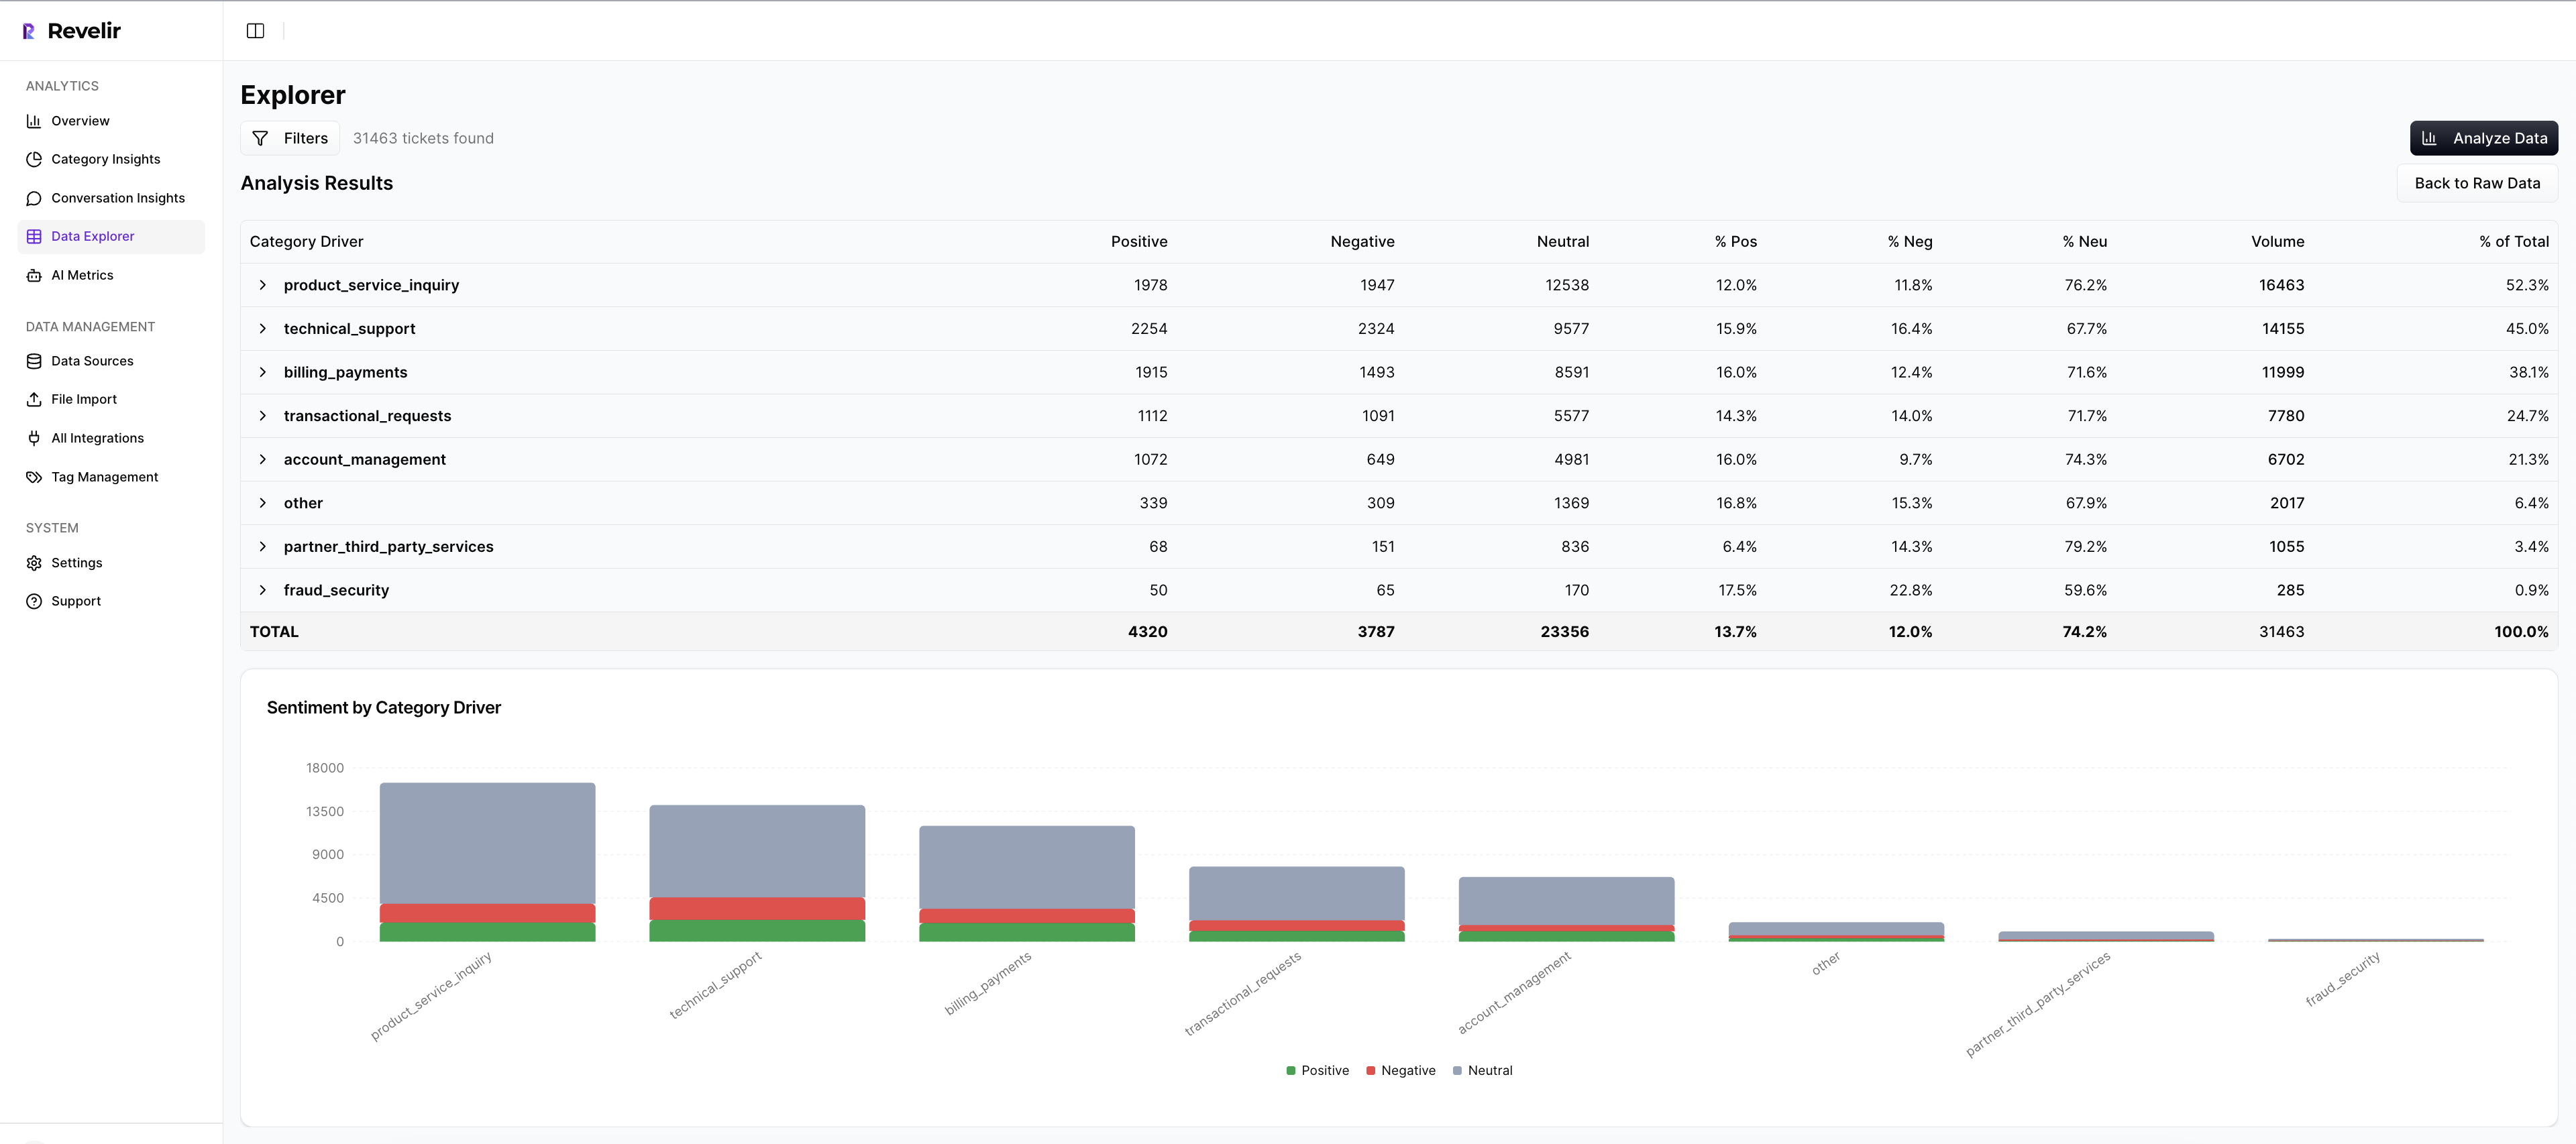
Revelir AI gives teams a pivot-table-like Data Explorer to filter, group, sort, and inspect every ticket with columns for sentiment, churn risk, effort, tags, drivers, and custom metrics. Then Analyze Data lets you summarize those metrics by dimensions like Driver, Canonical Tag, or Raw Tag, with interactive tables and charts that link to the underlying tickets.
That's what support and product teams usually try to build manually with exports and spreadsheet logic. Revelir AI just gives you the structured layer directly. And if your team wants the data elsewhere after analysis, API Export is available for existing BI workflows.
Why evidence matters more than sentiment alone
The role of sentiment is to point you toward tension in the customer experience. The role of evidence is to make that tension actionable.
That's really the whole thing. Scores aren't strategy. Drivers and evidence are what move decisions. Sentiment matters, but only when it's surrounded by business context, full coverage, and a clean path back to source conversations.
If your team is still trying to prioritize fixes from sampled reviews, survey curves, or isolated sentiment charts, you're probably arguing harder than you need to. Better systems reduce debate. They don't just create prettier reporting.
If you're ready to replace score-only reporting with traceable support intelligence, Get started with Revelir AI.
Frequently Asked Questions
How do I integrate Revelir AI with Zendesk?
To integrate Revelir AI with Zendesk, start by connecting your Zendesk account through the Revelir AI interface. Once connected, Revelir will automatically pull in historical and ongoing tickets, including all relevant metadata and conversation text. This allows you to analyze 100% of your support conversations without manual exports. After integration, you can use features like Data Explorer to filter and inspect your ticket data effectively.
What if my team struggles to connect sentiment to specific issues?
If your team is having trouble linking sentiment to specific issues, consider using Revelir AI's Evidence-Backed Traceability feature. This allows you to trace sentiment trends back to the exact tickets and quotes that generated them. By doing this, you can identify the underlying drivers of negative sentiment and prioritize fixes based on actual customer feedback, rather than relying solely on sentiment scores.
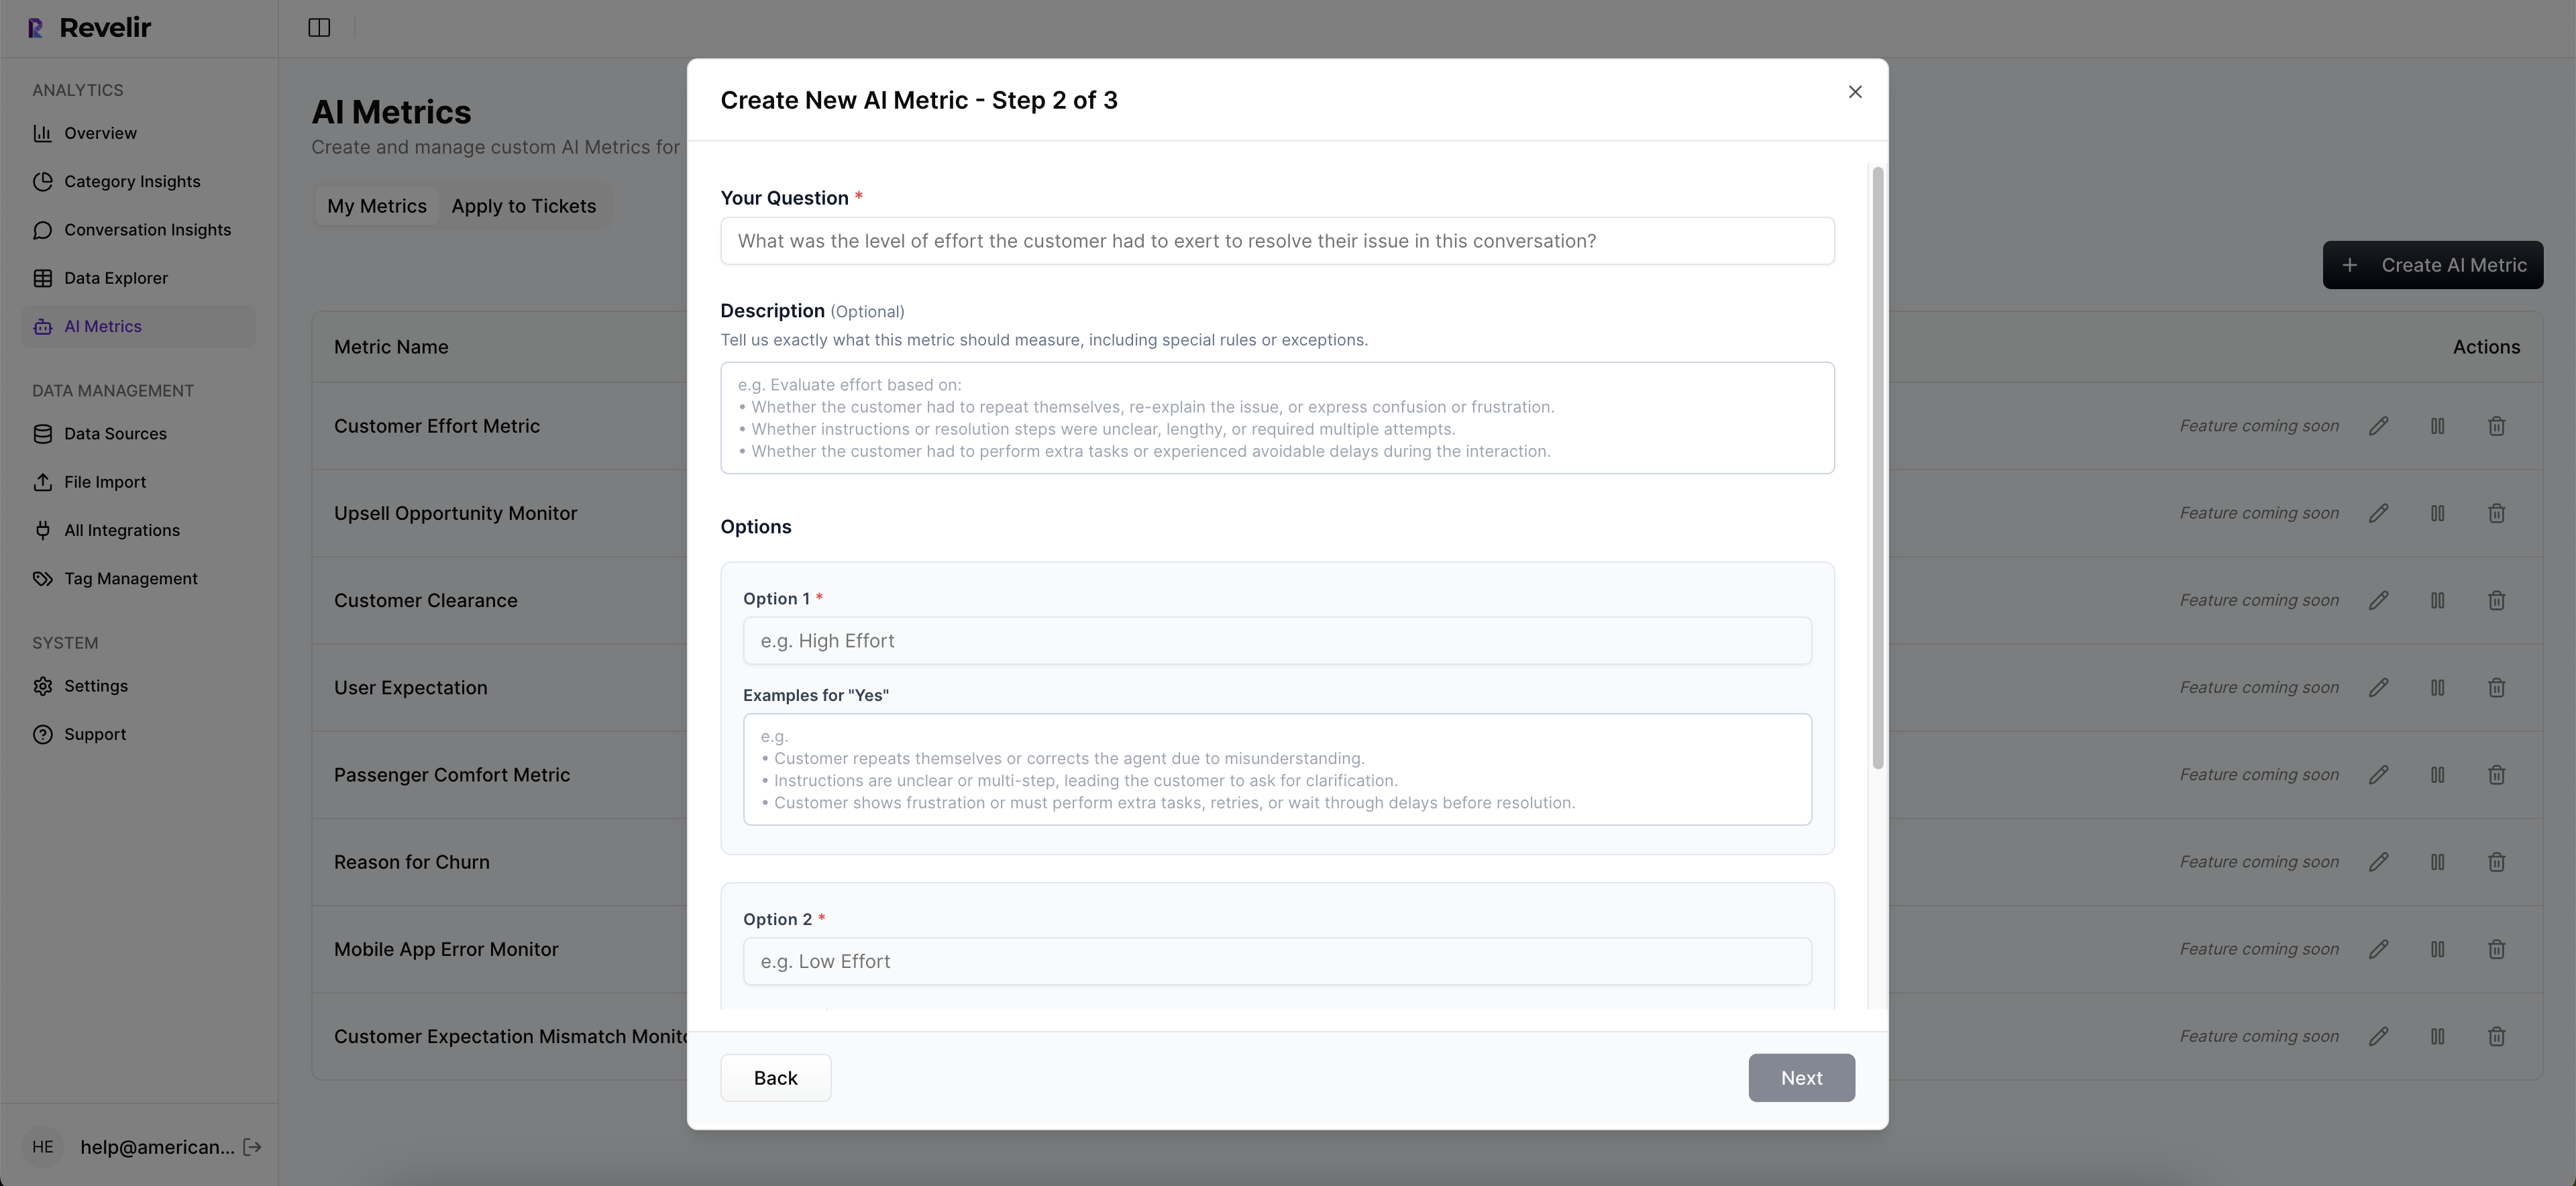
Can I create custom metrics in Revelir AI?
Yes, you can create custom metrics in Revelir AI using the Custom AI Metrics feature. This allows you to define domain-specific classifiers that align with your business needs. For instance, if you want to track reasons for churn or upsell opportunities, you can set up custom questions and value options. These metrics will then be available for filtering and analysis across your support data.
When should I use the Analyze Data feature?
You should use the Analyze Data feature when you want to summarize and visualize your support metrics by specific dimensions, such as sentiment, churn risk, or drivers. This feature helps you identify trends and patterns in your data, allowing you to make informed decisions. For example, if you notice a spike in negative sentiment, you can analyze it by driver to understand what specific issues are causing customer frustration.
Why does my team need full-coverage processing?
Full-coverage processing is essential because it ensures that Revelir AI analyzes 100% of your ingested tickets, eliminating the biases and blind spots that come from sampling. This comprehensive approach allows you to uncover subtle patterns and issues that might otherwise go unnoticed. By processing every conversation, your team can make more accurate, evidence-based decisions about customer experience improvements.