

82% of support teams say customer expectations are higher than a year ago, yet most companies still use customer support like a ticket-closing machine. That mismatch is the real role of customer support now: not just resolving issues, but surfacing the patterns that product, CX, and retention teams usually notice too late.
You can watch this happen in real time. A dashboard says response time is healthy. CSAT looks mostly flat. Meanwhile, buried inside thousands of conversations, customers are spelling out exactly where the experience is breaking and nobody’s connecting the dots.
Key Takeaways:
- The role of customer support has expanded from case handling to signal detection for product, CX, and retention teams.
- Sampling tickets creates blind spots fast. A simple rule: if you review less than 20% of conversations, assume your trend calls are incomplete.
- Scores tell you that something changed. Support conversations tell you why it changed.
- Support becomes strategic when teams can tie metrics back to exact tickets and quotes.
- A useful support analytics system needs four layers: full coverage, structured metrics, driver analysis, and traceability.
- If your team can’t answer “show me the tickets behind this chart” in under 2 minutes, your reporting is too fragile.
- If you want to see what that looks like in practice, Learn More.
Why the Role of Customer Support Is Bigger Than Most Teams Admit
The role of customer support is no longer limited to solving one customer problem at a time. It now sits at the edge of churn risk, product feedback, onboarding friction, and brand trust because support sees the raw conversation before anyone else does. That makes support the earliest warning system in the company, if the company actually listens.

At 8:14 AM on Monday, a support lead is in Zendesk with 3,400 tickets from the prior two weeks, three escalation pings in Slack, and a product review at 1 PM. She skims 25 tickets, copies two quotes into a Google Doc, glances at CSAT, and walks into the meeting with what feels like a clean narrative. By Thursday, product has prioritized the wrong issue, because the narrative came from fragments rather than coverage. That’s not bad judgment. That’s bad instrumentation.
The old job description is broken
Throughput used to define support. Answer faster. Hit SLA. Keep the queue moving. Useful, yes. Sufficient, no.

The Support Signal Ladder is a better frame. Level 1 is ticket resolution. Level 2 is pattern detection. Level 3 is business guidance. A lot of companies still measure the role of customer support as if Level 1 were the whole job, even though the real leverage appears at Levels 2 and 3, where unfiltered customer language becomes usable evidence.
There’s a fair counterargument here: not every support org should become an internal research lab. True. Headcount is finite, queue pressure is real, and nobody wants agents spending all day writing mini-theses. But once roadmap calls depend on surveys, scattered anecdotes, or the loudest enterprise account, customer support is already acting as the research layer; it’s just doing it informally, with no chain of evidence.
Sampling creates false confidence
Picture two teams. One reviews 50 tickets a month and feels informed. The other reviews every conversation and finds patterns the first team never even knew to look for. Same inbox category. Totally different reality.

Take a team handling 1,000 tickets a month. Review 10% manually at roughly 3 minutes each and you’ve already spent about five hours to produce a partial read. Push that same motion to 5,000 tickets and you are no longer doing insight work; you’re curating a highlight reel for yourself.
Worse, sampled review is biased in predictable ways. Leaders over-sample recent tickets, emotionally charged tickets, or tickets from categories they already suspect are problematic. Quiet patterns slip through: onboarding confusion that adds two extra touches per account, low-grade billing friction that depresses renewal confidence, or repeated mentions of “this took too much effort.” Like a QA team testing only the buttons above the fold, you get a tidy report and a broken product.
Customer support now owns the truth loop
What keeps a company honest is not the dashboard. It’s the loop between what customers say, what support captures, what the business measures, and what product or CX changes next.
According to Gartner, service leaders are under increasing pressure to use support interactions as a source of enterprise insight, not just service efficiency. That pressure makes sense. Surveys are prompted. Interviews are selective. Tickets are different: they are unsolicited statements made at the exact moment friction becomes costly enough to report.
So yes, the role of customer support has changed. Maybe not into strategy theater, and not into endless reporting for its own sake, but into stewardship of the truth loop. If that loop breaks, the company starts making expensive decisions off vibes. The next question, then, is obvious: why do so many teams still measure support in ways that flatten the truth instead of preserving it?
What Teams Get Wrong About Measuring Support Conversations
The hard part is not getting more data from support. The hard part is converting messy conversations into metrics people actually trust without stripping away the context that made those conversations valuable in the first place. That is where the role of customer support usually gets distorted.
The real problem isn’t volume, it’s unstructured evidence
Before you buy another dashboard, run this four-question diagnostic. Can you explain what changed in customer experience without reading tickets? Can two leaders tag the same issue the same way? Can you separate a queue spike from a product problem? Can you show the evidence behind a chart in under two minutes? If you answered “no” to two or more, your issue is not ticket volume. It’s unstructured evidence.
A lot of teams assume the helpdesk already contains the answer. In one sense, it does. But raw tickets are like audio channels from a stadium where every microphone was left on after the event. The crowd noise is real, the important shout is in there somewhere, and without structure you end up turning up the volume instead of improving the signal.
That’s why the Reframe Matrix matters:
- If your issue is too many tickets, fix operations.
- If your issue is no clear themes, fix taxonomy.
- If your issue is weak executive trust, fix traceability.
- If your issue is conflicting stories across teams, fix coverage first.
Dashboards come later. They summarize what your system already understands. They do not create understanding on their own, which is exactly where a lot of support analytics projects go sideways.
Scores are lagging signals, not explanations
A 7-point CSAT drop looks decisive on a slide. It is not a diagnosis.
CSAT and NPS still matter. Fair enough. They create a benchmark, they travel well in board decks, and they let teams see directional movement without reading ten thousand lines of free text. But the role of customer support gets reduced when leaders treat scores as explanation rather than alarm bell.
If CSAT falls 7 points, then one of two things should happen next. If you can map the decline to a specific driver within 48 hours, move it to product or CX review. If you cannot, hold the narrative and dig into the conversations before someone invents a story that fits the number. Support conversations are the difference between “customers are less happy” and “new users are hitting login friction after identity verification, then contacting us twice to recover access.” One of those statements leads to action. The other leads to a meeting.
HubSpot’s service research keeps showing a familiar pattern: customers say they want speed, empathy, and resolution, but those expectations show up unevenly across actual interactions. That is why the role of customer support can’t stop at score management. Scores tell you something moved. Conversations tell you what moved, where, and for whom.
Black-box analytics break trust in the room
Let’s pretend you walk into a product review and say, “Onboarding-related churn risk is up 18%.” Good claim. Now the PM asks, “Which tickets?” If the answer is “the model says so,” confidence disappears fast.
This is where a lot of analytics programs lose the room. The model may be directionally useful. The dashboard may even be right. Still, if nobody can trace the claim back to source conversations, the insight won’t survive budget scrutiny, prioritization debates, or one skeptical VP with follow-up questions.
Here’s the operating threshold: if a metric cannot be traced back to source evidence in under 2 minutes, do not use it to drive quarterly strategy. That rule has exceptions. For tiny teams under 300 monthly tickets, manual lookup can still be acceptable for a while. But once conversation volume rises, black-box reporting turns support into a witness nobody fully trusts. So what does a more reliable system look like in practice?
How to Turn Support Into a Reliable Decision System
The role of customer support becomes strategic when conversations stop functioning as anecdotes and start functioning as operating signals. That shift does not require magic. It requires a system with clear decision rules, validation steps, and evidence paths that hold up under scrutiny.
Start by diagnosing your support maturity
Three support orgs can have the same ticket count and completely different measurement problems. One is still counting backlog. One has themes but no trust. One has metrics but cannot explain them. Same data volume, different maturity.
Use this Support Maturity Spectrum:
- Stage 1: Queue Control — you mostly track SLA, response time, backlog, and reopen rate.
- Stage 2: Theme Awareness — you can identify recurring issue types, usually through tagging or periodic review.
- Stage 3: Driver Intelligence — you can connect issue patterns to sentiment, effort, churn risk, or segment impact.
- Stage 4: Decision Support — the role of customer support includes evidence-backed recommendations that product, CX, and ops teams actually use.
If you are in Stage 1, do not start by debating AI taxonomy design for six weeks. Fix coverage and basic categorization. If you are in Stage 2, standardize themes before adding executive reporting. If you are in Stage 3, traceability becomes the bottleneck. And if you are in Stage 4, your next constraint is speed: how fast you can move from signal to cross-functional action.
Start with full coverage, not perfect tagging
Once ticket volume passes 500 conversations a month, sampling should be treated as a QA technique, not a decision system.
You do not need perfect taxonomy on day one. You do need full coverage. Otherwise the role of customer support gets framed by what happened to be reviewed, not by what customers actually experienced.
That’s the Coverage-First Rule: if you have more than 500 tickets per month, analyze all conversations before you optimize tagging depth. Below that threshold, manual review can work for a period, especially if one leader still reads a meaningful share of tickets directly. Above it, though, the cost of being wrong compounds faster than the cost of processing the full set.
McKinsey has pointed for years to customer care as a source of operational insight, and the mechanism is straightforward: broader coverage improves pattern detection, better pattern detection improves prioritization, and better prioritization reduces wasted fixes. The downside is real. Full coverage introduces implementation work, data cleanup, and sometimes uncomfortable visibility into how messy the queue actually is. Worth it anyway. Partial evidence produces neat decks and bad decisions.
Build from signals to drivers, not quotes to stories
What should come first: a vivid customer quote or a structured pattern? Structured pattern. The quote comes second, as proof.
The Driver Stack keeps teams from storytelling too early:
- Signal layer: sentiment, effort, churn risk, outcome, or business-specific metrics
- Theme layer: issue descriptors that preserve specificity
- Rollup layer: canonical tags and drivers that make reporting usable
- Decision layer: what gets fixed first, by whom, and why
Before, a support leader might say, “Customers seem frustrated about billing.” After the stack is in place, the same leader can say, “Billing effort rose 22% among SMB accounts in the last 30 days; 61% of those tickets mention confusion around a single fee policy; the evidence cluster is concentrated in first-invoice conversations.” That is what the role of customer support sounds like when it is measurable instead of anecdotal.
Use the 3x3 validation rule before sharing insights
Speed is useful. Validation is what keeps speed from becoming noise.
Run the 3x3 Validation Rule before sending any support insight into a roadmap or exec review.
The three checks:
- Is the pattern visible in aggregate metrics?
- Is it stable across a meaningful time window or cohort?
- Can you open underlying tickets that clearly support the claim?
The three views:
- Driver level
- Tag or issue level
- Ticket or quote level
If a claim passes all six touchpoints, publish it. If it fails two or more, call it a hypothesis and keep digging. Yes, this adds friction. Fair point. But it is the good kind of friction, the kind that prevents one dramatic screenshot from hijacking a quarter of roadmap attention. And once the system is credible, meetings get shorter because fewer people argue about whether the pattern is real.
Measure support with decision metrics, not service metrics alone
Response time still matters. Resolution time still matters. Backlog still matters. None of that disappears.
But the role of customer support is bigger than service efficiency, so the scorecard has to be bigger too. Track decision metrics alongside service metrics:
- percentage of conversations analyzed
- time from pattern detection to stakeholder review
- percentage of reported insights tied to source evidence
- top drivers by sentiment, effort, or churn risk
- repeat issue concentration by segment or product area
Here’s the before-and-after contrast. Before: “We replied in 42 minutes.” After: “We identified an onboarding driver affecting new admins, tied it to 146 tickets, and got it into product review in 3 days.” One describes activity. The other describes strategic value. If support can prove patterns instead of reciting queue stats, the next question becomes practical: what system actually makes that possible at scale?
How Revelir AI Makes the Role of Customer Support Measurable
The role of customer support becomes much easier to defend when every conversation is analyzed, every claim can be traced to source evidence, and teams can move from raw tickets to decision-ready drivers without rebuilding their helpdesk. That is the measurement problem Revelir AI is built to solve.
Full coverage changes the quality of the conversation
Revelir AI processes 100% of ingested tickets through Full-Coverage Processing, so teams are not stuck sampling a subset and hoping it represents the whole. That matters most when low-frequency, high-cost issues are the ones quietly driving churn, escalations, or repeat contacts.
You can bring data in through the Zendesk Integration for ongoing and historical tickets, or use CSV Ingestion for a pilot, backfill, or one-off analysis. Before, the first debate in the room was usually whether the sample was representative. After full coverage, the debate shifts to what the evidence actually says. Much better use of everyone’s time.
Structured metrics and drivers make support usable across teams
A helpdesk full of text is hard to act on. A helpdesk translated into measurable drivers is where the role of customer support starts influencing decisions.
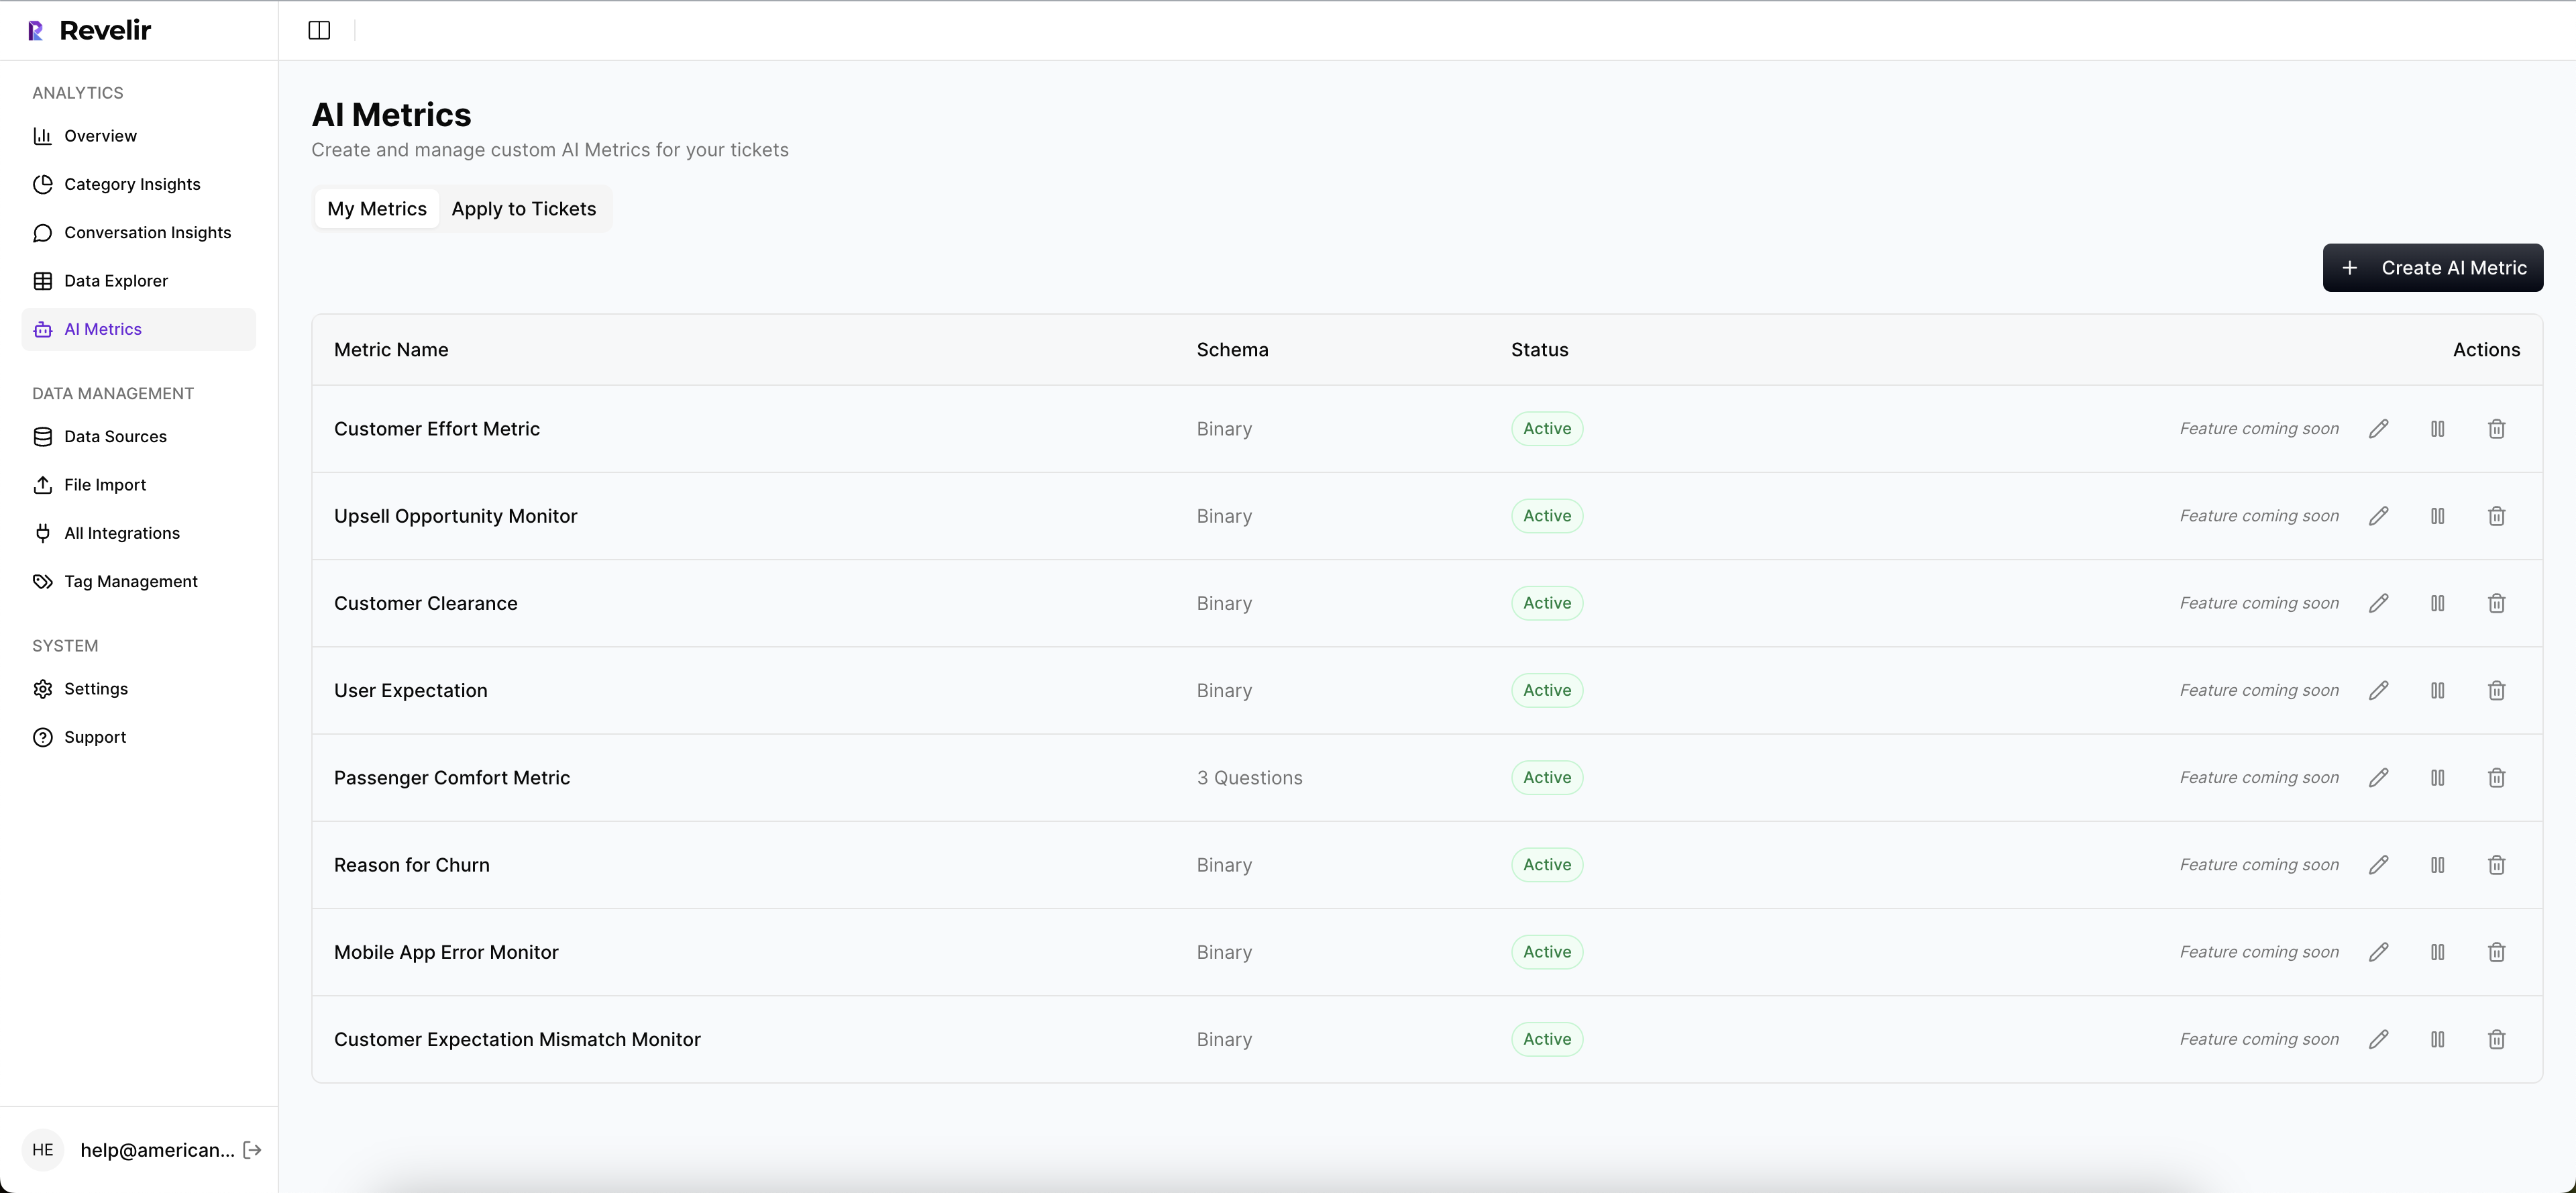
Revelir AI’s AI Metrics Engine creates structured fields like Sentiment, Churn Risk, Customer Effort, and Conversation Outcome. Teams can also define Custom AI Metrics in their own language, which matters when generic labels fail to capture the business. The Hybrid Tagging System adds AI-generated Raw Tags for granular themes and Canonical Tags for cleaner reporting, while Drivers provide higher-level groupings that help leadership see what is actually changing.
That mechanism matters. Product does not need 200 micro-labels. It needs to know whether onboarding, billing, account access, or performance is worsening, by how much, and with what evidence behind it.
Traceability is what makes the insight credible
Insight without traceability is just polished guessing.
Revelir AI’s Evidence-Backed Traceability links aggregate metrics directly to the underlying tickets and quotes. In Data Explorer, teams can filter and inspect conversations with columns for sentiment, churn risk, effort, tags, drivers, and custom metrics. Analyze Data groups patterns by dimensions like Driver, Canonical Tag, or Raw Tag, with linked paths back to source conversations. Conversation Insights then lets teams review transcripts, summaries, tags, drivers, and metrics in one place.
So when a product leader asks, “Why are we saying onboarding risk is up?” the answer is not a shrug wrapped in a chart. It is the metric and the exact conversations behind the claim. If you want to put that system in place without replacing your helpdesk, Get started with Revelir AI.
What the Role of Customer Support Looks Like From Here
The role of customer support is shifting from queue management to evidence generation. Teams that still rely on samples, scores, and scattered ticket reviews will keep finding out about product and retention issues after the damage is already visible somewhere else.
Teams that analyze full conversation sets, structure the signal, validate the drivers, and trace every claim back to source evidence will make better product, CX, and retention decisions. That’s the real shift. Customer support is no longer just where problems arrive. It’s where the business learns what the problems actually are.
Frequently Asked Questions
How do I analyze customer support tickets effectively?
To analyze customer support tickets effectively, start by using Revelir AI's Data Explorer. This tool allows you to filter and group tickets based on metrics like sentiment, churn risk, and effort. You can drill down into specific tickets to see the underlying conversations, which helps you understand the context behind customer feedback. Make sure to utilize the Hybrid Tagging System to categorize issues accurately and track recurring themes. This structured approach will enable you to identify patterns and prioritize improvements based on actual customer experiences.
What if I want to track specific customer issues over time?
If you want to track specific customer issues over time, use Revelir AI's Evidence-Backed Traceability feature. This allows you to link aggregate metrics directly to the source conversations and quotes. By setting up Custom AI Metrics, you can define specific issues to monitor and analyze trends. Regularly review these metrics in the Data Explorer to see how customer sentiment evolves and to ensure that you are addressing the right problems promptly.
Can I import historical support data into Revelir AI?
Yes, you can import historical support data into Revelir AI using the CSV Ingestion feature. Simply export your tickets from your helpdesk as a CSV file and upload it through the Data Management section. Revelir will parse the transcripts and apply its full tagging and metrics pipeline, allowing you to analyze past conversations just like ongoing ones. This is particularly useful for backfilling data and ensuring you have a comprehensive view of customer interactions.
When should I consider moving to full coverage analysis?
You should consider moving to full coverage analysis when your support team handles over 500 tickets per month. At this volume, sampling can lead to blind spots and biases, making it difficult to get an accurate picture of customer sentiment and issues. By using Revelir AI's Full-Coverage Processing, you can ensure that every ticket is analyzed, which will improve your ability to detect patterns and make informed decisions based on complete data.