
42% of support leaders say proving the business impact of CX is a top challenge, and you can feel that stat every Thursday when someone in the exec meeting asks, “do we know this is real?” If you're looking for strategies for improving customer experience, start there, because what stalls most CX programs is not a lack of care or data. It's a lack of proof that survives scrutiny.
You can have dashboards. You can have survey scores. You can have a spreadsheet full of tags from last quarter. And still miss the thing that's actually making customers mad. Same thing with support data. It's usually everywhere and nowhere at once.
Key Takeaways:
- Good strategies for improving customer experience start with evidence, not prettier scorecards.
- Sampling tickets creates false certainty once volume gets past roughly 500 conversations a month.
- If a chart can't link back to exact tickets and quotes, it probably won't hold up in leadership review.
- The most useful CX metrics answer two questions at once: what happened and why it happened.
- A practical framework is to track Signals, Drivers, Evidence, and Action in that order.
- Custom metrics matter because your business language rarely fits generic sentiment labels.
- Teams move faster when product, support, and ops can all inspect the same source conversations.
Why Most Customer Experience Programs Miss What's Really Breaking
Customer experience programs usually miss the root issue because they measure outputs without measuring causes. CSAT, NPS, and broad sentiment can tell you that something moved, but they rarely tell you what broke, who felt it most, and which ticket proves it. That gap is why so many strategies for improving customer experience stall the minute an executive asks for evidence.
The scorecard trap shows up earlier than people think
A lot of teams think they need more dashboards. I'd argue they usually need fewer summaries and better source visibility. Once you're reviewing more than 500 tickets a month, the old setup starts to wobble. A manager reads 30 tickets, maybe 50 if they're disciplined, a few survey comments get pasted into a slide, and then the whole company starts talking as if that sample represents reality.

Let's pretend your billing issue affects 7% of customers, but those customers are your highest-value accounts. A volume chart may not flag it. A monthly CSAT average may smooth it out. Nobody's checking the specific thread where a customer says they had to contact support three times for the same problem, which is the sentence product actually needs to read.
Manual review does have one real advantage: humans catch nuance. That's fair. But once review volume rises, nuance without coverage turns into anecdote with confidence. Rough combo.
The hidden problem is not lack of data, it's lack of traceable evidence
Contrast two rooms. In one, support brings a chart, product asks for examples, finance asks how widespread the issue is, and the next 20 minutes disappear into exports and arguments. In the other, the team can move from a metric to the exact conversations behind it in seconds. Same data. Totally different level of trust.
The real problem isn't that support teams lack customer data. It's that the most valuable data is trapped in free text, then stripped of context when it gets turned into a chart. You end up with a number that sounds important and an argument about whether anyone should trust it.
That's not a reporting issue. It's an evidence-packaging issue. If your insight can't survive scrutiny, it won't drive prioritization. And if it won't drive prioritization, it isn't one of your real strategies for improving customer experience. It's just reporting with better colors.
The day-to-day failure feels small until it doesn't
Picture a CX lead on Tuesday morning. She's in Zendesk at 8:15, pulling tickets before a 10:00 product review. By 9:40 she's got 12 examples, three conflicting tags, one BI chart showing negative sentiment rose 4 points, and no clean answer for why. The meeting starts anyway. Everybody has a theory. Nobody has evidence that shuts the debate down.

That is what this work feels like in a weak system. Not dramatic. Just expensive in a slow, weekly way. Like a black box recorder that captured the incident perfectly, then handed you only the averages.
The exhausting part isn't the lack of data. It's the lack of confidence. When you're the person carrying customer truth into a room full of skeptical operators, weak evidence feels expensive. And once debate becomes the default, the next question is unavoidable: what would a better system for improving customer experience actually look like?
The Best Strategies for Improving Customer Experience Start With Drivers, Not Scores
The best strategies for improving customer experience begin by identifying the driver behind customer friction, then tying it to evidence from actual conversations. Scores help you monitor the surface. Drivers tell you what to fix. Evidence gives you the leverage to get it fixed. If the first section exposed the trust gap, this section is the operating model that closes it.
Diagnose your maturity before choosing the fix
Before you change tooling, ask four questions. Can you explain a metric drop with a driver in under 10 minutes? Can you show the exact tickets behind that explanation? Are you looking at all relevant conversations or just a sample? Are your metrics defined in your business language?
Most teams fall into one of three buckets. First is Score-Watching: dashboards everywhere, weak driver analysis. Second is Sample-Review: smart humans reading tickets, but no full coverage and no consistency. Third is Evidence-Led: a team can move from chart to driver to exact quotes in a few clicks.
If you answered no to two or more questions, your bottleneck is probably system design, not team effort. That's the diagnostic rule. If you miss one answer, tune your workflow. Miss two, redesign the process. Miss three or four, don't buy prettier reporting. Fix the evidence chain first.
Use the SDEA model: Signals, Drivers, Evidence, Action
Signals, Drivers, Evidence, Action. That's the model. I call it SDEA because most CX teams get stranded on the first letter and never build the rest. Signal is the alert. Driver is the why. Evidence is the proof. Action is the operating decision.
A score drop is a signal. “New users are confused by account setup after the latest release” is a driver. Three exact ticket quotes from affected customers are evidence. Updating the onboarding flow and measuring whether effort falls in the next 30 days is action. Before, you had a pulse. After, you have a decision system.
This sounds obvious when you lay it out. In practice, most teams stop after signal because that's where legacy tooling stops. Same thing with sentiment dashboards. They give you a pulse, not a diagnosis. And diagnosis is what makes strategies for improving customer experience hold up in the room that actually allocates resources.
Build around a 100% coverage threshold, not a sample threshold
Above 500 tickets a month, sampling starts lying to you more often than helping you. Above 1,000, it's mostly theater unless you're using structured analysis across all conversations. That's the threshold rule I'd use.
Why so blunt? Because sample bias gets worse as ticket mix broadens. Product bugs, onboarding confusion, policy friction, edge-case failures, VIP complaints, regional issues. The minute the dataset gets messy, your sample turns into a story generator rather than a decision system.
Now, fair concession: if your team handles fewer than 200 tickets a month, careful manual review can still work, and for an early-stage team it may be the smartest use of time. But once volume grows, a partial read creates false certainty. You don't just miss patterns. You miss which customer segment is carrying the pain, which means you often fix the wrong thing first.
Translate customer language into business language
What changes when “annoyed customers” becomes “enterprise onboarding friction tied to verification failure”? Usually, ownership. Generic sentiment labels are fine for broad monitoring, but they rarely match how your business actually thinks or funds work.
So define metrics in that language. Product may care about onboarding friction, failed verification, feature confusion, renewal risk, or escalation likelihood. Support may care about effort spikes or repeat-contact drivers. Leadership may care about what is affecting retention. One rule I like: every custom metric should map to a decision owner. If no team would change behavior based on the result, don't track it.
Honestly, this is where strategies for improving customer experience become real. Not when you add another score. When you make the data speak the same language as the people who have to act on it.
Treat support tickets like a flight recorder, not a suggestion box
A flight recorder doesn't tell you everything that matters in a business. But when something goes wrong, it's where you go for sequence, context, and truth. Support tickets work the same way. They capture unsolicited feedback in the moment people are confused, blocked, annoyed, or ready to leave.
That doesn't mean every ticket deserves equal strategic weight. Of course not. That's a fair limitation, especially if you serve a wide self-serve base where only a slice of users contact support. Still, the mechanism matters: surveys tell you what people choose to summarize later; tickets capture what stopped them in the moment. Different evidence class. Often more useful.
So if you're serious about improving customer experience, stop treating ticket data like overflow from support ops. It's one of the cleanest sources of operational truth you have. The teams that win here don't collect more opinions. They preserve more evidence.
What High-Trust CX Teams Do Differently Week to Week
High-trust CX teams run a repeatable rhythm that turns conversation data into decisions. They don't just review scores. They inspect drivers, validate patterns against source tickets, and bring evidence into planning. That's what makes their strategies for improving customer experience hold up under pressure, week after week, instead of dying in review meetings.
They run a weekly evidence review, not a dashboard recap
The strongest teams I see don't walk into weekly reviews saying, “sentiment is down.” They walk in saying, “negative effort increased 11% among new accounts, and the driver is onboarding confusion tied to one setup step.” Huge difference.
A useful weekly review has three moves. First, sort for movement bigger than 10% week over week or any driver appearing in more than 5% of tickets from a key segment. Second, validate with 5 to 10 underlying conversations before you socialize the story. Third, assign an owner to the fix before the meeting ends. No owner, no strategy.
Before, the meeting is a recap. After, it's an operating review. Small shift on paper. Big shift in what actually gets fixed.
They separate signal detection from story confirmation
Bad CX process blends these together. Someone spots a trend, then immediately explains it with whatever examples are easiest to find. That's how confirmation bias sneaks in. Better teams split the work.
Signal detection asks: what changed, where, and for whom? Story confirmation asks: do the underlying tickets actually support that explanation? If not, throw the narrative out and keep digging. I know that sounds slower. It's actually faster over time because it prevents wrong turns and rework.
One mental model that helps is the 3-2-1 rule. Before you escalate a customer pattern, get 3 supporting conversations, 2 segments or time views that show consistency, and 1 clear driver statement you can defend. If you can't get all three, the issue may still matter, but it isn't ready for executive airtime.
They prioritize by impact path, not by ticket count alone
Question: would you rather fix a noisy FAQ issue affecting 9% of low-value tickets or a quiet onboarding defect hitting 2% of enterprise accounts and causing repeat contact? Ticket count alone would pick the first one. Revenue logic often picks the second.
I like a simple matrix here. Use frequency on one axis and severity on the other. Severity can include churn-risk mentions, high effort, repeated contact, unresolved outcomes, or executive escalations. If an issue scores high on both, move it now. If it's high frequency but low severity, schedule it. If it's low frequency but high severity in a strategic segment, escalate it anyway.
That last category gets missed all the time. A quiet enterprise onboarding problem can do more damage than a loud low-stakes FAQ issue. That's why better strategies for improving customer experience connect pain to segment and consequence, not just count.
They keep product, support, and ops on the same source of truth
Different exports create different realities. Shared evidence creates decisions. That's the contrast.
When support, product, and ops are all working from separate tags, separate dashboards, or separate examples, every prioritization call becomes a negotiation about whose data is real. The fix isn't another alignment meeting. It's a shared evidence layer with the same definitions, the same drivers, and the same path back to source conversations.
This sounds boring until you've sat in the meeting where ambiguity is doing political work for half the room. Shared evidence removes that comfort. Once everybody can inspect the same pattern and the same quotes, the conversation changes from “is this true?” to “what are we doing about it?” And that's the handoff point to the tooling layer.
How Revelir AI Turns Support Conversations Into Defensible CX Decisions
Revelir AI turns support conversations into structured, traceable metrics that teams can inspect, question, and use in real decisions. It doesn't ask you to replace your helpdesk. It gives you a way to analyze 100% of conversations, define custom metrics in your own language, and link every aggregate insight back to exact tickets and quotes. For teams comparing strategies for improving customer experience, that traceability is the difference between an interesting chart and a defensible case.
Traceable metrics change the conversation in leadership rooms
Revelir AI is strongest where a lot of CX tooling falls apart: proof. With Evidence-Backed Traceability, every aggregate number can link back to the source conversations and quotes behind it. That matters because executive reviews are where weak analysis gets exposed fastest.
So instead of bringing a chart and then scrambling for examples, your team can move from metric to conversation without losing context. Conversation Insights adds the ticket-level drill-down with transcripts, summaries, tags, drivers, and AI metrics, which means the evidence is right there when somebody asks for it. That's not cosmetic. That's what makes an insight defensible.
Revelir AI also processes 100% of ingested tickets with Full-Coverage Processing, so you're not trying to justify strategic decisions from a partial sample. If your old process wastes hours arguing about representativeness, this is the reset.
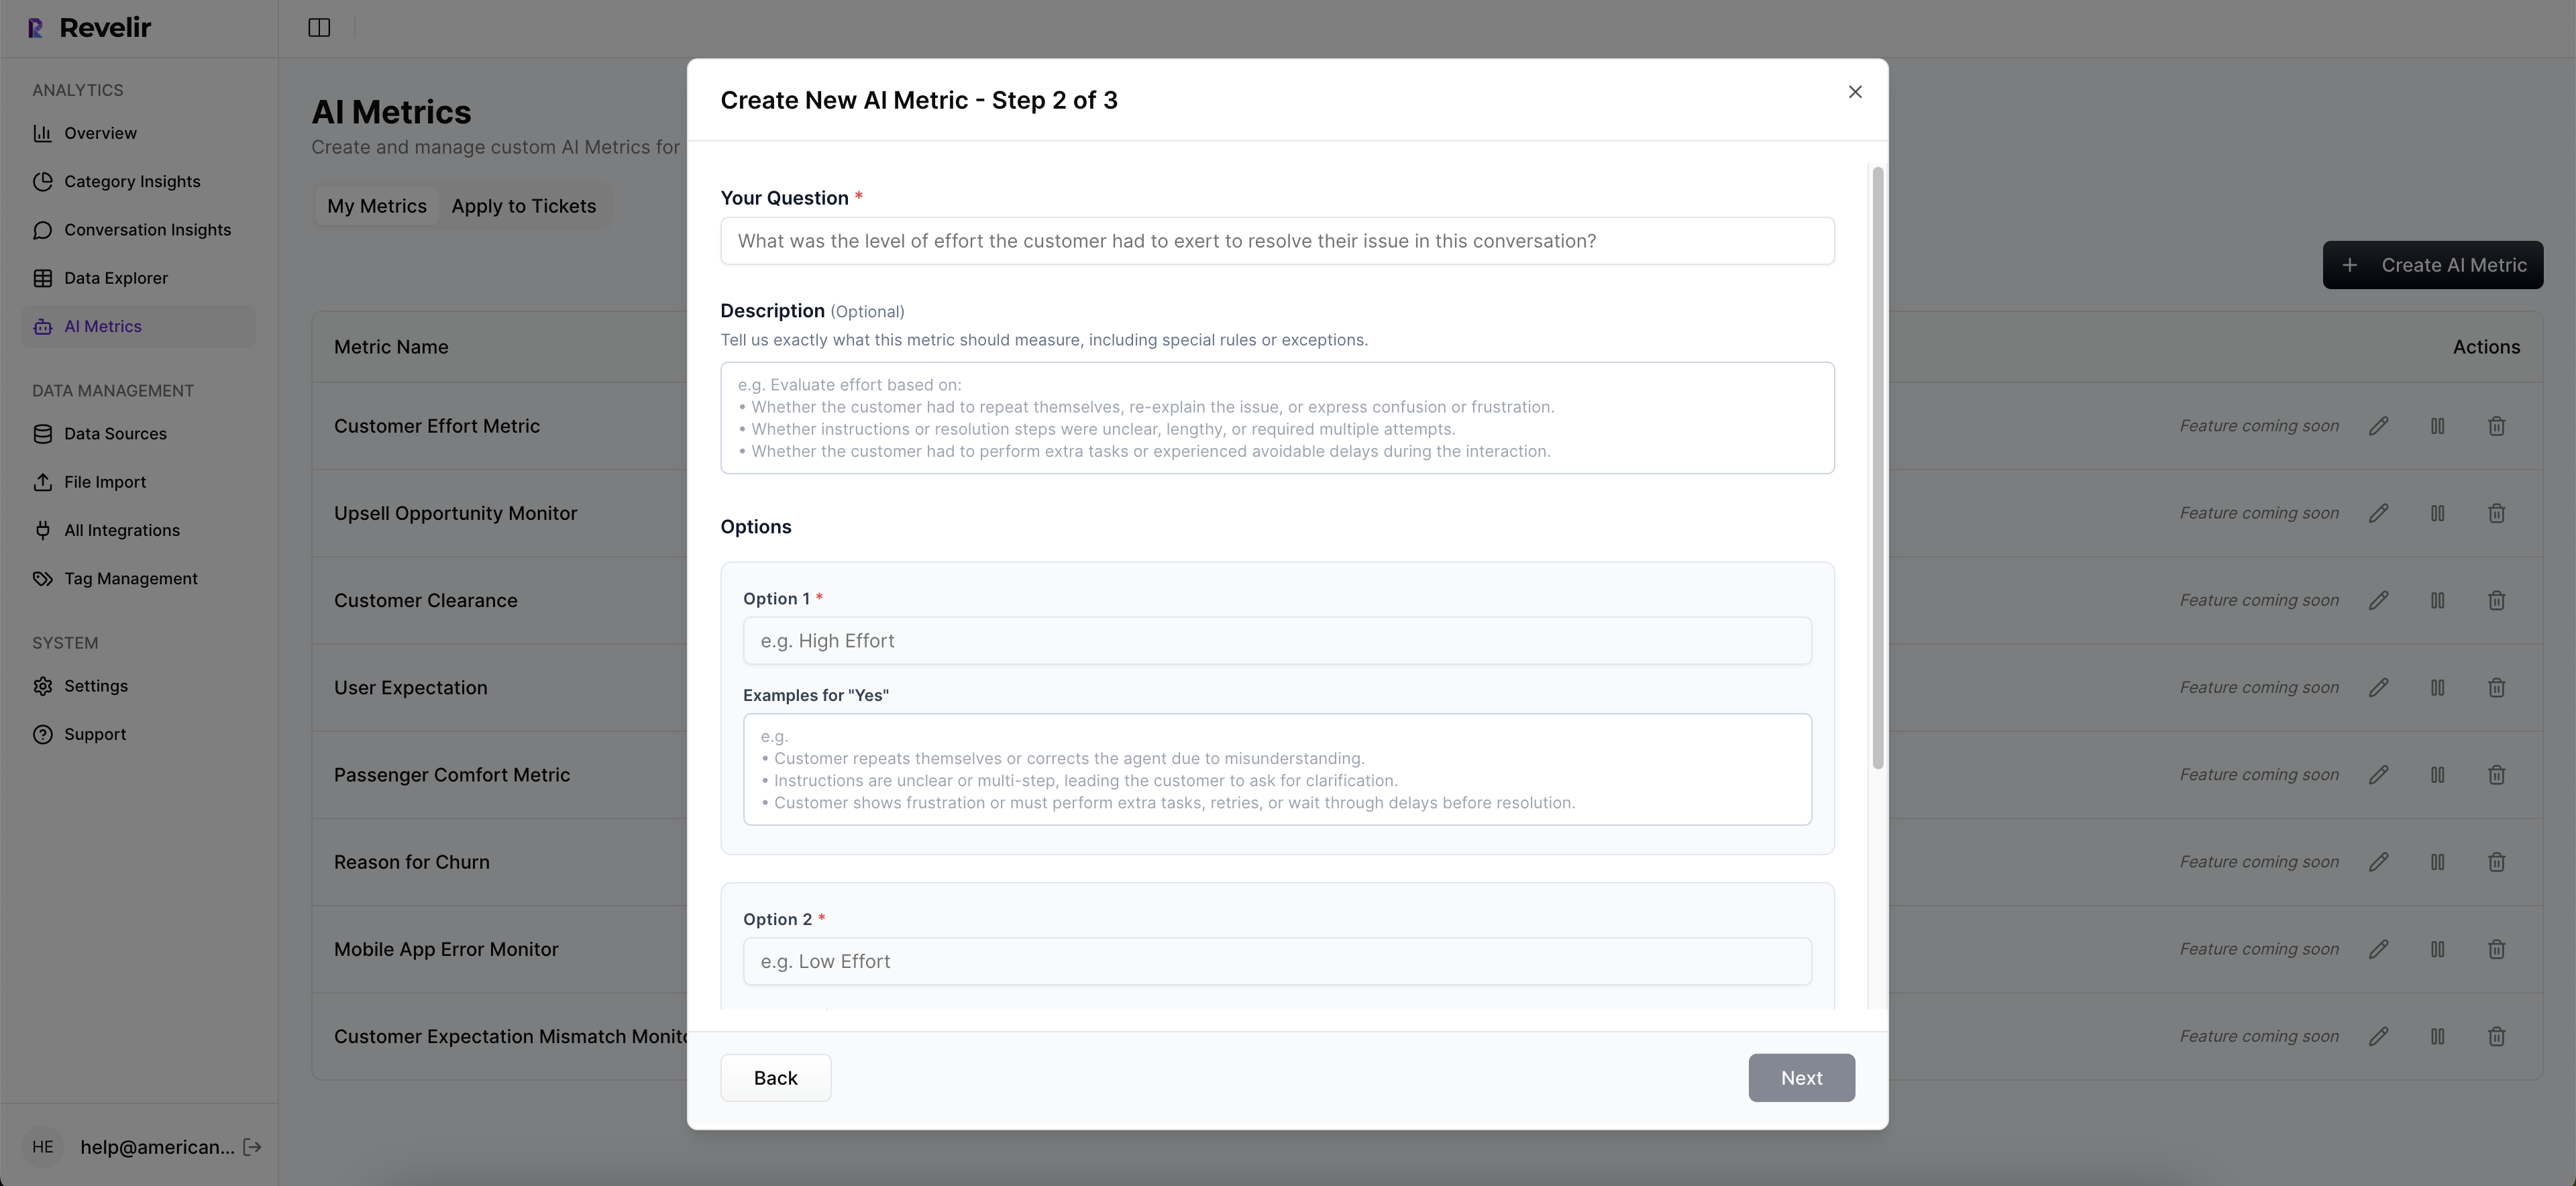
Custom metrics make customer data useful to the people who own the fix
Revelir AI doesn't stop at generic labels. The AI Metrics Engine can structure core fields like sentiment, churn risk, effort, and conversation outcome. Then Custom AI Metrics let teams define the business-specific classifiers they actually need, with custom questions and value options that fit internal language.
That's a big deal for cross-functional work. Product leaders don't always need another broad negative sentiment graph. They may need a way to isolate verification friction, pricing confusion, or renewal risk. Ops may want clearer patterns around effort and unresolved outcomes. Revelir AI lets those metrics live as usable columns for filtering and analysis instead of trapped notes in a slide deck.
Then you can explore all of it in Data Explorer, which works like a pivot table for support tickets, or use Analyze Data to summarize metrics by driver, canonical tag, or raw tag. And because Revelir AI supports Zendesk Integration, CSV Ingestion, and API Export, teams can get data in, analyze it, and move structured outputs into existing reporting flows without ripping out current systems.
Better Customer Experience Comes From Better Evidence
Strategies for improving customer experience don't fail because teams don't care. They fail because weak evidence creates hesitation, debate, and bad prioritization. Once you can see the driver, inspect the affected tickets, and explain the issue in business language, action gets a lot easier.
It's usually that simple. Not easy. Simple. If your current setup gives you scores without proof, that's the first system to fix.
Ready to make your CX reporting hold up under pressure? Get started with Revelir AI
Frequently Asked Questions
How do I analyze customer support tickets effectively?
To analyze customer support tickets effectively, start by using Revelir AI's Data Explorer. This tool allows you to filter and group tickets based on various metrics like sentiment, churn risk, and effort. You can drill down into specific tickets to see the underlying conversations, which helps you identify patterns and root causes. Additionally, consider utilizing the Analyze Data feature to summarize metrics by drivers or tags, giving you a clearer picture of what's affecting customer experience.
What if I need to track custom metrics for my team?
If you need to track custom metrics, Revelir AI's Custom AI Metrics feature is perfect for this. You can define specific classifiers that align with your business language, such as 'Onboarding Friction' or 'Churn Risk'. These metrics will then be stored as usable columns in your analyses, allowing your team to filter and explore data relevant to your unique needs. This way, you can ensure that your metrics truly reflect the issues that matter to your organization.
How do I ensure 100% coverage of support tickets?
To ensure 100% coverage of support tickets, leverage Revelir AI's Full-Coverage Processing capability. This feature processes all ingested tickets without sampling, which eliminates blind spots and biases that can occur with partial reviews. By analyzing every conversation, you can gain a comprehensive understanding of customer issues and avoid missing critical patterns that could indicate larger problems.
When should I use evidence-backed metrics in meetings?
You should use evidence-backed metrics in meetings whenever discussing customer experience issues or making strategic decisions. Revelir AI provides Evidence-Backed Traceability, which allows you to link aggregate metrics directly to the source conversations and quotes. This transparency builds trust with stakeholders and helps ensure that discussions are grounded in solid evidence rather than anecdotal information.
Can I integrate Revelir AI with my existing helpdesk?
Yes, Revelir AI can integrate directly with your existing helpdesk, such as Zendesk. This integration allows you to automatically import historical and ongoing tickets, including all relevant metadata and conversation text. By connecting Revelir AI to your helpdesk, you streamline the process of analyzing support data and ensure that your insights are always based on the most up-to-date information.