

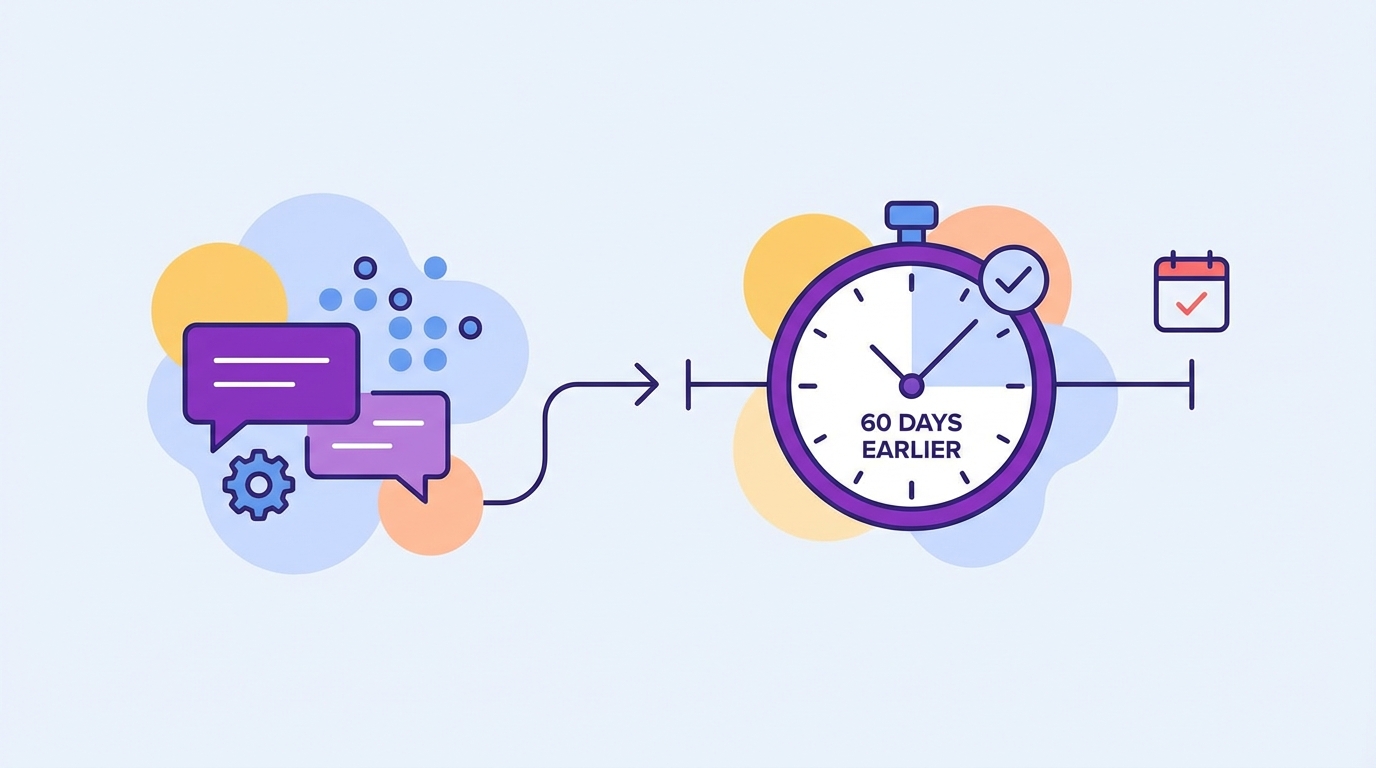
Ticket counts feel clean. CSAT charts look tidy. But they don’t tell you who is about to leave, or why. If you want to predict churn 60 days before renewal, you need signals grounded in the conversations themselves and paired with product behavior. Otherwise, you’ll act late and argue about anecdotes.
It’s usually not a tooling problem. It’s a signal problem. The real precursors to churn live inside tickets, then show up in your telemetry. Fuse both and you’ll see the early warnings. Ignore either and you’ll chase noise. Same thing with score-only dashboards. They whisper “trend” and hide the driver.
Key Takeaways:
- Define churn windows that match renewal cycles, then label them in your data.
- Convert sentiment arcs, tags, and risk flags into model-ready features tied to users and accounts.
- Combine conversation evidence with product telemetry to boost early-warning precision.
- Validate against a ticket-only baseline, measure detection lead time, and track lift in precision and recall.
- Route alerts with representative quotes, monitor drift, and re-train on new patterns.
- Aim to detect churn risk up to 60 days earlier than ticket-only models.
Why You Can’t Predict Churn 60 Days With Tickets Alone
You can’t predict churn 60 days early with ticket volume or CSAT alone because those signals arrive late and lack drivers. Ticket spikes and low scores show pain after it spreads, not before. Real precursors show up as frustration cues, churn mentions, and product-specific complaints inside conversations.
Ticket Counts Lag Reality
Volume curves move after behavior changes, not before. A spike tells you people are already stuck, and nobody’s checking whether those tickets cluster by driver, cohort, or feature. The math is simple. Late signals mean late action. You need earlier, granular cues that connect to the accounts that matter.
Teams also misread flat volume as “all clear.” It isn’t. Flat volume can still hide concentrated friction in a renewal segment or a flagship feature. That’s what burns you in QBRs. You saw “steady.” Your customers felt “stuck.”
When you stitch counts to outcomes without drivers, you get false comfort. It looks fine. Until revenue doesn’t.
Score-Only Dashboards Hide Drivers
Scores summarize, they don’t explain. A CSAT dip says there’s a problem. It won’t say which setup step fails or which edge case bleeds time. Same thing with basic sentiment. Negative doesn’t equal actionable. You need the why behind the score to move a roadmap.
External benchmarks back this up. Survey programs alone understate unsolicited feedback that drives churn, while text analytics find hidden drivers that scores miss, according to the Zendesk Customer Experience Trends 2024. McKinsey also shows that feature-level signals tied to account economics increase retention impact versus generic scores in their churn prediction work.
Reframing How To Predict Churn 60 Days Earlier
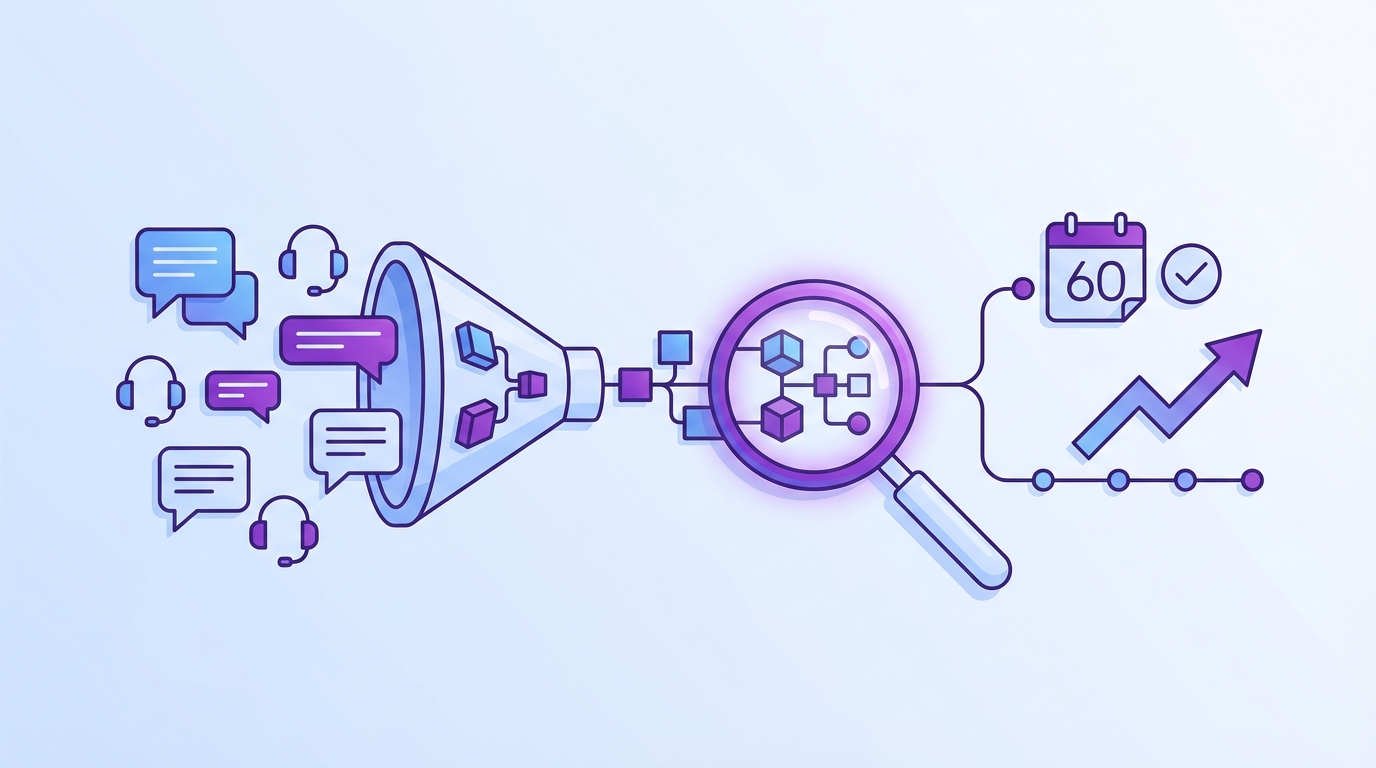
You predict churn 60 days earlier by pairing conversation evidence with product telemetry and labeling renewal-aligned windows. That reframes the goal from “more tickets or better scores” to “earlier, auditable drivers connected to revenue timing.” The outcome is simple. Fewer surprises and faster fixes that stick.
Fuse Conversations With Product Signals
Support transcripts hold the why. Product events hold the when and where. Put them on the same timeline per account, and weak signals get loud. A frustration arc in tickets plus stalled feature adoption beats either signal alone. Now you have precision. And a reason leadership believes the chart.
In practice, link tags, sentiment trajectories, and churn mentions to user IDs, accounts, and plan tiers. Then overlay usage drops, failed key actions, and error bursts. Patterns surface. Not guesses. Proof.
I’d argue this pairing becomes your early radar. Without it, you’re flying VFR in fog.
Define The Warning Window Like Finance Would
Renewal timing drives urgency. Treat it like finance treats cash flow. Label 30, 60, and 90-day pre-renewal windows. Mark whether an account later churned or renewed. Your models now learn from behavior inside the window that actually matters.
Two tips help. Align windows to billing cadence, not calendar months, and separate new logo onboarding periods from mature usage. Both have different failure modes. If you blur them, you teach the wrong lesson and risk noisy alerts.
You’ll feel the payoff in planning. Clear windows, cleaner debates.
The Measurable Cost Of Late Churn Detection
Late detection costs time, trust, and money because the team scrambles after signals turn into exits. Most of that waste is preventable. Evidence-backed early warnings shorten cycles and shift work from reaction to prevention. The delta often funds itself within a quarter.
Time Lost Before Renewals
Chasing last-minute saves burns hours. PMs drop everything to triage, CSMs write Hail Mary emails, and leaders beg for discounts. It’s exhausting. A three-week fire drill for one account is common. Multiply by ten accounts and your quarter disappears.
Research shows structured, earlier signals cut save-cycle time and raise conversion odds. AWS’s standard churn examples echo this in their applied guides, where defined features and labeled outcomes improve precision and reduce toil in SageMaker churn workflows. The takeaway lands fast. Early, specific, cheaper.
- Calendar impact: last-minute escalations consume 15 to 25 hours per high-value account.
- Coordination tax: ad-hoc reviews pull 5 to 8 people into meetings that produce thin actions.
- Discount drag: late saves lean on price, which trains customers to wait.
Missed Product Fixes That Compound
When warnings arrive late, you don’t fix root causes. You patch. The same onboarding step fails next month. The same billing confusion returns. The same API timeout sticks around because it never made the roadmap.
- Rework: teams rewrite docs and macros without touching the broken step.
- Blind spots: quiet but costly drivers, like permissions confusion, stay hidden.
- Morale hit: people stop trusting dashboards that never match lived reality.
Most teams fail here not because they don’t care, but because their inputs are wrong.
What Late Warnings Feel Like For Your Team
Late warnings feel like whiplash. You learn about risk in a forecast call, then dig for proof that isn’t there. Everyone looks at you for answers. You look at a tidy chart that doesn’t explain anything. It’s a bad loop.
Fire Drills And Guesswork
Picture a Friday. A top account is red. Renewal in six weeks. You ask for examples. People paste three random tickets in Slack. Not the pattern. Just the loudest ones. You try to craft a plan anyway. It feels like gambling.
The crazy part. The evidence is in your tickets. Nobody’s checking at scale. So the team spins. Meetings stack up. The account notices the scramble and gets nervous.
- You rush a “listening tour” and lose days.
- You over-index on one angry thread and miss the real driver.
- You default to a discount because it’s the only lever you control today.
Leadership Reviews Without Proof
Execs ask for the why. You show a dip in sentiment and a volume chart. They ask for quotes. You have two. It’s thin. Confidence drops. Decisions stall. Or worse, random pet fixes jump the line.
You want to say, let’s pretend we had every metric linked to the exact quotes behind them. Then we’d move fast and feel good about it. That’s the bar now. Anything less is noise.
A Practical Pipeline To Predict Churn 60 Days Earlier
You predict churn 60 days earlier by labeling windows, building features from conversations and usage, validating against a baseline, and routing evidence-backed alerts. The playbook is simple enough to run in weeks. The win shows up in saved accounts and calmer quarters.
Label The Window And Build The Features
Start with data hygiene. Align ticket transcripts, account metadata, and product events. Define 60-day pre-renewal windows per account and create a binary outcome: later churned or renewed. Now build features that reflect behavior inside that window.
Focus on practical, auditable features:
- Sentiment trajectory: slope and volatility, not single scores.
- AI churn-risk flags: presence and frequency inside the window.
- Canonical tags and drivers: counts, diversity, and recency.
- Conversation effort: high-effort flags tied to outcomes.
- Product signals: adoption drops, failed key actions, error clusters.
Validate The Model And Route Alerts
Train a simple baseline on ticket-only features. Then add product features and compare. Measure precision, recall, and how many days earlier you detect risk (lead time). If you don’t beat the baseline by a material margin, keep refining drivers or adjust windows.
Turn results into action:
- Define alert thresholds by segment and ARR band.
- Include 2 to 3 representative quotes with each alert.
- Route to the owner with a short, specific playbook.
- Review weekly, track outcomes, and watch for drift.
Ready to cut the guesswork and see real examples tied to quotes and metrics? See how Revelir AI works.
How Revelir Helps You Predict Churn 60 Days Earlier
Revelir helps you predict churn 60 days earlier by turning every support conversation into structured, traceable metrics and pairing them with analysis you can audit in minutes. The difference is coverage and evidence. No sampling, no black boxes, and every chart links to the exact tickets behind it.
Evidence-Backed Metrics You Can Trust
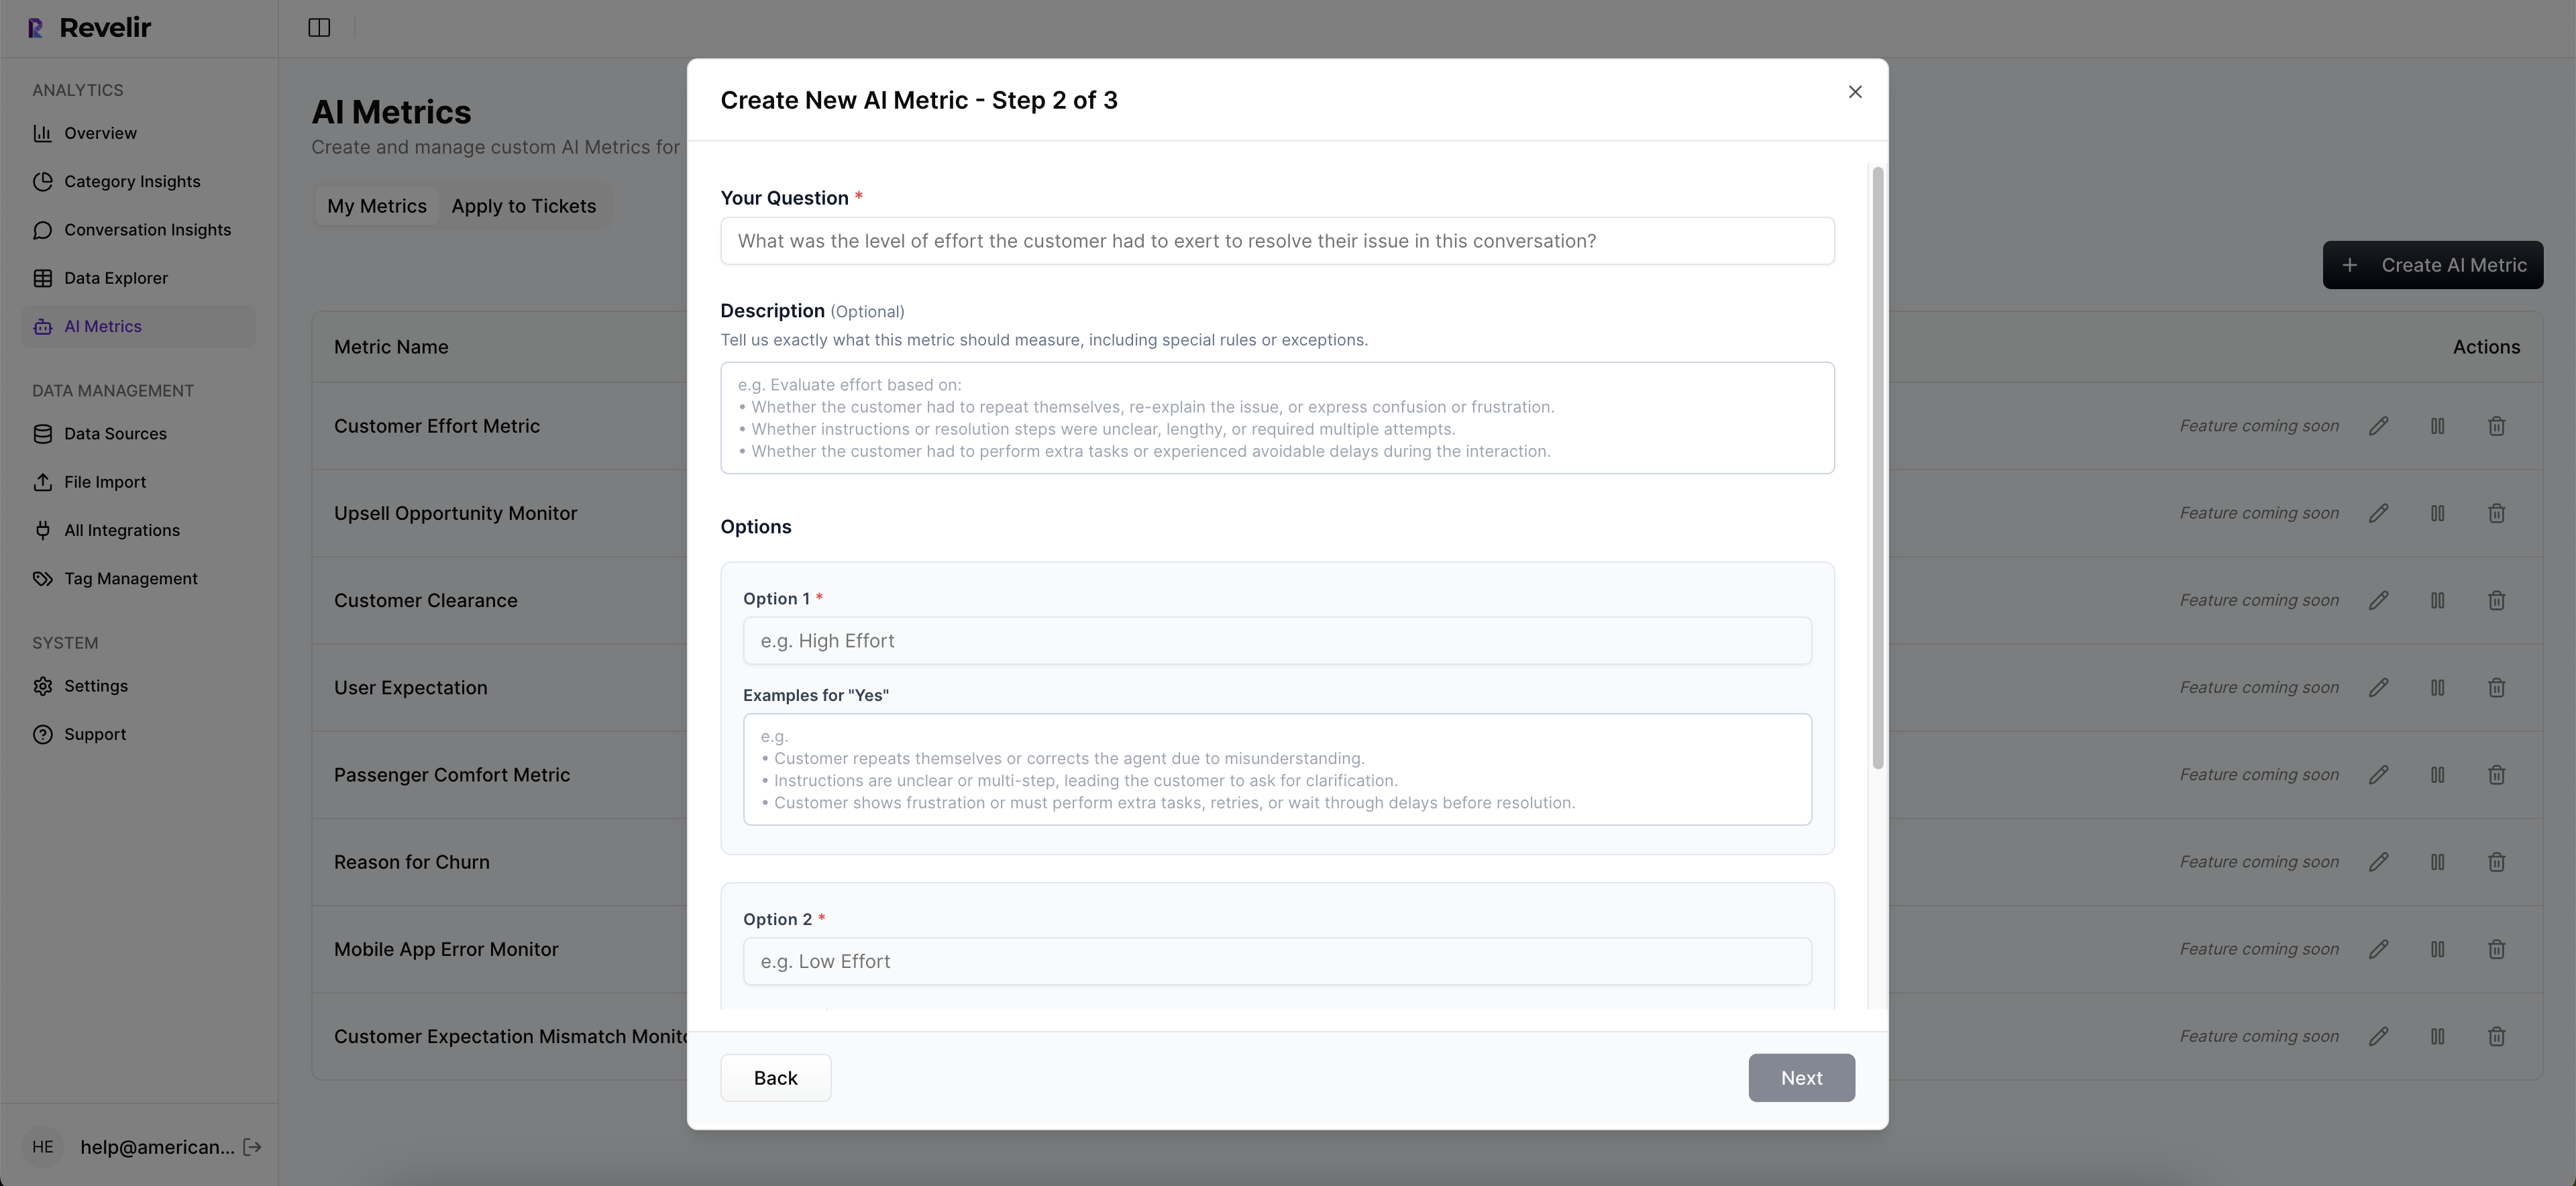
Revelir processes 100% of tickets, computes core AI metrics like Sentiment, Churn Risk, Effort, and Outcome, and pairs them with a hybrid tagging system. Raw Tags surface granular themes, while Canonical Tags roll up into business language stakeholders actually use. You get drivers, not just scores.

Conversation Insights let you jump from any number to the transcript, with AI-generated summaries and quotes ready to drop into a deck. Evidence-backed traceability means tough rooms go quiet fast. You show the line from metric to message. People nod. Decisions move.
From Ad Hoc Slices To Repeatable Analysis
The pivot-table-like Data Explorer lets you filter, group, and sort every ticket by drivers, tags, sentiment, churn risk, and custom AI metrics. Analyze Data summarizes those metrics by driver or tag, with interactive tables that click through to the underlying tickets. Fast, flexible, and auditable.

Key capabilities that enable the pipeline:
- Data Explorer: filter by account segments, drivers, and windows, then drill to transcripts.
- Analyze Data: grouped analysis across Sentiment, Churn Risk, Effort, and custom metrics.
- Custom AI Metrics: define domain-specific classifiers, like Reason for Churn or Upsell Opportunity.
- Full-Coverage Processing: no sampling, so early signals don’t slip through gaps.
- Evidence-Backed Traceability: every aggregate links to exact quotes for review.
Earlier warnings for the accounts that matter. That’s what Revelir delivers. Learn More.
Revelir also meets you where you are. Connect Zendesk directly or upload a CSV to pilot and backfill. Export structured metrics via API into your BI setup once you’ve validated the lift. No workflow rewiring. Just an intelligence layer that makes your existing tools smarter.
Conclusion
Most teams chase late signals and pay the price. The fix isn’t more dashboards. It’s evidence. Label renewal windows, turn conversations and product events into features, validate against a ticket-only baseline, and route alerts with quotes. Do that and you’ll detect churn risk up to 60 days earlier and materially improve early-warning precision on the accounts that count. Stop guessing from samples. Start predicting with proof. Get started with Revelir AI (Webflow)
Frequently Asked Questions
How do I set up alerts for churn risk?
To set up alerts for churn risk using Revelir AI, start by defining your churn windows, typically 30, 60, and 90 days before renewal. Next, create a binary outcome for each account indicating whether they churned or renewed. Use the Analyze Data feature to establish thresholds for alerts based on churn risk flags and sentiment metrics. Finally, route these alerts to the appropriate team members with representative quotes to ensure they have context for action.
What if I want to analyze specific customer segments?
If you want to analyze specific customer segments, use the Data Explorer in Revelir AI. You can filter tickets by various criteria, such as account type, churn risk, or sentiment. This allows you to drill down into the data and see patterns within particular segments. Additionally, you can create custom AI metrics to focus on specific issues relevant to those segments, ensuring your analysis is tailored and actionable.
Can I integrate Revelir AI with my existing helpdesk?
Yes, Revelir AI can integrate directly with your existing helpdesk, like Zendesk. This integration allows you to automatically import historical and ongoing tickets, including all relevant metadata and conversation text. Once connected, Revelir processes 100% of the tickets, ensuring you have comprehensive insights without any manual tagging required. This makes it easier to analyze customer conversations and predict churn effectively.
When should I validate my churn prediction model?
You should validate your churn prediction model after you’ve established your initial features and thresholds. Typically, this involves comparing the model’s predictions against a baseline that uses only ticket data. Regular validation helps ensure that your model improves over time, ideally detecting churn risk earlier than the baseline. Set a schedule for validation, such as monthly or quarterly, to continuously refine your model based on new data patterns.
Why does my team need evidence-backed insights?
Your team needs evidence-backed insights to make informed decisions that drive customer retention. Revelir AI provides structured metrics derived from 100% of support conversations, linking insights directly to the source data. This transparency builds trust with stakeholders and helps avoid guesswork based on incomplete data. By relying on these insights, your team can identify root causes of churn and prioritize fixes effectively, leading to better customer experiences.