

52% of CX leaders say proving ROI is their biggest challenge, yet most of the fight starts earlier: nobody trusts the metric in the first place. If you've had a product review turn into a debate about whether the sample was biased, you already know why metric contracts for CX matter.
Most teams think the dashboard is the product. It isn't. The real product is trust in the number, and trust breaks when nobody can show the underlying ticket, the exact quote, or the rule that produced the KPI.
Key Takeaways:
- Metric contracts for CX work best when they fit on one page and name five things: metric logic, source fields, owner, validation tests, and rollback rule.
- If a conversation-derived KPI cannot link back to sample tickets or quotes, leadership will challenge it sooner or later.
- A useful launch threshold is simple: don't ship a new metric unless coverage is above 95%, sample validation is done, and an owner is named.
- Versioning matters more than most teams expect. If the definition changes by more than 10% of included tickets, publish a new version.
- Escalation rules should map alert to action. If a metric moves past threshold for two straight reporting periods, assign triage inside 24 hours.
- Scores can point at a problem. Drivers and evidence tell you what to fix.
Why Most CX Metrics Get Rejected in the Room
Metric contracts for CX exist because conversation-derived numbers get judged differently than standard BI fields. Finance trusts revenue because the schema is settled. Product trusts uptime because the event definition is stable. CX walks into the room with a churn-risk trend from support conversations, and suddenly everyone asks where the number came from, what sample was used, and whether sentiment was just "AI guessing."

That's not irrational. It's actually fair. A support leader exports 800 Zendesk tickets on Thursday, reads 40 by hand on Friday, shows five screenshots on Monday, and calls it a trend. The PM pushes back. The COO asks whether enterprise tickets were overweighted. The insights lead wants to know if the tags changed from last month. Three smart people, one bad system.
The hidden blocker isn't dashboard design. It's missing governance. I call this the Evidence Gap: the space between a reported metric and the proof required to defend it. If the gap is bigger than two clicks, the room stops trusting the number. Honestly, that's the part most teams underestimate.
Manual review creates confidence theater
A lot of teams still believe human review is the safe option. And look, I get it. Reading tickets feels rigorous because you're close to the customer voice. But close isn't the same as reliable.
Once ticket volume passes about 500 conversations a month, manual review turns into confidence theater. One analyst samples 50 tickets. Another samples 75. They use slightly different labels, interpret frustration differently, and roll findings into a slide. You get a metric-shaped object, not a stable metric. Same thing with executive readouts built from screenshot collections. They feel concrete right up until somebody asks, "How often is this happening really?"
Scores hide the operational question
CSAT and NPS aren't useless. That's the concession. They can flag movement fast, and for broad trend tracking they still have a place. But if you're trying to decide what product or support should fix this week, scores alone are weak instruments.
A score tells you temperature. It rarely tells you cause. If CSAT falls three points, is the issue onboarding friction, billing confusion, slow response loops, or account access? Without drivers, tags, and traceable examples, you're still guessing. That's why score-watching creates false certainty. It gives you motion without mechanism.
The trust test happens before the strategy test
Here's the rule I use: if a leader can challenge the sourcing, schema, or evidence trail in under 30 seconds, the KPI is not ready for a roadmap conversation. Not because it's wrong. Because it's undefended.
That's the emotional drag here too. You spend a week pulling together the readout, then the meeting becomes a courtroom. The number may be directionally right, but now you're defending methodology instead of deciding what to fix. And once that happens a few times, teams stop bringing bold CX insights forward. The next question is obvious: what makes a conversation-derived metric defensible?
What Metric Contracts for CX Actually Do
Metric contracts for CX turn fuzzy conversation metrics into governed assets. In plain English, a metric contract is a one-page agreement on how a KPI is defined, where it comes from, who owns it, how it's tested, and when it gets rolled back. The point isn't paperwork. The point is ending avoidable arguments before they start.
If you want a named framework, use the 5D Contract. Definition, Data, Decision use, Drift controls, and Drill-down evidence. If one of those five is missing, the metric will wobble. If two are missing, don't ship it.
A decent contract also changes behavior. Instead of launching "churn risk from support" because it looks interesting in a pilot, you launch version 1.0 with source fields, validation steps, and a known owner. That's a very different standard. It's usually the difference between "interesting chart" and "operational KPI."
Definition: write the metric so a skeptic can't reinterpret it
A metric definition should survive hostile reading. That means naming the unit, the time window, the inclusion rules, and the output states. For example, "High-effort onboarding conversations, weekly share of support tickets from new customers in their first 30 days, classified as high effort." That is harder to wiggle out of than "onboarding effort metric."
This is where a lot of metric contracts for CX fail. Teams write labels, not definitions. Then three departments use the same phrase to mean three different things. If the metric name can be interpreted two ways, pick a longer name. Clarity beats elegance.
Use this minimum definition block:
- Metric name
- Business question
- Included conversations
- Excluded conversations
- Time window
- Value outputs
- Reporting cadence
If you can't fill those seven lines in 10 minutes, the metric isn't mature enough yet.
Data: lock the source fields before people start debating outcomes
The second part of the contract is boring. Good. Boring is what you want in governance. Name the source system, source fields, ingestion path, and refresh rule. If the tickets come from Zendesk, say that. If a pilot uses CSV exports, say that too. If agent notes are excluded, write it down.
The Source-Lock Rule is simple: if source fields change, metric status changes to provisional until revalidated. That one rule saves a shocking amount of pain. We've seen teams quietly alter exported fields, then wonder why month-over-month movement looks strange. Nobody's checking because everybody assumes the dashboard stayed constant.
A practical launch threshold helps here. Don't launch a metric if coverage is below 95% of expected conversations for the reporting period. Under that line, interpretation gets messy fast.
Decision use: say what the metric is allowed to influence
Not every metric should drive escalation. Not every metric belongs in a board deck. Some are diagnostic only. Some are leading indicators. Some are triage triggers.
So spell it out. If a metric is for weekly support ops review, say that. If it can trigger a product bug investigation but not staffing decisions, say that too. This is the Permission Layer. It keeps teams from overreading early metrics.
And yes, there's a counterpoint. Some leaders hate constraints because they think it slows adoption. Fair point. But the opposite is usually true. When people know exactly how a metric should be used, they're more willing to use it.
Drift controls and drill-down evidence: stop silent failure
Conversation metrics drift. Taxonomies change. Ticket mix changes. Product launches create new language. If you don't plan for that, a metric can stay visible while meaning something slightly different every month.
So add two controls. First, versioning. If mapping logic, source fields, or inclusion rules materially change, issue a new metric version. My rule is 10%: if the change affects more than 10% of included tickets, version it. Second, evidence. Every KPI should link to a small validation set of representative conversations or quotes so people can inspect reality, not just the aggregate.
That one move changes the conversation. You're no longer saying, "Trust the model." You're saying, "Inspect the evidence." That's a better posture. But contracts alone aren't enough. You still need a way to test whether the metric is safe to use.
How to Validate a Conversation KPI Before Leadership Sees It
A conversation KPI is only useful to leadership if people can trust where it came from. That means two things: full coverage of your support data and a clear path back to the real conversations behind the number. Miss either one, and you're taking avoidable risk into the room.
This is the part teams skip because they're in a hurry. Big mistake. Launching an untrusted support metric isn't just a data issue. It changes what product fixes, what support escalates, and what leadership believes is broken.
Coverage testing catches false confidence early
Coverage sounds obvious, but most teams still treat it as implied. It isn't. Let's pretend you believe you're analyzing all support conversations, but your export missed one major queue, one date range, or one language segment. Now the KPI is "complete" in the dashboard and incomplete in reality.

This is where Revelir AI helps by processing 100% of ingested tickets instead of relying on manual sampling. You can bring in historical and ongoing conversations through the Zendesk integration or upload CSV exports for pilots and backfills, then analyze the full dataset without tagging everything by hand first.
Once the data is in, you can inspect it directly in Data Explorer, filter and group tickets across the fields that matter, and drill into individual conversations when something looks off. That matters because false confidence usually shows up in the gaps between the dashboard and the underlying tickets.
Sample validation proves the label means what you think it means
You still need to look at real conversations. Just not blindly. A KPI becomes much more defensible when every aggregate number links back to the source tickets and quotes behind it.
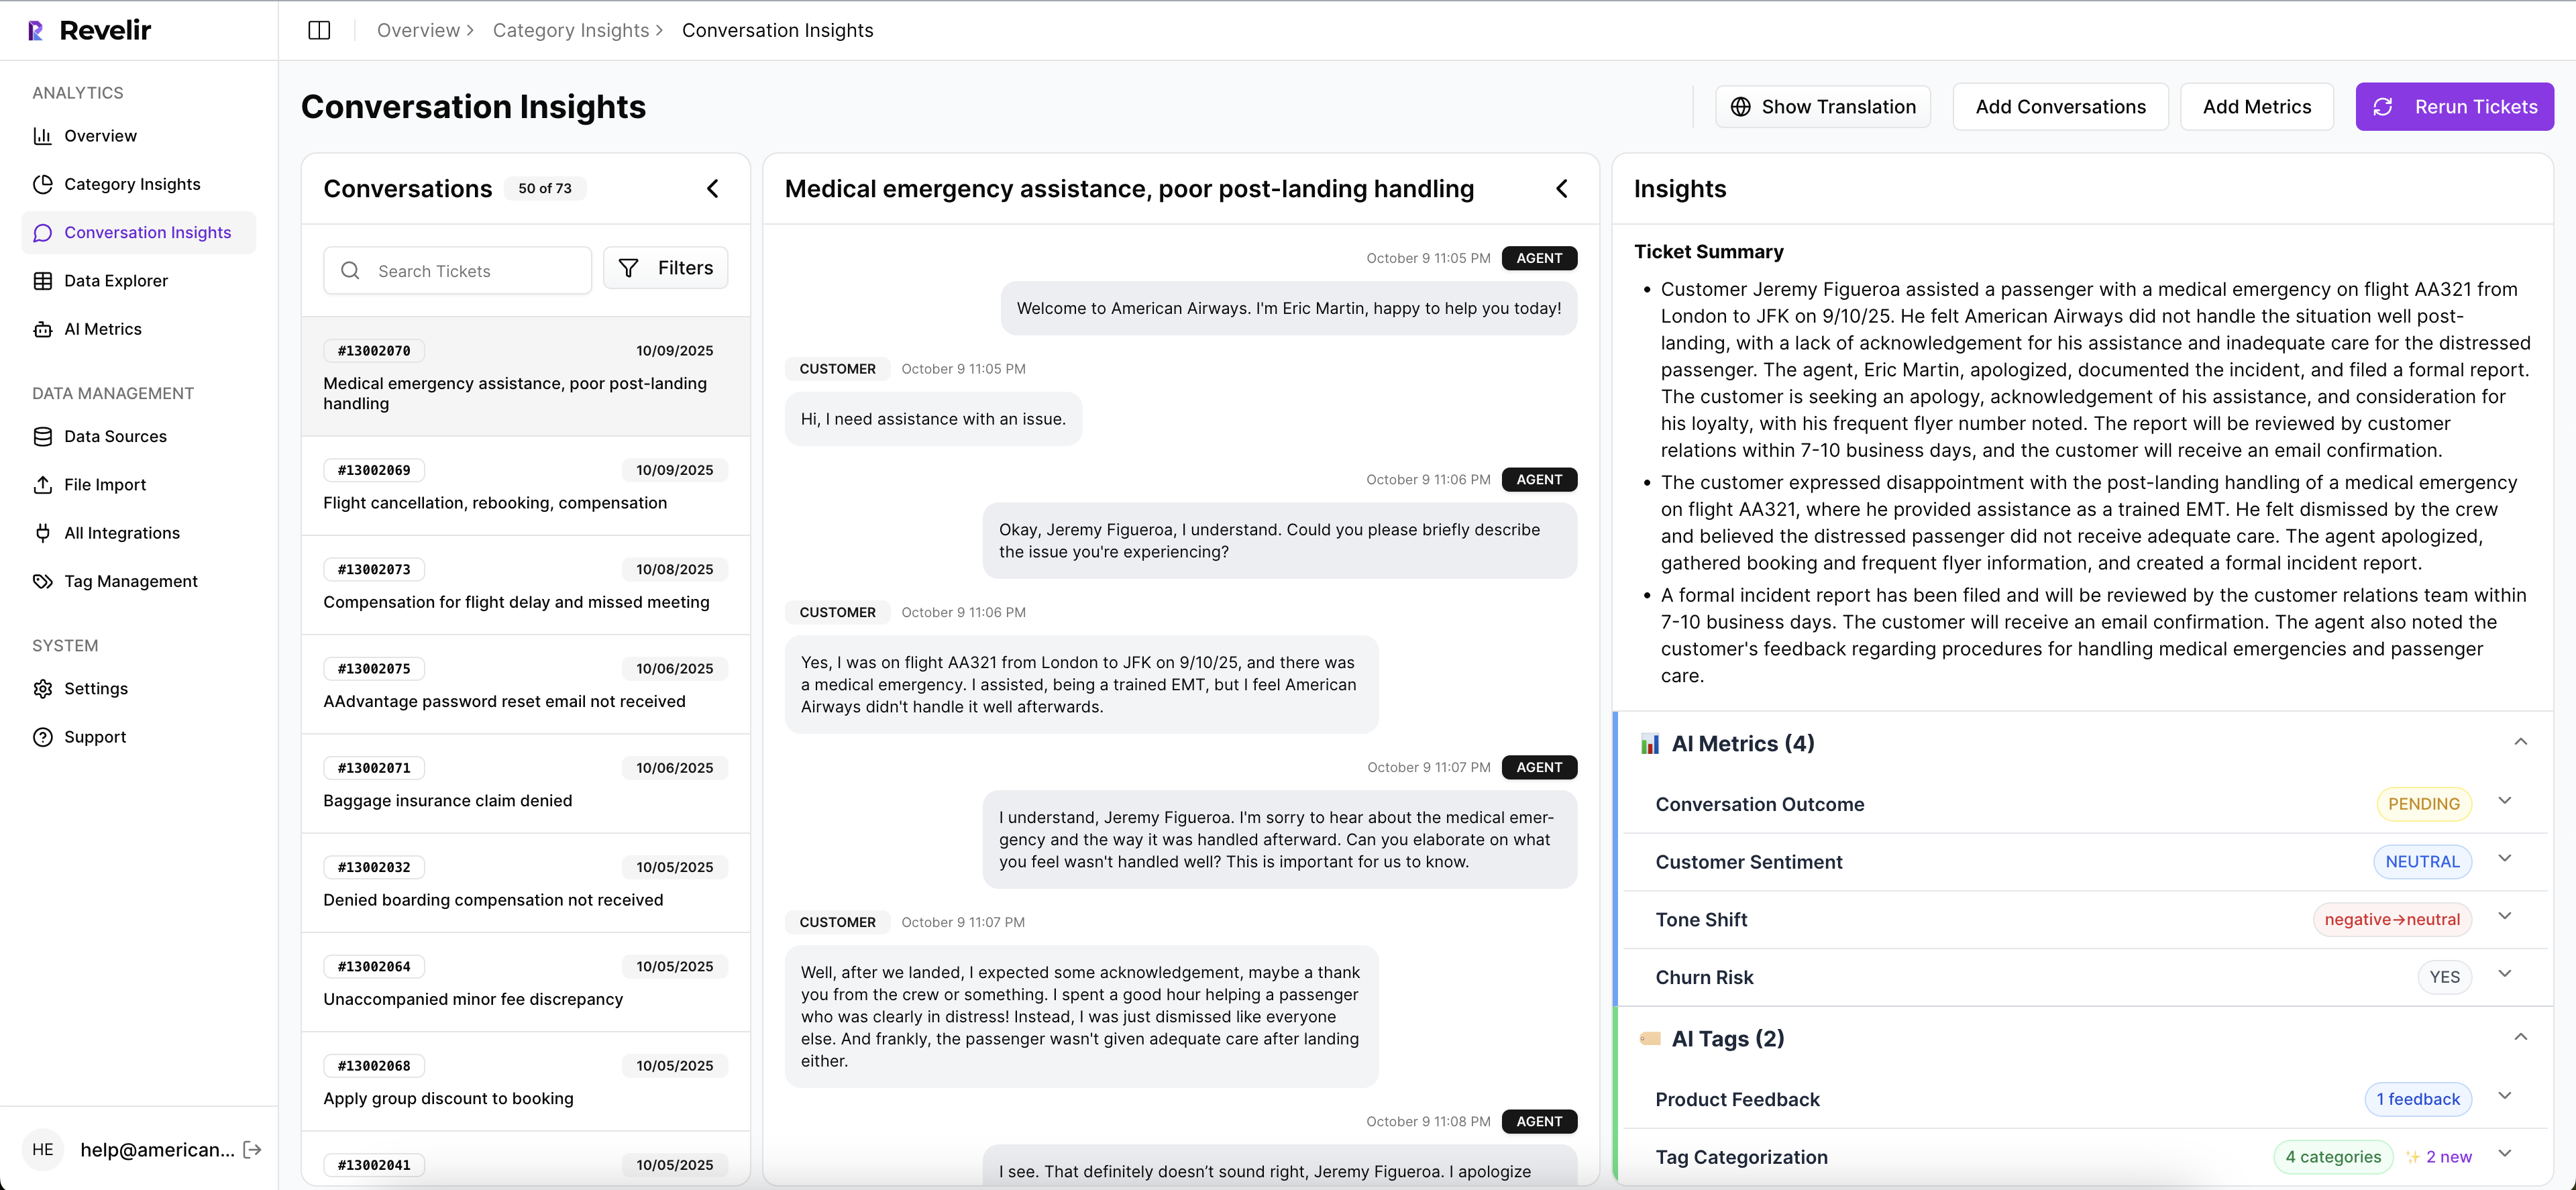
Revelir AI makes that review practical. Conversation Insights gives you ticket-level drill-down with full transcripts, AI-generated summaries, assigned tags, drivers, and AI metrics. If a pattern looks important in reporting, you can open the exact conversations behind it and see whether the classification holds up in context.
That same workflow is what makes custom metrics usable in practice. If you're defining something domain-specific, Revelir stores the result as a structured field you can filter, analyze, and inspect alongside the original conversations. And if the pattern needs cleaner reporting categories, the hybrid tagging system lets you map raw tags into canonical tags and refine that taxonomy over time.
Traceability matters more than a clean-looking chart
Most teams stop at "does the chart look right?" That's not enough. You need to know whether you can defend the chart when someone asks for examples.

This is where Revelir tends to stand out. Every aggregate number can be traced back to the conversations underneath it, which makes the insight easier to audit, explain, and act on. Instead of arguing over whether a metric feels believable, teams can move from the grouped analysis into the exact tickets, summaries, and quotes that shaped the result.
Analyze Data helps here by summarizing metrics like sentiment, churn risk, effort, or custom fields across dimensions such as Driver, Canonical Tag, or Raw Tag. The tables and stacked bar charts are interactive, so leadership can start with the trend and your team can follow it back to the evidence.
Better KPIs come from drivers, not just scores
The metric itself isn't the finish line. The point is to understand what's driving it.
That's why leadership reporting gets stronger when you pair AI metrics with drivers and tags instead of treating sentiment or churn risk as standalone answers. Revelir AI automatically computes core signals like Sentiment, Churn Risk, Customer Effort, and Conversation Outcome, but the real value comes when you analyze those signals by Driver, Canonical Tag, or custom metric to answer the bigger question: why is this happening?
If you want to see how a governed support data workflow comes together in practice, See how Revelir AI works. The bigger shift, though, isn't just validation. It's designing metrics around drivers instead of generic scores.
Build CX Metrics Around Drivers, Not Just Scores
Drivers make metric contracts for CX useful because they connect movement to cause. A score can tell you something changed. A driver can tell you why. And if you can't get to why, you can't prioritize fixes.
Think about two dashboards. One says negative sentiment is up 12%. The other says negative sentiment is up 12%, driven by billing fee confusion in SMB accounts and onboarding delays for new enterprise admins. Those are not the same artifact. One is a symptom monitor. The other is a decision tool.
The Driver Stack turns noise into action
The framework I like here is the Driver Stack: signal, driver, tag, quote. Signal is the metric movement. Driver is the broad reason. Tag is the specific issue pattern. Quote is the evidence. If one layer is missing, action slows down.
That structure matters because support data is messy by default. Customers don't speak in neat categories. They ramble, stack issues, vent, and mix bug reports with policy complaints. Same thing with internal tagging. It drifts because language drifts. That's why a rigid one-layer taxonomy usually breaks.
The better approach is a two-layer system. Let granular issue patterns emerge, then roll them up into stable reporting buckets. If raw patterns keep changing but the driver stays stable, leadership still gets continuity.
Custom business-language metrics beat generic sentiment
Basic sentiment is a useful starter signal. It is not a full operating model. A support org might care about refund friction. A product team might care about setup confusion. A marketplace might care about trust and safety mentions. Those are business-language metrics. That's where the real value is.
The If-Then rule here is straightforward: if the decision you're trying to drive is specific, the metric needs to be specific too. Don't ask a generic score to answer a narrow operational question.
Examples of better CX metrics:
- Billing confusion rate for customers in first invoice cycle
- Repeat-contact risk for unresolved onboarding cases
- Churn mention share for accounts over a certain ARR band
- High-effort recovery rate after policy exceptions
These are sharper because they map to actual decisions. They also force cleaner contracts.
Ad hoc analysis has to be fast or teams stop using it
This sounds minor. It isn't. If answering a new question takes a week of exports and cleanup, the org falls back to anecdotes. Fast ad hoc analysis is one of those hidden thresholds. Under 10 minutes, teams explore. Over 2 days, they politic.
That's why the operating standard should be this: a CX or product lead can test a question, slice the affected segment, and inspect source conversations in one session. No new BI build. No data request backlog. No reinvention. The metric contract gives you the governance. The analysis layer gives you the speed. So what does that look like when you put software behind it?
How Revelir Makes Metric Governance Practical
Revelir AI makes metric contracts for CX usable because it ties custom conversation metrics, fast analysis, and evidence together in one workflow. You don't need to rip out your helpdesk. Plug it into Zendesk or upload a CSV, then work from the conversations you already have.
Custom metrics that match your business language
Revelir AI lets teams define Custom AI Metrics with their own questions and value options, not just settle for generic sentiment labels. That matters when your operating questions are things like churn mention, onboarding friction, upsell opportunity, or reason for churn. Instead of forcing your business into a canned schema, you shape the metric around the decision you need to make.
That changes how contracts get written. The metric definition can reflect your internal language, and the output becomes a structured field you can actually use in analysis. More important, you can stop pretending one broad score can answer every real CX question.
Data Explorer and grouped analysis reduce the lag between question and proof
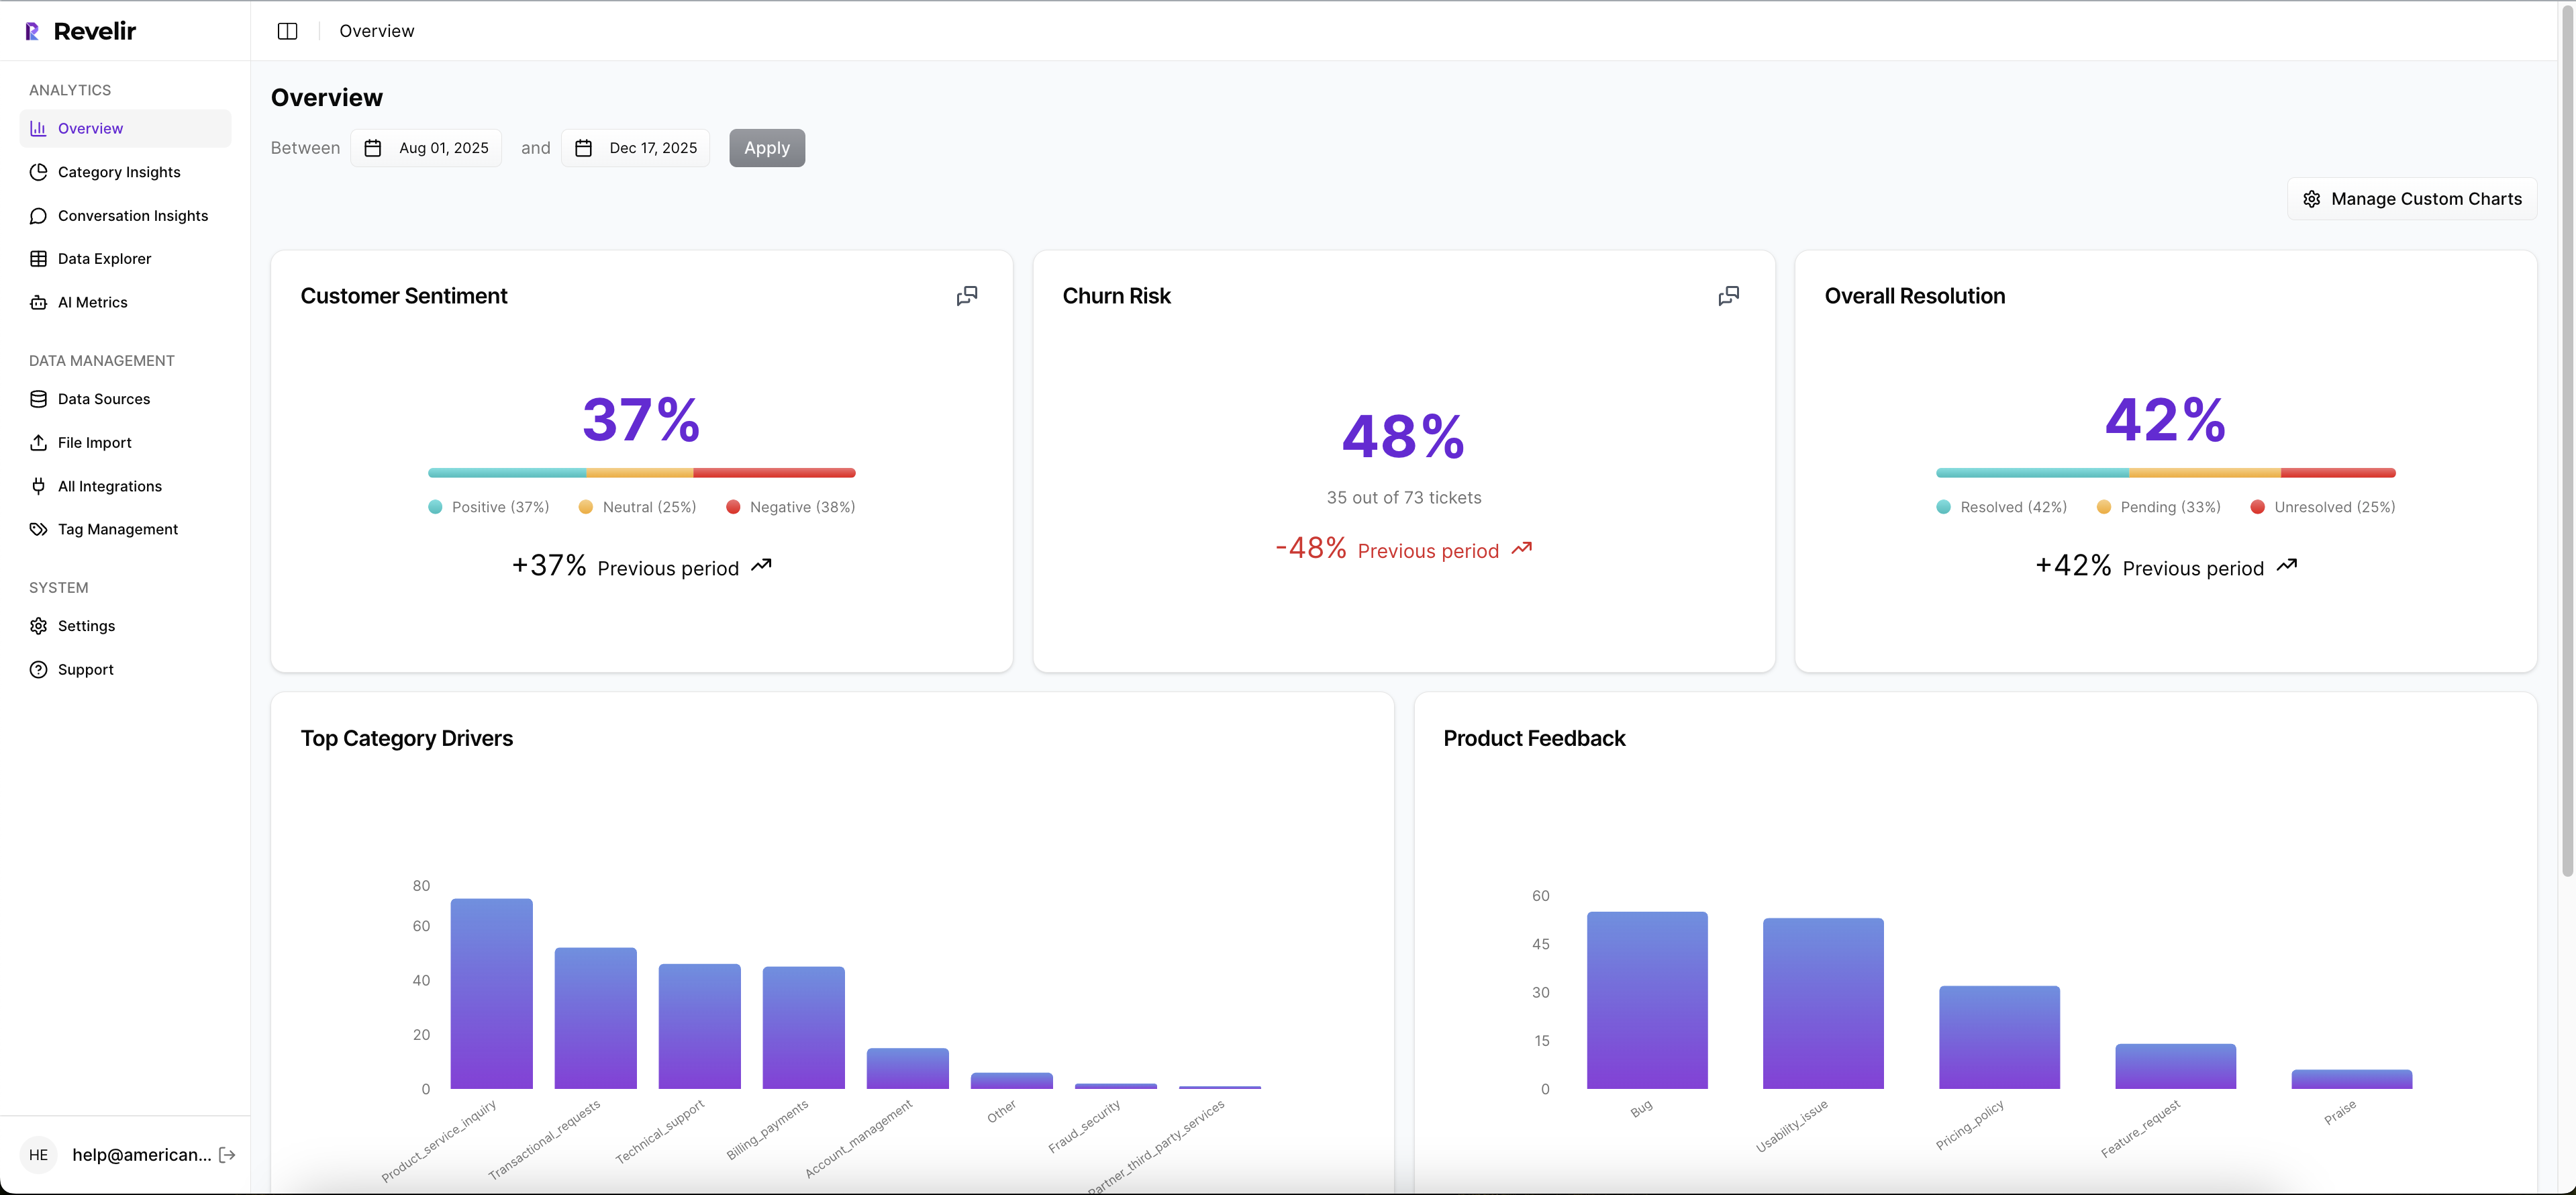
Revelir AI's Data Explorer gives you a pivot-table-like workspace to filter, group, sort, and inspect every ticket with columns for sentiment, churn risk, effort, tags, drivers, and custom metrics. If your team wants to know which driver is pushing high-effort conversations up this month, you can slice that directly instead of exporting data into a spreadsheet maze.
Analyze Data adds a grouped analysis layer on top, summarizing metrics by Driver, Canonical Tag, or Raw Tag with interactive tables and stacked charts that link back to the underlying tickets. That matters because decision cycles slow down when every follow-up question requires a new analysis pass. Revelir AI keeps the loop tight: question, group, inspect, validate.
Traceability is what makes the KPI hold up
This is the part I think matters most. Revelir AI links aggregate numbers back to source conversations and quotes through evidence-backed traceability and ticket-level Conversation Insights. So when leadership asks, "Show me what this actually means," you can drill into the underlying tickets, read transcripts, review summaries, and inspect the assigned drivers, tags, and AI metrics.
Revelir AI also processes 100% of ingested tickets, whether they come through the Zendesk integration or CSV ingestion, which cuts out the debate about whether the sample was representative in the first place. If you already have downstream reporting in place, API Export lets you move structured metrics into your existing BI workflow after analysis. If you want to make support metrics defendable without changing your workflow first, Get started with Revelir AI (Webflow).
Make the Metric Defensible First
Metric contracts for CX are really about one thing: reducing the distance between a number and the evidence required to trust it. Once that distance shrinks, meetings get shorter, prioritization gets cleaner, and the argument shifts from "is this real?" to "what do we do now?"
Start small. One metric. One contract. One validation pass. Then version it, test it, and attach action rules to it. That's how you cut metric disputes and speed up decisions. Revelir AI fits into that model cleanly because it sits on top of your current support data, turns conversations into structured signals, and keeps every number tied to the tickets behind it.
Frequently Asked Questions
How do I ensure my metrics are defensible?
To make your metrics defensible, start by creating a metric contract that includes a clear definition, source fields, and validation tests. Use Revelir AI to process 100% of your support tickets, ensuring no data is missed. This way, you can link every aggregate number back to the original conversations for transparency. Additionally, establish a rollback rule to address any significant changes in metric definitions, and ensure an owner is assigned to maintain accountability.
What if my team struggles with metric validation?
If your team finds metric validation challenging, consider using Revelir AI's Conversation Insights feature. This allows you to drill down into ticket-level details, including full transcripts and AI-generated summaries. By inspecting these details, you can validate whether the classifications and metrics hold up in context. Additionally, ensure that your metrics are linked to evidence-backed traceability, which helps in defending your findings during discussions.
Can I customize metrics for specific business needs?
Yes, you can customize metrics in Revelir AI to match your specific business language and needs. Use the Custom AI Metrics feature to define domain-specific classifiers, such as churn mention or onboarding friction. This allows you to create metrics that directly address your operational questions rather than relying on generic sentiment scores. By tailoring your metrics, you can ensure they provide actionable insights relevant to your team's objectives.
When should I update my metric definitions?
You should update your metric definitions whenever there are significant changes in the data or methodology used to calculate them. A good rule of thumb is to publish a new version if the definition changes by more than 10% of included tickets. This ensures that your metrics remain accurate and trustworthy. Revelir AI's versioning feature helps you manage these updates effectively, keeping your metrics aligned with current data.