

84% of CX leaders now expect support to influence product and retention, yet a surprising number still walk into reviews with sampled tickets, patched-together spreadsheets, and AI summaries they can’t defend. If you had to validate AI outputs in support this week and felt your stomach drop when someone asked, “What tickets is that based on?”, this is the operating problem underneath it.
It’s usually not that the team lacks data. It’s that nobody’s checking whether the numbers can survive a follow-up from product, finance, or the CEO. Same thing with AI insights: they look sharp right up until someone asks for the ticket trail.
Key Takeaways:
- Sampling support tickets creates false certainty, especially once volume moves past a few hundred conversations a month.
- If you can’t trace a chart back to real tickets and quotes, you don’t really have an insight. You have a claim.
- The fastest way to validate AI outputs in support is to combine full coverage, structured metrics, and ticket-level traceability.
- A hybrid tagging model works better than pure manual tagging or pure black-box AI for most CX and product teams.
- If leadership asks “why is this happening?” score-only dashboards won’t get you there. Drivers and evidence will.
- You don’t need a new helpdesk to do this. You need an intelligence layer on top of the one you already have.
Why Most Support AI Outputs Fail the Credibility Test
AI outputs in support fail when they can’t be validated against source conversations. That sounds obvious, but it breaks in real life because the operating model still assumes a chart is enough. It isn’t. To validate AI outputs in support, you need a claim that can be interrogated without collapsing.
If you want a fast next step before rebuilding your workflow, you can Learn More about what an evidence-backed support intelligence layer looks like.
The issue isn’t AI accuracy alone
Accuracy is only half the story; credibility is the other half, and credibility is where most teams quietly lose the room. A model can be directionally right and still fail the meeting because nobody can explain coverage, logic, or evidence on the spot.
That’s the 3-Proof Test: coverage, logic, evidence. Coverage answers how much of the dataset was analyzed. Logic explains how the system classified or grouped the issue. Evidence points to the exact tickets, quotes, and segments behind the conclusion. Miss one, and what looked like analysis starts behaving like opinion in nicer formatting.

Let’s pretend a support leader walks into Monday’s ops review with a slide that says billing frustration rose 18% this month. Product asks whether that came from 42 reviewed tickets or 4,200. Finance asks whether enterprise renewals are overrepresented. The room, which looked aligned for about 11 seconds, suddenly isn’t discussing billing anymore; it’s discussing whether the chart deserves to exist. That’s not an AI failure. That’s a proof failure.
Sampling breaks faster than teams think
Around 500 tickets per month, manual review stops being scrappy and starts becoming statistically theatrical. You feel informed because you’ve read some conversations. Meanwhile the long tail—the weird cancellations, the quiet onboarding failures, the customers who sound calm right before they leave—slides past unseen.

At 8:14 AM on a Thursday, a CX manager exports 200 Zendesk tickets into CSV, opens a color-coded Google Sheet, and tells herself she’ll sample 30 before lunch. By 1:07 PM she’s tagged 24, skipped seven because they were messy, and posted a “top issues” summary in Slack. Product replies asking whether the billing spike is real or just a noisy week. Support disagrees with the sample. By 3 PM the team is debating the method instead of the problem. Exhausting. And weirdly normal.
Sampling does have a place. If you handle 50 tickets a month, careful manual reading can still beat a premature analytics stack. Fair point. But once volume rises and support data becomes an input to product prioritization or retention planning, sampled review turns into a stage prop: convincing from the audience, hollow when you walk behind it.
According to the Zendesk CX Trends report, support teams are under growing pressure to turn service data into broader business insight, not just queue management. That pressure raises the cost of bad validation because the audience is no longer just support ops. You can see the broader shift here: Zendesk CX Trends.
What breaks trust is the missing trail
What if the model is decent, the chart is clean, and trust still evaporates? That usually means the missing piece is traceability, not math. Leaders don’t need perfection. They need receipts.
There’s a fair defense of simpler dashboards. For queue health, SLA breaches, and staffing decisions, scoreboards are often enough. True. But the moment the question becomes “which issue is driving churn risk for enterprise customers during onboarding?” the scoreboard becomes a speedometer with no windshield. You know something changed. You don’t know what’s in front of you.
Support analytics works the same way a call center recording does in litigation: the summary helps, but the transcript decides the argument. If the output can’t survive one follow-up question, it was never decision-grade in the first place. So what does a system look like when the proof is built in rather than patched on later?
The Real Job Is to Validate AI Outputs in Support With Evidence
The answer is an evidence chain, not a prettier dashboard. To validate AI outputs in support, you need full conversation coverage, structured signals, and a direct path back to the underlying transcript. Once that chain exists, the conversation changes from “should we trust this?” to “what should we do about it?”
Scores tell you what moved, not why
A CSAT dip is a signal, not a diagnosis. Useful, yes. Sufficient, no.
That distinction matters because teams often treat scores like finished analysis. Then the scramble begins. Someone sees a drop, pulls a few dramatic tickets, and reverse-engineers a story the room can live with. Having started with the number instead of the cause, they end up overfitting to memorable anecdotes.
Use the Why Ladder instead:
- Start with the signal
- Group by driver
- Check canonical tags
- Read source tickets
- Pull representative quotes
If you can’t climb that ladder in under 10 minutes, you don’t have an insight system. You have a scavenger hunt. Before, the workflow was score first, evidence later. After, the workflow is score, driver, ticket, quote—fast enough to use in the meeting, not after it.
Hybrid tagging beats either extreme
Anecdotally, the teams that trust their support analytics fastest are rarely the ones using pure manual tagging or pure black-box labels. They use both, but for different jobs.
Pure manual tagging preserves nuance and business context. That’s real value. It’s also expensive, inconsistent across reviewers, and brittle once ticket volume climbs. Pure black-box labeling scales beautifully. Also true. But if the model invents categories the business doesn’t use, the output dies in the exec deck even when the pattern is real.
The better middle ground is a hybrid model: AI surfaces raw, emerging themes; humans organize those themes into canonical business language. Here’s the conditional rule: if emerging issues matter, start with AI-generated raw tags; if executive reporting matters, map them into human-aligned canonical tags within the same workflow. One finds signal. The other creates adoption.
This is the same reason product teams separate raw user research notes from roadmap themes. Discovery likes mess. Decision-making does not. And that’s exactly why hybrid tagging is usually the fastest way to validate AI outputs in support without losing either nuance or trust.
Full coverage changes the conversation
Contrast two meetings. In one, the room argues about whether the sample was representative. In the other, everyone accepts the coverage and argues about severity, segment concentration, and timing. Only one of those meetings produces an actual decision.
Processing 100% of conversations doesn’t make the model magically smarter. It makes the discussion sharper. Gone is the old debate about whether the analyst happened to read the right 25 tickets. In its place comes a much more valuable set of questions: Which customer segment is hit hardest? Did this spike begin after a product release? Is effort rising before churn risk rises?
There’s a surprising connection here between traceability and speed. Most teams assume proof slows them down because it sounds like extra process. Usually the opposite happens. Once every aggregate can be clicked back to real tickets and quotes, you stop re-litigating confidence from scratch in every meeting.
McKinsey has made a similar point about using unstructured customer feedback more systematically across the business, especially when leaders need to move beyond anecdotes: McKinsey on customer feedback analytics.
Coverage removes the “what did we miss?” argument. Evidence removes the “is this real?” argument. The next question, then, is operational: how do you build that into a metrics system people can actually run?
A Practical System for Decision-Grade Support Metrics
A decision-grade support metrics system turns messy free-text conversations into structured, reviewable evidence. Four parts matter: full ingestion, structured signals, driver-based organization, and ticket-level validation. Miss one, and the whole system starts reading like a deck built for applause instead of action.
Start with the Validation Chain
First things first: build the audit path before you build the dashboard. Not later. First.
Call it the Ticket-to-Chart Chain: transcript, tags, driver, metric, grouped view, source quote. Each link compresses complexity one step further. And each missing link makes the final chart softer. By the time the slide reaches leadership, a broken chain behaves like a rumor with branding.
Picture a product ops lead prepping for roadmap planning after cancellation-related frustration jumps. In the weak version, she shows a trend line and hopes nobody asks for detail. In the strong version, she shows the same trend, breaks it out by driver, filters enterprise accounts, and pulls five representative tickets with exact customer language. One version invites a 20-minute argument about methodology. The other invites a decision.
Use this threshold: any metric shown to leadership should be auditable back to at least 3 underlying conversations within 2 clicks or 2 minutes. If it takes longer, people stop validating and start hand-waving.
Organize around drivers, not just labels
What leaders need is not 300 micro-labels but a coherent explanation of friction. Labels help analysts inspect data. Drivers help operators act on it.
Drivers are the business-layer categories behind the noise: billing, onboarding, access, performance, cancellations, policy confusion. The trick is compression without erasure. Keep raw tags and canonical tags beneath the surface, but make the leadership view answer the question people actually ask: what is driving the pain?
There’s a real downside here. Over-aggregation can hide the edge cases that become tomorrow’s escalations. That concern is valid. The fix is not to avoid drivers; it’s to govern them with thresholds. Use this rule: if a category exceeds 15% of monthly negative conversations, split it into sub-drivers; if it stays below 3%, keep it nested unless it affects strategic accounts. That way you preserve signal without turning the slide into confetti.
Use custom metrics in business language
Why do so many support dashboards get ignored? Because they answer the vendor’s default questions instead of the business’s recurring ones.
“Negative sentiment” is fine as a generic field. “Renewal risk due to onboarding friction in enterprise accounts” is what a revenue team can act on. Same thing with cancellation reasons, policy confusion, ownership gaps, or upgrade blockers. If leadership repeats a question three meetings in a row, that question deserves to become a metric.
That’s the Question-First Rule: if a business question appears in 3 consecutive leadership reviews, operationalize it as a tracked metric; if it appears once a quarter, keep it as ad hoc analysis. Before, analysts answer the same question manually every month. After, the question becomes part of the system, searchable and traceable.
And yes, custom metric design takes thought up front. Fair. But that upfront tax is smaller than the endless tax of rebuilding the same answer in every review.
Make validation part of the workflow, not a cleanup step
By the time unvalidated outputs are already circulating, the political damage is done. Validation has to happen inside the workflow, where analysts and leaders can inspect the weird cases before the slide hardens into “truth.”
A simple cadence works better than an elaborate one:
- Review grouped shifts weekly
- Drill into outliers immediately
- Pull source quotes before leadership reviews
- Refine taxonomy when repeated mismatches appear
That fourth step matters more than teams expect. If the same raw theme lands in the wrong category three times in a week, the taxonomy is teaching the model the wrong lesson. Fix it then. Not next quarter.
Think of the taxonomy like QA for your own reporting language. Left unattended, small mislabels compound the way tiny accounting errors do: invisibly at first, painfully at close. Build validation into the workflow, and the next question becomes practical rather than theoretical—which tool actually makes this fast enough to stick?
How Revelir Makes Validation Fast Enough to Use
That’s where an intelligence layer matters. Revelir sits on top of existing support data so teams can validate AI outputs in support without replacing their helpdesk or inventing a new ticket workflow. The point isn’t more dashboards. It’s faster, more defensible answers from the conversations you already have.
Full coverage and hybrid structure
100% coverage changes the starting point. Revelir AI processes all ingested tickets through Zendesk Integration or CSV Ingestion, which removes the sampling problem before analysis even begins.
Then comes the hybrid structure. Revelir’s Hybrid Tagging System uses Raw Tags to surface messy, emerging themes and Canonical Tags to map those themes into business language that leadership can actually use. Because those mappings improve over time, teams don’t have to choose between day-one flexibility and long-term reporting consistency.
Before, a team samples tickets and argues about representativeness. After, the full set is analyzed and the discussion moves to drivers, segments, and severity. That’s a better conversation.
Metrics you can trace back to tickets
The feature that matters most is not another score. It’s the audit trail behind the score.
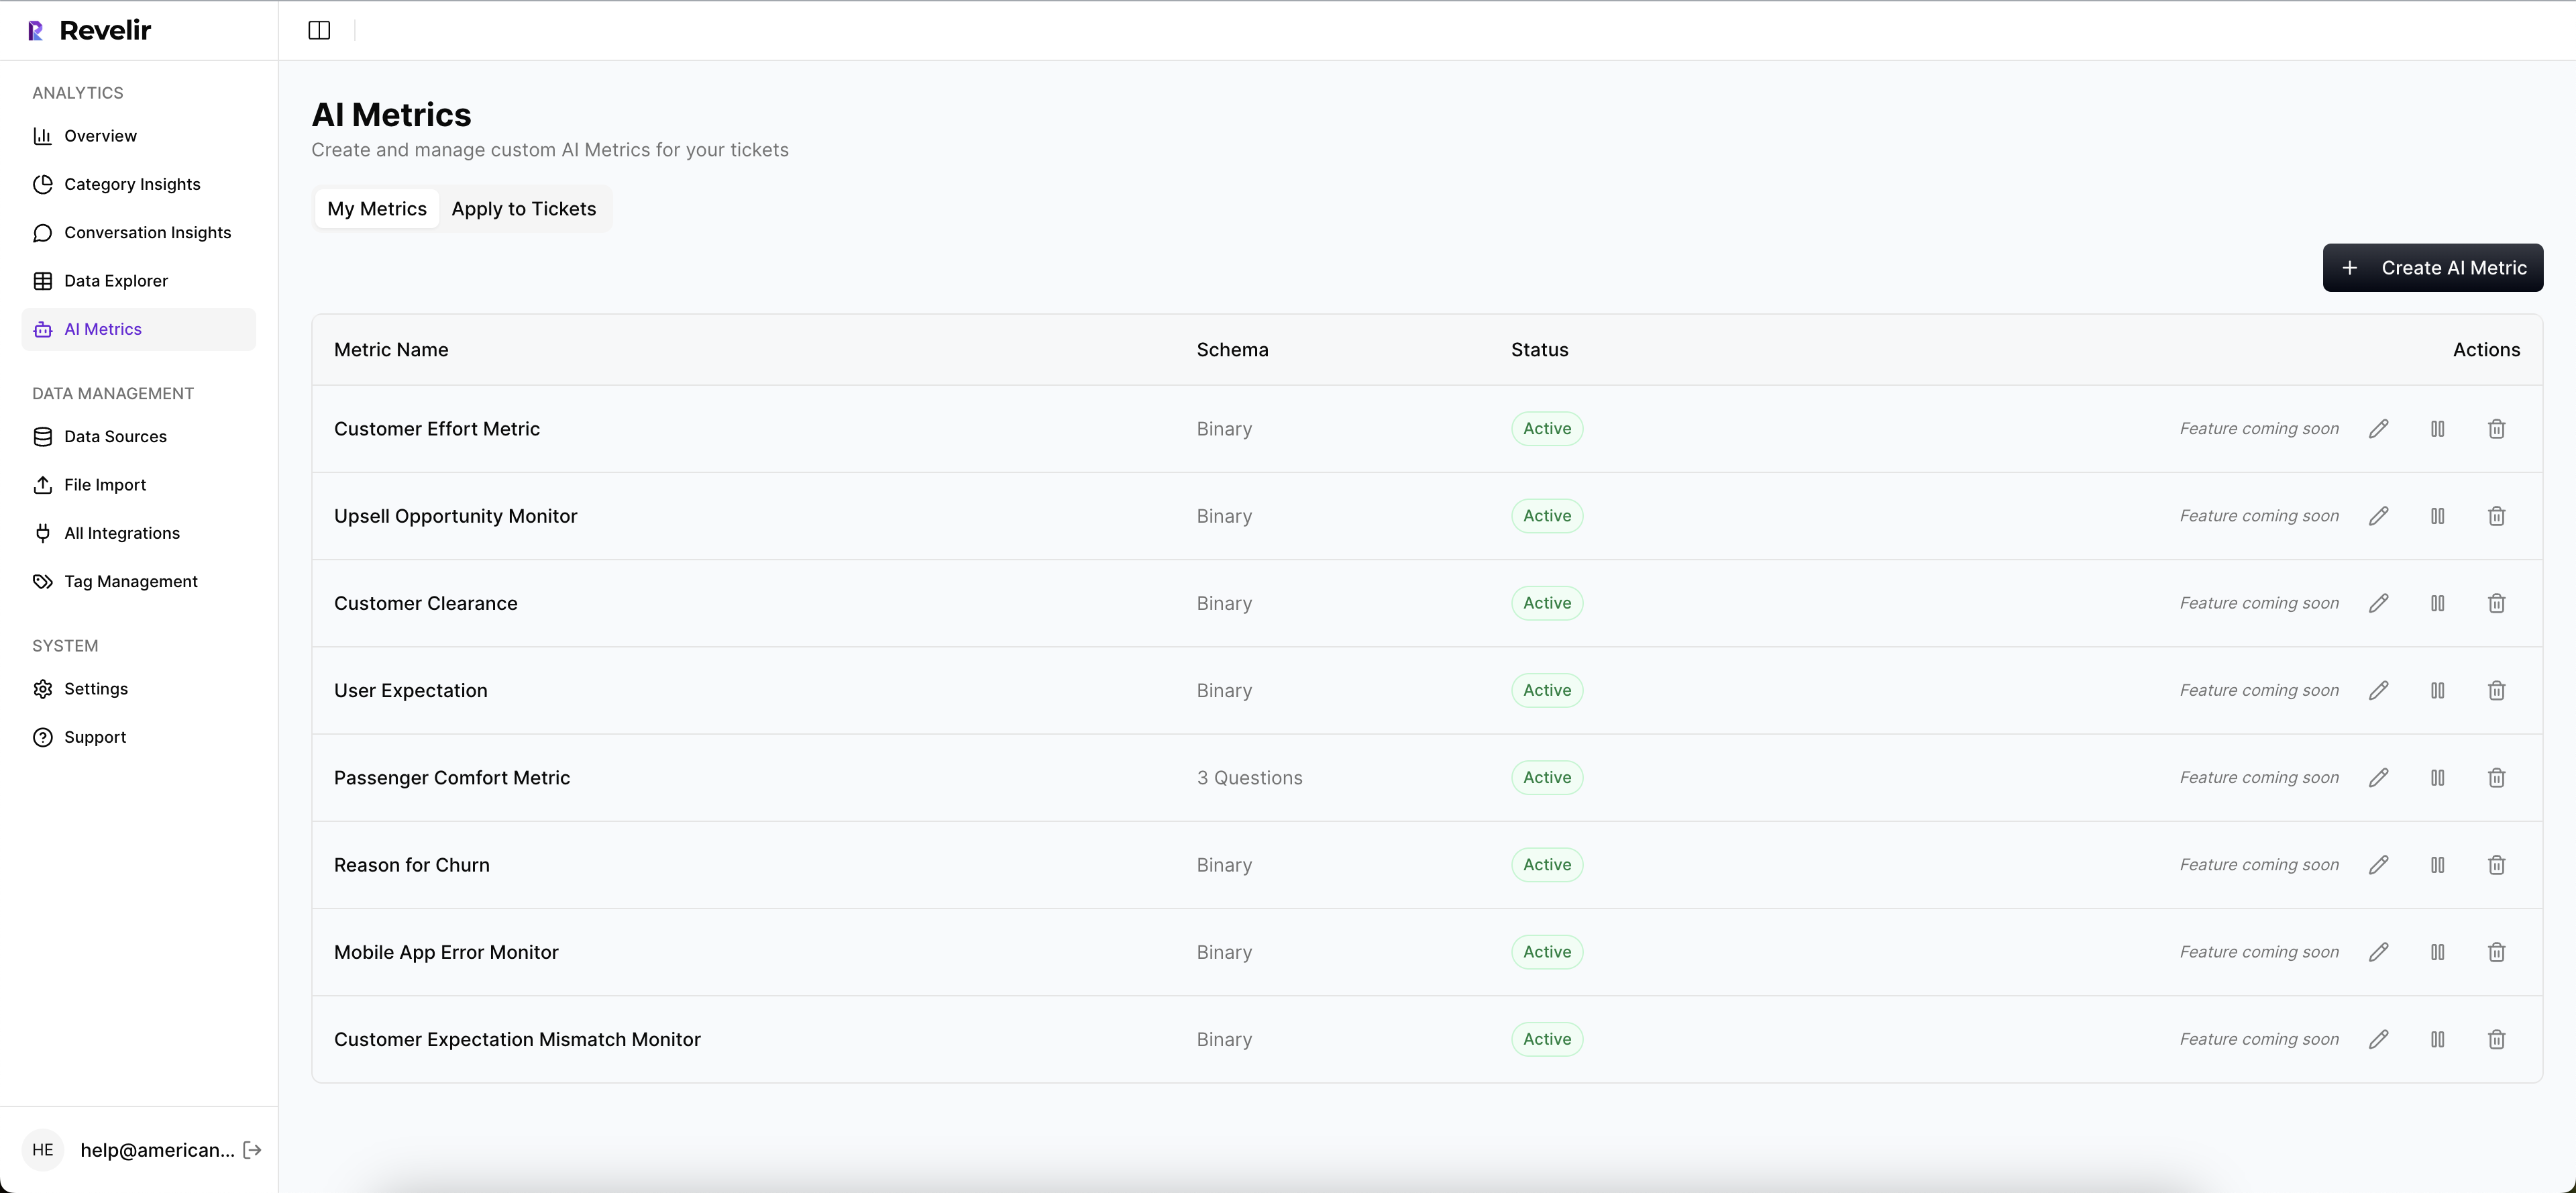
Revelir’s AI Metrics Engine structures signals like Sentiment, Churn Risk, Customer Effort, and Conversation Outcome into fields teams can filter and analyze. Custom AI Metrics let teams measure business-specific questions instead of living inside canned categories. And Evidence-Backed Traceability links aggregate numbers back to original conversations and quotes, which is exactly what teams need to validate AI outputs in support when the questions get sharper.
In practice, teams use Data Explorer to filter, group, sort, and inspect ticket-level data across sentiment, effort, churn risk, tags, drivers, and custom metrics. Analyze Data helps summarize grouped patterns by Driver, Canonical Tag, or Raw Tag. Conversation Insights lets people drill into transcripts, summaries, tags, drivers, and metrics to confirm what the chart is actually saying. If you want to see the workflow in action, you can See how Revelir AI works.
Revelir doesn’t remove the need for judgment. That would be a bad promise anyway. What it does is make judgment faster because the evidence is attached when you need it, not after trust is already gone.
Build an Evidence Layer Before You Buy Another Dashboard
Support teams don’t have an insight shortage. They have a proof shortage. If you want to validate AI outputs in support, start with coverage, structure, and traceability. Not sampling first. Not black-box summaries first. Proof first.
You don’t need a new helpdesk to get there. You need an evidence layer that turns messy conversations into metrics you can defend, then takes you straight back to the tickets when someone asks why. That’s the new bar. Anything less will keep dying in the meeting.
Frequently Asked Questions
How do I ensure complete coverage of support tickets?
To ensure complete coverage of support tickets, you can use Revelir AI's full-coverage processing feature. This processes 100% of ingested tickets without the need for manual tagging, eliminating blind spots from sampling. Start by integrating your helpdesk, like Zendesk, with Revelir, or upload CSV files of your tickets. Once set up, Revelir will analyze all conversations, allowing you to focus on actionable insights rather than debating representativeness.
What if I need to customize metrics for my team?
If you need to customize metrics for your team, you can use Revelir's Custom AI Metrics feature. This allows you to define domain-specific classifiers that reflect your business needs, such as 'Reason for Churn' or 'Upsell Opportunity.' You can create custom questions and value options, and the results will be stored as columns in your data, making them easily accessible for analysis.
Can I trace metrics back to specific conversations?
Yes, you can trace metrics back to specific conversations using Revelir's Evidence-Backed Traceability feature. This links every aggregate number directly to the source conversations and quotes, allowing you to validate AI outputs in support. When you analyze data, ensure you utilize this feature to provide transparent, audit-ready insights that build trust with stakeholders.
When should I use hybrid tagging for my analysis?
You should use hybrid tagging when you want to balance the nuances of manual tagging with the scalability of AI-generated tags. Revelir's Hybrid Tagging System combines Raw Tags, which surface emerging themes, with Canonical Tags that align with your business language. This approach allows you to refine your taxonomy over time while ensuring that your reporting remains clear and relevant for leadership discussions.
Why does my team struggle with validating AI outputs?
Your team may struggle with validating AI outputs due to a lack of traceability and structured metrics. To improve this, implement Revelir's full-coverage processing to analyze all support tickets, ensuring you have the necessary data. Additionally, utilize the Data Explorer to filter and drill down into ticket-level data, allowing your team to quickly access the underlying conversations that support your findings.