

How to Use Customer Feedback to Drive Product Improvements (Without Guesswork)
Customer feedback only drives product improvements when it becomes evidence you can trust, not anecdotes. The question everyone asks is simple: how to use customer feedback to drive product improvements. The mechanics are not. You need full coverage, traceability back to exact tickets, and metrics that explain why issues happen so you prioritize the right fix.
It is usually not a shortage of data. It is a shortage of evidence with context. Scores say something moved. They do not tell you why it moved, who it affected, or what to fix first. Same thing with small samples that feel representative. They are not. You end up debating stories instead of shipping improvements.
Key Takeaways:
- Treat support conversations as your highest-signal source, then turn them into traceable, decision-ready metrics.
- Stop sampling. Measure 100% of tickets so you do not miss hidden patterns or edge cases that cost you churn.
- Replace score-watching with drivers, tags, and custom metrics that explain why issues happen.
- Tie every chart to exact tickets and quotes so product and exec reviews move faster.
- Prioritize by impact across segments, not volume alone, to avoid building the wrong fix.
- Close the loop with evidence, decision, and outcome tracking so your team learns each cycle.
Why Sampling Customer Feedback Fails Product Improvements
Sampling customer feedback fails product improvements because it creates a false sense of certainty. You feel informed, but you are actually blind to patterns that do not show up in the slice you read. When decisions start from partial views, you risk building the wrong fix for the wrong users.
Anecdotes Win When Data Is Thin
Leaders want proof. When you only have a handful of tickets, anecdotes set the tone and the room follows the loudest story. It feels decisive, but it is risky. Most teams conflate speed with confidence here, and that mistake lingers in the roadmap for months. I have sat in those meetings. You probably have too.

Real coverage changes the dynamic. With complete data, you can ask better questions and answer them without guesswork. Which driver is spiking for high ARR customers. Which feature is tied to higher effort for new accounts. Without that view, you default to what you remember, not what is true.
The pattern is predictable. You sample. You miss an edge case that hurts adoption. You fix the wrong thing. Then you spend the next sprint undoing it. Evidence avoids that loop.
Scores Without Drivers Mislead Roadmaps
Scores move. People react. Then nothing changes because nobody knows why the number moved in the first place. A downward trend is a signal, not a plan. Same thing with basic sentiment labels. Useful at a glance, but thin without drivers that explain the cause.
You need to connect each movement to a driver, a tag, and a segment so you can act. Billing confusion among self-serve. Onboarding friction for enterprise SSO. Mobile performance on Android 13. Those are fixes you can assign.
Critics argue that scores are enough to flag risk, and they are not entirely wrong. Scores are a good pulse. They are a bad strategy. Without drivers and traceable quotes, your team will struggle to agree on next steps.
Coverage Beats Volume
More tickets do not equal more clarity. Coverage does. When you measure 100% of conversations, you do not miss quiet but costly problems. Think subtle onboarding missteps that create extra support effort. Those are easy to ignore when you skim.

Full coverage also shrinks debate. If someone asks for examples, you can click into exact tickets and show quotes. No post-hoc fishing, no cherry-picking. You move from opinion to evidence, and decisions speed up.
If you want a sanity check on why full coverage matters, look at how Nielsen Norman Group talks about triangulation. Confidence grows when multiple signals align. Coverage is what lets you triangulate.
The Root Cause: Data Without Traceable Evidence
The real root cause is not a lack of customer feedback. It is that the data you have is not structured, traceable, or aligned to how your org decides. Without traceability back to exact tickets and quotes, insights stall in meetings and nothing ships.
Manual Tags Break at Scale
Manual tagging works for dozens of tickets, not tens of thousands. People tag inconsistently, use different words for the same issue, and skip tagging when queues spike. You get noise instead of a taxonomy you can report on.
Once tags drift, reports lose credibility. People start exporting to spreadsheets to “clean it up.” Weeks disappear. I have watched teams rebuild the same dashboard three times because the inputs were broken. Nobody is checking the source, so nobody trusts the output.
An adaptive taxonomy, where granular signals roll up into human-friendly categories, avoids that drift. You get both discoverability and clarity, which is the only way to scale without chaos.
Black-Box Scores Stall Decisions
A black-box label that says negative sentiment or high risk might be right. It might also be wrong for your domain. Without clear definitions and a path back to the source text, your team will question the result. Then the meeting turns into model talk instead of product talk.
Executives are not allergic to AI. They are allergic to AI they cannot audit. When you can click from a chart to exact tickets and quotes, the conversation shifts. People stop arguing model quality and start assigning owners for fixes.
If you want industry framing, the Gartner Voice of the Customer guidance points to the same need: link signals to business context and make them actionable.
Evidence Wins Cross-Functional Debates
Roadmap meetings have one currency: evidence that stands up to scrutiny. When a chart links to specific tickets, and those tickets match the driver you reported, you avoid the usual stalemate. Product agrees. CX agrees. Engineering agrees.
You also move faster after the meeting. No follow-up fishing for examples. No “send me five tickets where this happens.” It is already there. That is what traceability buys you, speed without the risk of being wrong.
It sounds simple. It is not. But once you feel the difference, you do not go back.
How to Use Customer Feedback to Drive Product Improvements, Quantified
How to use customer feedback to drive product improvements starts with measuring the cost of your current process. Manual sampling, inconsistent tags, and score-only dashboards waste time and miss risk. When you quantify that waste and the misses, you unlock a clear case for changing how you work.
Where You Lose Time Today
Start with coordination time. Leaders skim tickets to find examples, then ask teams to validate patterns. Analysts rebuild spreadsheets. PMs chase context. It looks like forward motion. It is actually delay.
Then look at rework. When you fix the wrong thing, you pay twice. First on delivery, then on rollback. Most teams underestimate this. I did too, until we traced decisions back to the evidence that shaped them.
Finally, factor in credibility cost. When a report cannot link to source, the next meeting reopens the debate. That loop is expensive in hours and momentum.
A simple way to model waste:
- Count hours spent sampling and manual tagging per week.
- Estimate rework time from misprioritized fixes per quarter.
- Add escalation time caused by issues you missed.
- Multiply by fully loaded hourly rates across roles.
- Compare that to the cost of changing the workflow.
What It Costs in Real Terms
Let’s pretend you handle 4,000 tickets a month. Even a 10% sample at three minutes each is 200 tickets, 10 hours, for a partial view. Add two hours validating, two more compiling slides, and an hour of rework from a misread pattern. You are at 15 hours before you fix anything.
Now layer churn risk. If a hidden driver affects high-value accounts, the cost of missing it dwarfs the hours above. Most orgs only find these patterns after a bad week. By then you are reacting, not steering.
Want a different lens, Intercom’s feedback loop guidance highlights the same failure mode. Weak loops mean slow learning, which compounds cost over time.
Signals You Miss Without Coverage
You miss early warnings. Small spikes in effort among new users during onboarding. Subtle confusion about pricing that legal will care about later. A permission bug that only appears for a narrow role.
You also miss who is affected. Without segment-level clarity, you optimize for volume, not value. That is a fast path to wasted sprints. High ARR or high potential cohorts deserve a different response than broad, low-value volume.
Finally, you miss change over time. When drivers shift, you want to catch that inside a week, not a quarter. Coverage makes that visible so you can pivot fast.
When Feedback Chaos Hits Your Week
Feedback chaos feels like noise because your process cannot separate signal from story. You are stuck in Slack threads, pulling examples, and defending slides you do not trust enough to push hard on. It is exhausting and it slows everything else down.
Late-Night Triage
It is 10 pm and you are still collecting tickets to prove a point for tomorrow’s review. You know the pattern is real. You cannot show it in a way that survives debate. So you over-prepare. You hope volume carries the argument.
I have been there. You probably have too. The problem is not effort. The problem is evidence. Without a clean path from chart to quote, every strong claim feels like risk. You hedge. Then nothing changes.
Once the team sees a report they can click into, triage becomes calm. People trust what they can inspect.
Leadership Reviews Without Proof
Exec reviews demand clarity. What broke. Who it hit. What to fix first. You might have slides that answer the first question. The second and third get messy fast without traceable metrics.
So the meeting drifts. Someone cites a story from a big account. Someone else pushes back. You leave with three follow-ups and a weaker plan. Morale takes a hit because the team worked hard and still does not have a green light.
The fix is not more slides. It is traceability. When you can zoom from a stacked bar to five exact quotes, decisions snap into place.
Engineers Lose Trust
Engineers want specific, reproducible problems. If they get vague requests tied to a score drop, trust erodes. Tickets bounce. The cycle time stretches. Then everyone feels the pressure and shortcuts sneak in.
Give engineering clean drivers, scoped tags, and examples from affected segments, and the energy changes. They can size it. They can fix it. They can test it. You ship with less back-and-forth and fewer surprises.
That is the hidden win. Better evidence builds trust across teams.
How to Use Customer Feedback to Drive Product Improvements, The Playbook
Use a simple playbook: define the decisions first, then shape your metrics, and finally close the loop. When each step links back to real conversations, you improve faster with fewer wrong turns.

Define Decisions Before Data
Start by naming the decisions you need to make. Which drivers should we attack this quarter. Which features create the highest effort for new users. Which bugs risk churn in high ARR accounts. Clarity here prevents vanity dashboards later.
Then match decisions to the segments that matter. New vs. existing. SMB vs. enterprise. Mobile vs. web. Your roadmap should reflect who is actually feeling the pain. Without this, you will optimize for the average and miss what moves revenue.
Finally, set the minimal set of metrics you need to answer those decisions. Drivers, canonical tags, sentiment, effort, churn risk, and two or three custom metrics in your language. No more. No less.
To turn this into a repeatable loop:
- List the top three product decisions for the next 6 weeks.
- Define the segments those decisions depend on.
- Map each decision to one or two metrics that explain why.
- Agree on what “enough evidence” looks like for sign-off.
- Commit to reviewing the same view weekly, not ad hoc.
Turn Conversations Into Structured Metrics
Raw feedback is not the enemy. It is the starting point. You need a system that converts transcripts into granular tags, then rolls those into clear categories people understand. You also need AI metrics that match your domain, not a generic model trained on someone else’s data.
Then you need traceability. Every chart should link to exact tickets and quotes so people can validate fast. That is how you avoid the “are we sure” spiral that kills momentum. Honestly, I never expected traceability to speed teams up as much as it does. It does.
If you already use Zendesk or export CSVs, you do not need to rip anything out. Add an intelligence layer on top so you can measure 100% of conversations without changing your helpdesk.
Stop debating stories. Start fixing what the evidence shows. Learn More
Close the Loop With Product
Evidence does not help if it dies in a deck. Build a habit where CX, Product, and Engineering look at the same view, make a call, and track outcomes. Sounds basic. It is rare.
Keep a running log that connects each insight to a change, then to a result. Did churn risk drop for that segment. Did effort improve for that driver. If not, you learned something useful. Adjust. If yes, double down.
You will miss sometimes. That is fine. The point is to learn faster with less waste. A tight loop makes misses cheaper and wins easier to repeat.
How Revelir Turns Support Conversations Into Product Improvements
Revelir turns support conversations into structured, evidence-backed metrics that teams can trust and act on. It processes 100% of tickets, applies AI and custom metrics, and links every chart to the underlying conversations. That combination removes debate and accelerates product decisions.

Analyze Data for Driver-Level Clarity
Revelir’s Analyze Data groups key signals like Sentiment, Churn Risk, Effort, and your custom metrics by drivers and tags. You see which issues spike for which segments, then click through to the tickets behind the numbers. That path from stack to source is what builds trust in cross-functional reviews.
Grouped analysis is fast and flexible. Filter to enterprise accounts, then compare Billing vs. Onboarding drivers by week. Or isolate Android users and watch performance complaints over a release cycle. When a pattern looks off, you do not guess. You validate on the spot.
I like how it keeps analysis and validation in one flow. You are never stuck exporting to prove a point.
Data Explorer for Fast, Trustworthy Slicing
The Data Explorer works like a pivot table for tickets. You can filter, group, sort, add or remove columns, then drill into any row to read the transcript with AI-generated summaries and assigned tags. That lets you move from high-level patterns to exact quotes in seconds.
Columns include sentiment, churn risk, effort, raw and canonical tags, drivers, and any custom AI metrics you define. You can also scroll across fields, manage columns, and save views that match how your team decides. It is simple in practice and powerful in review meetings.
Once people see their questions answered in one place, the back-and-forth slows down. You stop wasting hours recreating the same report in spreadsheets.
Custom AI Metrics in Your Language
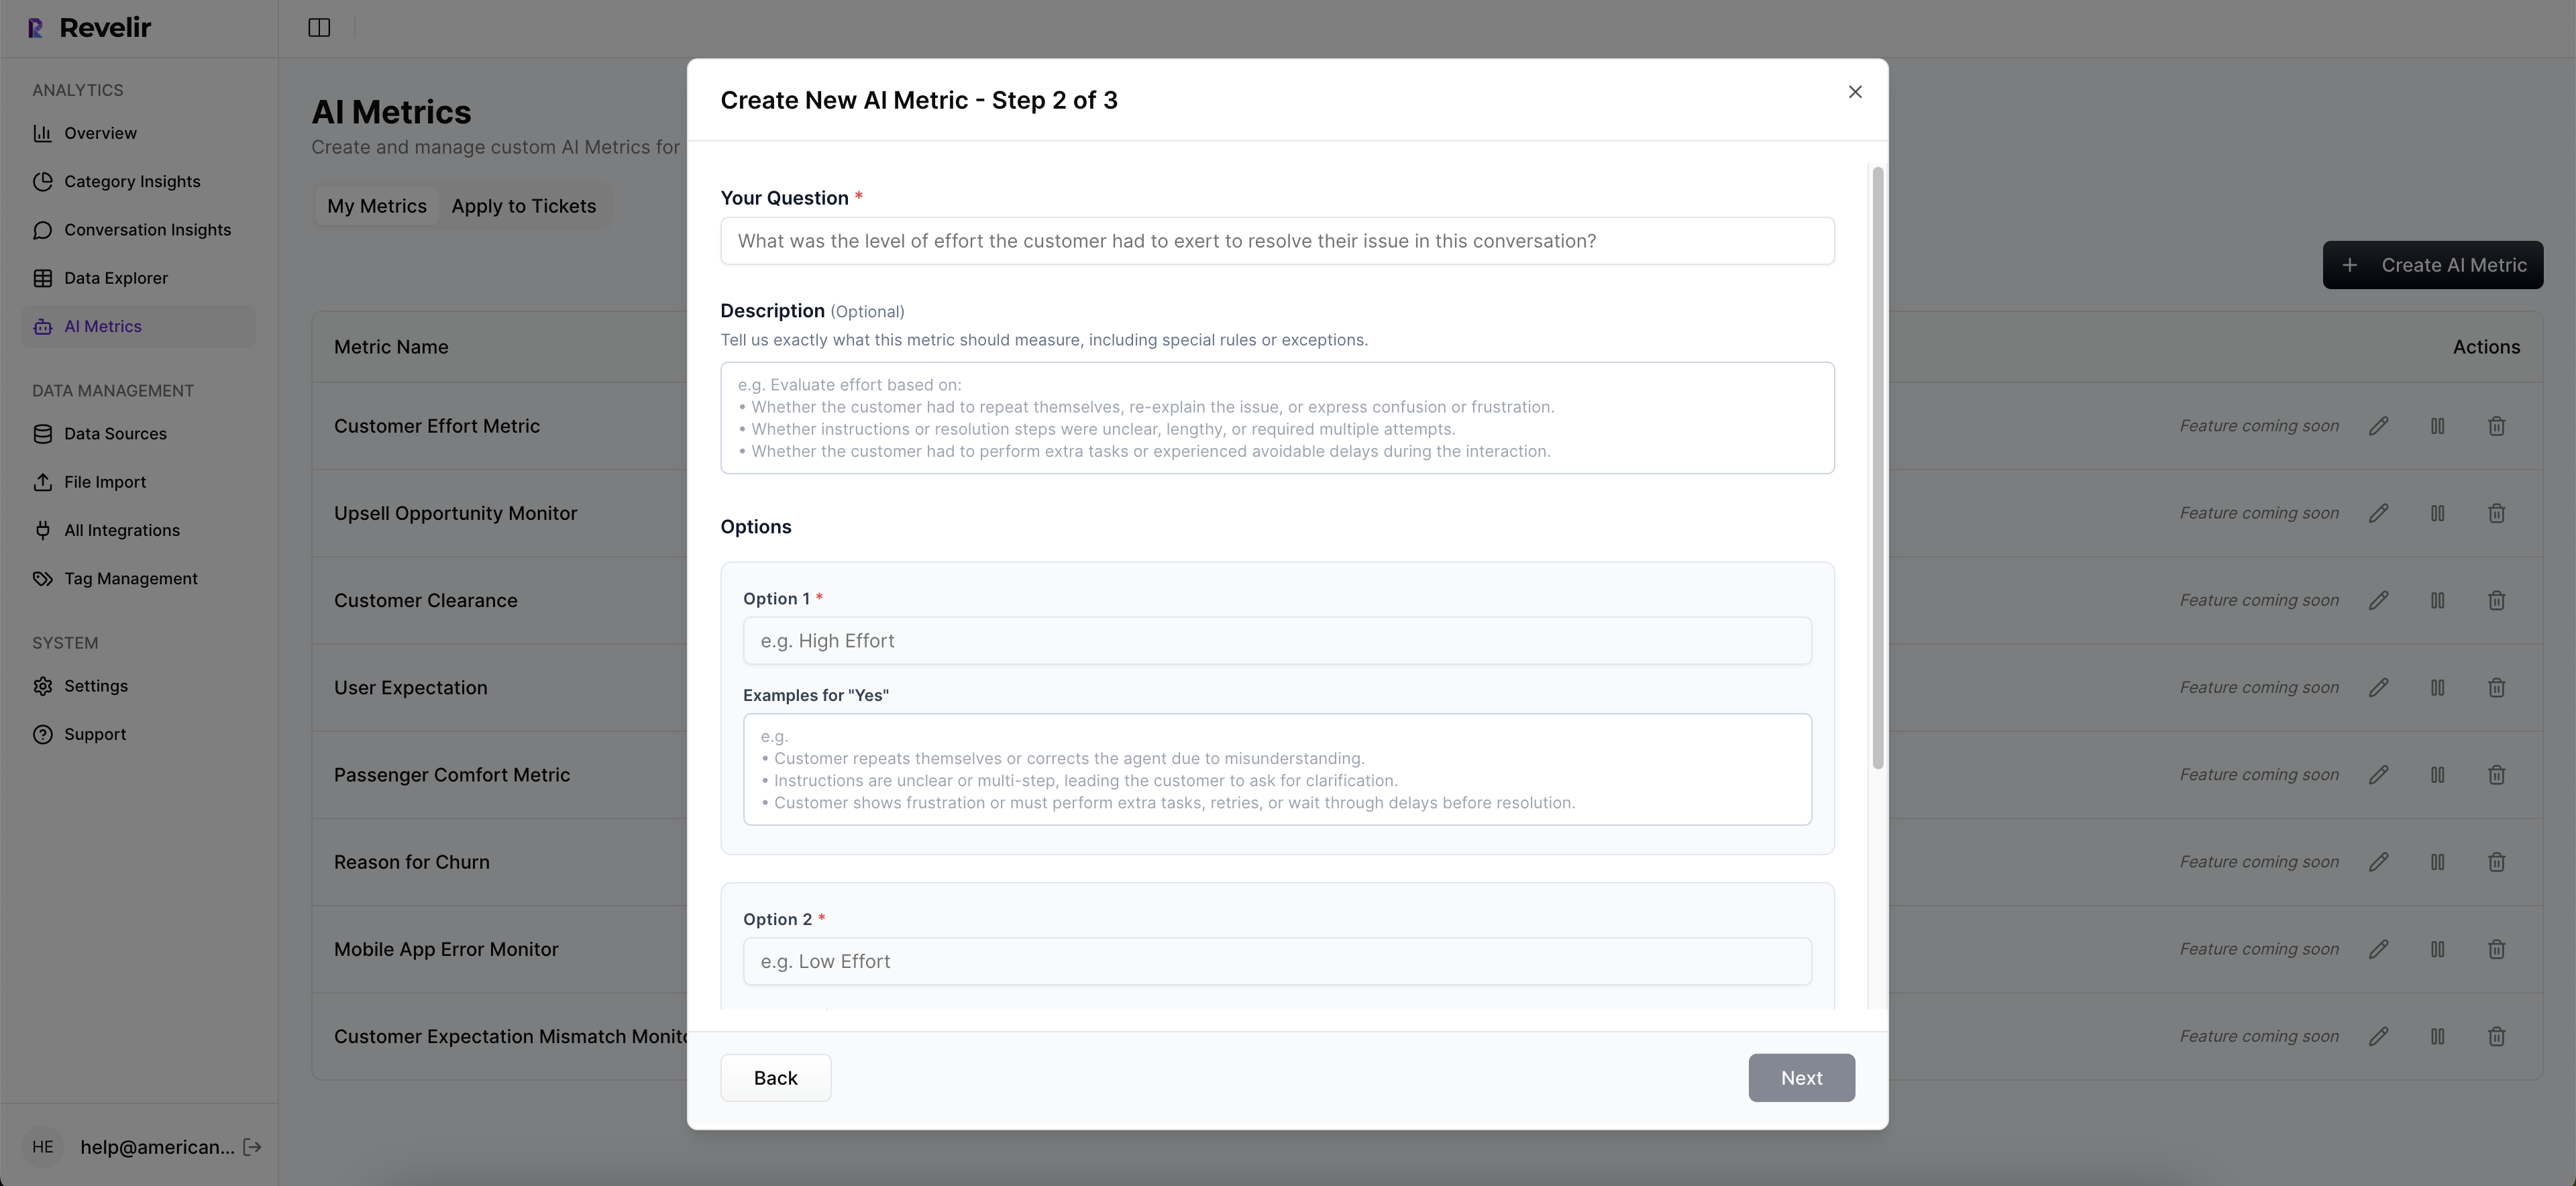
Out-of-the-box metrics are helpful, but they rarely match your domain. Revelir lets you define Custom AI Metrics with your own questions and values, like Upsell Opportunity, Reason for Churn, or Compliance Risk. Results become columns you can filter, group, and analyze with everything else.
That means you can quantify the signals leadership actually cares about instead of translating from generic outputs. When a VP asks why activation dipped, you can point to Driver, Effort, and a custom First-Week Blocker metric, then open five tickets that show it.
It sounds small. It is not. Language alignment removes friction in every discussion.
Evidence You Can Defend in the Room
Revelir links every aggregate number to the source conversations and quotes. You can open any chart, click through to Conversation Insights, and validate the story in minutes. That traceability is the difference between “I think” and “I know.”
When paired with Full-Coverage Processing, you also avoid sampling bias. The view reflects reality, not a subset. That reduces risk when you choose between fixes. And if you use Zendesk or CSVs today, you can plug in without changing your helpdesk flow.
Core capabilities that enable the shift:
- Analyze Data summarizes key metrics by drivers and tags for fast comparisons across segments.
- Data Explorer filters, groups, and drills down to exact tickets with AI-generated summaries.
- Hybrid Tagging combines granular AI Raw Tags with human-friendly Canonical Tags for reporting.
- AI Metrics Engine computes sentiment, churn risk, effort, and outcomes as structured fields.
- Evidence-Backed Traceability links charts to exact tickets and quotes for audit-ready insight.
Teams using Revelir move from score-watching to driver-level action. The hours spent sampling and debating shrink, while the fixes they ship hit the real problems for the right users. Ready to see it in action. See how Revelir AI works
If you want this workflow without ripping tools, you have it. Connect Zendesk or upload a CSV, define a few custom metrics, and start answering the questions that move your roadmap. Get started with Revelir AI (Webflow)
Conclusion
Customer feedback drives product improvements when it becomes evidence you can defend, not anecdotes you debate. Full coverage, traceability to tickets and quotes, and metrics in your language turn support conversations into clear priorities. Do that, and your roadmap stops drifting. It compasses toward the problems that matter, and you ship the fixes that stick.
Frequently Asked Questions
How do I ensure I’m analyzing all customer support tickets?
To analyze all customer support tickets effectively, use Revelir's Full-Coverage Processing feature. This capability processes 100% of ingested tickets without requiring manual tagging upfront. By doing this, you eliminate blind spots and ensure that no critical feedback is missed. Simply connect Revelir to your helpdesk, like Zendesk, and it will automatically ingest all conversations, allowing you to focus on actionable insights rather than sampling. This way, you can trust that your analysis reflects the complete picture of customer feedback.
Can I create custom metrics for specific business needs?
Yes, you can create custom metrics using Revelir's Custom AI Metrics feature. This allows you to define metrics that align with your specific business objectives, such as tracking Upsell Opportunities or Reasons for Churn. Once you've set these up, you can filter and analyze them alongside other standard metrics in the Data Explorer. This flexibility helps you focus on the signals that matter most to your team and supports informed decision-making.
What if I need to drill down into specific customer conversations?
If you need to drill down into specific customer conversations, use the Conversation Insights feature in Revelir. This allows you to click through from aggregated metrics to view full transcripts of individual tickets. You can see AI-generated summaries, assigned tags, and relevant metrics for each conversation. This level of detail helps you validate patterns and gather quotes for reporting, making it easier to support your findings during cross-functional discussions.
How do I link customer feedback to product improvements?
To link customer feedback to product improvements, start by using Revelir's Evidence-Backed Traceability feature. This feature connects every aggregate number to the source conversations and quotes, allowing you to present clear evidence during meetings. When you analyze data, ensure you tie insights back to specific tickets and drivers, which helps prioritize fixes based on actual customer needs. By doing this, you can effectively communicate what needs to be addressed and why, leading to more informed product decisions.