

42% of support leaders say proving ROI is their biggest CX challenge, according to Deloitte, and a lot of that comes down to one ugly fact: teams have the ticket volume, but they still can't structure support ticket data well enough to explain what broke. If you tried to answer that question this week with a CSV export, a few Zendesk tags, and a spreadsheet nobody fully trusts, you felt the problem already.
Support teams usually think the hard part is getting more data. It isn't. The hard part is turning messy conversation text into something you can defend in a leadership meeting without ripping out Zendesk or forcing agents into a whole new workflow.
Key Takeaways:
- Structuring support ticket data is really about making free-text conversations measurable, searchable, and traceable.
- Manual tagging and sample-based review break fast once volume gets past a few hundred tickets a month.
- If you can't trace a metric back to the original ticket, executives won't trust it for real decisions.
- The best systems separate granular discovery from clean reporting, which is why raw tags and canonical tags should not be the same thing.
- A useful support data structure needs three layers: signal, grouping, and evidence.
- You don't need a new helpdesk to do this well. You need an intelligence layer on top of the tools you already use.
- Transparent AI beats black-box AI because trust matters more than a pretty chart.
Why most support ticket data stays unusable
Support ticket data stays unusable because most teams never actually structure the conversation itself. They structure the metadata around it. Status, priority, queue, maybe a few tags. That gives you reporting on workflow, not reporting on customer reality. So when the CEO asks why churn risk is rising or what broke after the last release, the dashboard gets quiet fast.

At 8:14 AM on a Monday, a CX lead opens Zendesk, exports last month's 18,000 tickets, and drops 200 of them into a spreadsheet for two managers to review. One manager marks billing as the main issue. The other says onboarding friction. Product jumps in on Slack and says the loudest complaints are edge cases anyway. By noon, nobody has an answer, but everyone has an opinion, which is usually worse.
The old way has merits. Manual review does catch nuance. Fair enough. If you're looking at 30 tickets a week, a smart team can do that well. But once you cross roughly 500 tickets a month, sample review starts to fail in three ways: it introduces bias, it hides low-frequency but high-cost issues, and it turns every meeting into an argument about whether the sample was representative. That's the Ticket Structure Gap. You have conversations full of signal, but no repeatable way to convert them into structured support data.
It wears people down too. You spend hours reading threads, pull five examples into a deck, and still walk into the meeting half-expecting someone to say, "yeah, but is that really a pattern?" So what kind of structure actually holds up under pressure?
The real problem is not volume, it's missing structure
The real problem isn't ticket volume. It's that your support data has no operating model. That's why teams fail to structure support ticket data in a way that survives contact with CX, product, finance, and ops.
The metadata trap hides the actual issue
Most teams start with fields that are easy to count. That's normal. Ticket status, handle time, backlog, reopen rate. Useful, yes. Sufficient, no. Those fields answer how the queue moved, not why customers got stuck.

A support organization can have pristine operational reporting and still be blind to what customers are really saying. I've seen teams with immaculate SLA dashboards who couldn't tell you whether negative conversations were driven by billing confusion or account access failures. That's not a data shortage. It's a structure problem.
A simple rule works here: if a field can be filled without reading the conversation, it probably won't explain customer pain. Put differently, if an agent can complete the field in two seconds before opening the thread, that field belongs to workflow analytics, not customer reality analytics. That's why teams that want to structure support ticket data need to build from the text itself, not just the wrapper around it. Deloitte's research keeps landing on the same point: contact centers are under pressure to prove value beyond efficiency metrics.
Sampling creates false certainty
If you review only 10% of tickets, you're not studying the customer base. You're studying the luck of the draw.

If you handle 1,000 tickets a month and review 100, you're basing product and CX decisions on 100 conversations and ignoring 900. Say that out loud in a roadmap meeting and it sounds reckless. Yet that's still how a lot of teams try to structure support ticket data for reporting.
The Coverage Threshold is straightforward. If monthly volume is above 300 tickets and those reviews influence product, retention, or onboarding decisions, partial review is too risky. At that point, low-frequency issues can still be high-impact, especially when they hit high-value accounts, new cohorts, or customers already showing effort and churn signals. McKinsey has made a similar case: experience data matters most when it connects directly to outcomes, not when it gets flattened into summary scores.
Black-box analysis breaks trust at the worst moment
What happens when the chart looks smart but nobody can explain where it came from?
You can structure support ticket data badly with AI too. That's the part a lot of vendors skip. If the model spits out "negative sentiment increased in onboarding" but nobody can trace it back to source conversations, trust collapses right when scrutiny goes up.
Product reviews are where this shows up. Someone asks which conversations drove the spike. If you can't drill into real tickets and quotes, the room defaults to politics. The PM trusts their gut. The support lead trusts anecdotes. The analyst, who should be driving action, gets dragged into defending methodology instead.
Not every use case needs courtroom-grade evidence. Fair. If you're doing lightweight triage on a tiny queue, directional insight may be enough. But if the output is shaping roadmap, staffing, or retention bets, the Evidence Rule applies: no source trail, no strategic decision. And that raises the next question—what does a decision-ready structure actually look like?
How to structure support ticket data so it becomes decision-ready
Structuring support ticket data means converting free text into a layered system that lets you detect patterns, group them cleanly, and validate every conclusion. That's the difference between a pile of tickets and a usable decision engine. The model I prefer is the SGE Stack: Signal, Grouping, Evidence.
Start with a diagnostic pass before you build anything
Before you redesign fields or buy tooling, diagnose the maturity level you actually have, not the one your dashboard design implies.
Most teams sit in one of four stages. Stage 1 is Operational Only: status, queue, SLA, CSAT. Stage 2 is Inconsistent Labeling: manual tags exist, but different agents and managers use them differently. Stage 3 is Surface Intelligence: AI summaries or sentiment exist, but without drill-down evidence. Stage 4 is Decision-Ready: structured, traceable, and explorable support ticket data.
Ask four questions. Can you explain why sentiment changed last month without reading a fresh sample? Can two different managers tag the same issue the same way? Can you isolate one driver by segment in under five minutes? Can you trace a chart back to the exact ticket and quote? If the answer is "no" to two or more, you do not yet structure support ticket data well enough for executive use.
That diagnosis stings a little because polished dashboards can create the illusion of maturity. Like a contact center wallboard that shows every queue in green while the phones light up in another room, visual order can hide analytical disorder. Pretty reporting is not the same as reliable structure.
Separate discovery tags from reporting tags
A B2B SaaS team with 6,000 monthly tickets usually learns this the hard way: one tag system cannot do exploration and executive reporting at the same time.
You need two layers. First, granular descriptors that capture what customers are actually talking about. Second, normalized categories that keep reporting stable over time. Before, every new issue forced a taxonomy debate. After, new raw signals can appear without breaking leadership reporting.
That's why the raw-tag to canonical-tag model matters. A raw label like billing_fee_confusion or refund_request catches language and nuance in the ticket. A canonical label rolls that up into something stable, like Billing or Refunds. If you're trying to structure support ticket data with only one taxonomy, use the Split Taxonomy Rule: if the tag list changes weekly and your monthly reports still confuse leadership, split discovery from reporting immediately.
Rigid taxonomies do have one advantage. They create consistency early. That's real. But they also suppress new patterns the same way a dropdown menu suppresses what customers actually typed. Discovery has to stay a little messy so reporting can become reliably clean.
Add a driver layer for the why
Why do teams still struggle after they add tags? Because tags describe issues, but drivers explain business meaning.
Drivers are what turn dozens of specific issues into a roadmap conversation. You might have raw tags for password reset loops, login code delays, and SSO setup confusion. Useful. But a driver like Account Access is what lets you say, in one line, that account access issues drove 28% of high-effort tickets this month.
This is the Three-Lens Rule. Every team trying to structure support ticket data should be able to analyze by incident, category, and driver. Incident is fine-grain signal. Category stabilizes reporting. Driver translates the pattern into language finance, product, and CX leaders can prioritize. Miss one layer and the system breaks in a predictable way: without incidents, you miss nuance; without categories, reporting drifts; without drivers, leadership hears noise instead of a decision.
Turn conversational signals into columns you can filter
Contrast the two states. In the first, an ops lead asks, "Which issues create the most effort for enterprise customers?" and an analyst says, "Give me three days." In the second, they click three filters and answer in 30 seconds.
The minimum useful field set is usually sentiment, effort, outcome, and some form of churn or retention risk. For a lot of teams, that's enough to answer the first wave of serious questions. Which issues correlate with negative sentiment? Which drivers cluster around high effort? Which customer segments show the sharpest retention risk? Once those judgments become columns, support ticket data stops behaving like anecdote and starts behaving like an operating dataset.
Then add business-specific fields sparingly. A travel company may need reason for disruption. A SaaS company may need renewal risk driver. A marketplace may need fraud concern. Here's the Filter-or-Forget Rule: if a metric changes prioritization in the next 30 days, make it a column; if it doesn't, leave it out. Over-structuring is real, and every unnecessary field adds review friction.
Keep every metric tied to source evidence
No metric should travel alone.
The final layer is evidence. Every pattern should be traceable back to the conversation that created it. Before, a chart says onboarding sentiment fell. After, the same chart links to the 37 tickets behind the shift, plus the three quotes that make the cause obvious.
This matters for two reasons. First, it makes AI outputs auditable. Second, it gives non-analysts a reason to trust the work. A chart is abstract; a chart plus ticket excerpts is persuasive. The Evidence Chain is the safest rule I know here: every aggregate should link back to specific tickets, and every major recommendation should be backed by at least five representative conversations before it reaches a roadmap or executive review.
That standard is slower than a glossy dashboard screenshot. True. It also survives pushback, which is what actually matters once decisions get expensive. So if this is the structure, how do you make it practical without rebuilding your stack?
How Revelir AI makes structured ticket analysis practical
Revelir AI sits on top of the helpdesk workflow you already have and makes this structure usable without forcing a rip-and-replace. That's the part a lot of teams care about most. They don't want another migration. They want support ticket data they can trust.
Plug into existing ticket data, then structure all of it
You do not need a new helpdesk to structure support ticket data well.
Revelir AI can bring in conversations through the Zendesk Integration or through CSV Ingestion, which matters if you want to pilot first, backfill historical data, or work from exports out of another helpdesk. That low-friction setup matters because tired support orgs do not want another process change disguised as innovation.
Once the tickets are in, Full-Coverage Processing analyzes 100% of ingested conversations. Before, you were reading subsets and debating whether the sample was fair. After, the dataset is the whole dataset. That's not just faster. It changes the argument.
Use hybrid tagging and metrics to turn text into usable fields
Revelir AI uses a Hybrid Tagging System with Raw Tags, Canonical Tags, and Drivers to create the layered structure most teams try to assemble manually.
Raw Tags surface granular themes. Canonical Tags keep reporting consistent. Drivers group those categories into leadership-friendly why buckets. Then the AI Metrics Engine adds structured fields like Sentiment, Churn Risk, Customer Effort, and Conversation Outcome.
If your business needs something more specific, Custom AI Metrics let you define classifications in your own language and use them as columns in analysis. That's the difference between generic software and something built for actual operating questions. Generic sentiment is rarely enough. Usually, one or two business-specific fields are what finally let a team structure support ticket data in a way product and revenue leaders will use.
Explore patterns fast, then validate them with evidence
A chart without drill-down is presentation. A chart with drill-down is analysis.
Data Explorer gives you a pivot-table-like workspace to filter, group, sort, and inspect every ticket with tags, drivers, and metrics side by side. Analyze Data lets you summarize those metrics by Driver, Canonical Tag, or Raw Tag with interactive views that connect back to underlying tickets.
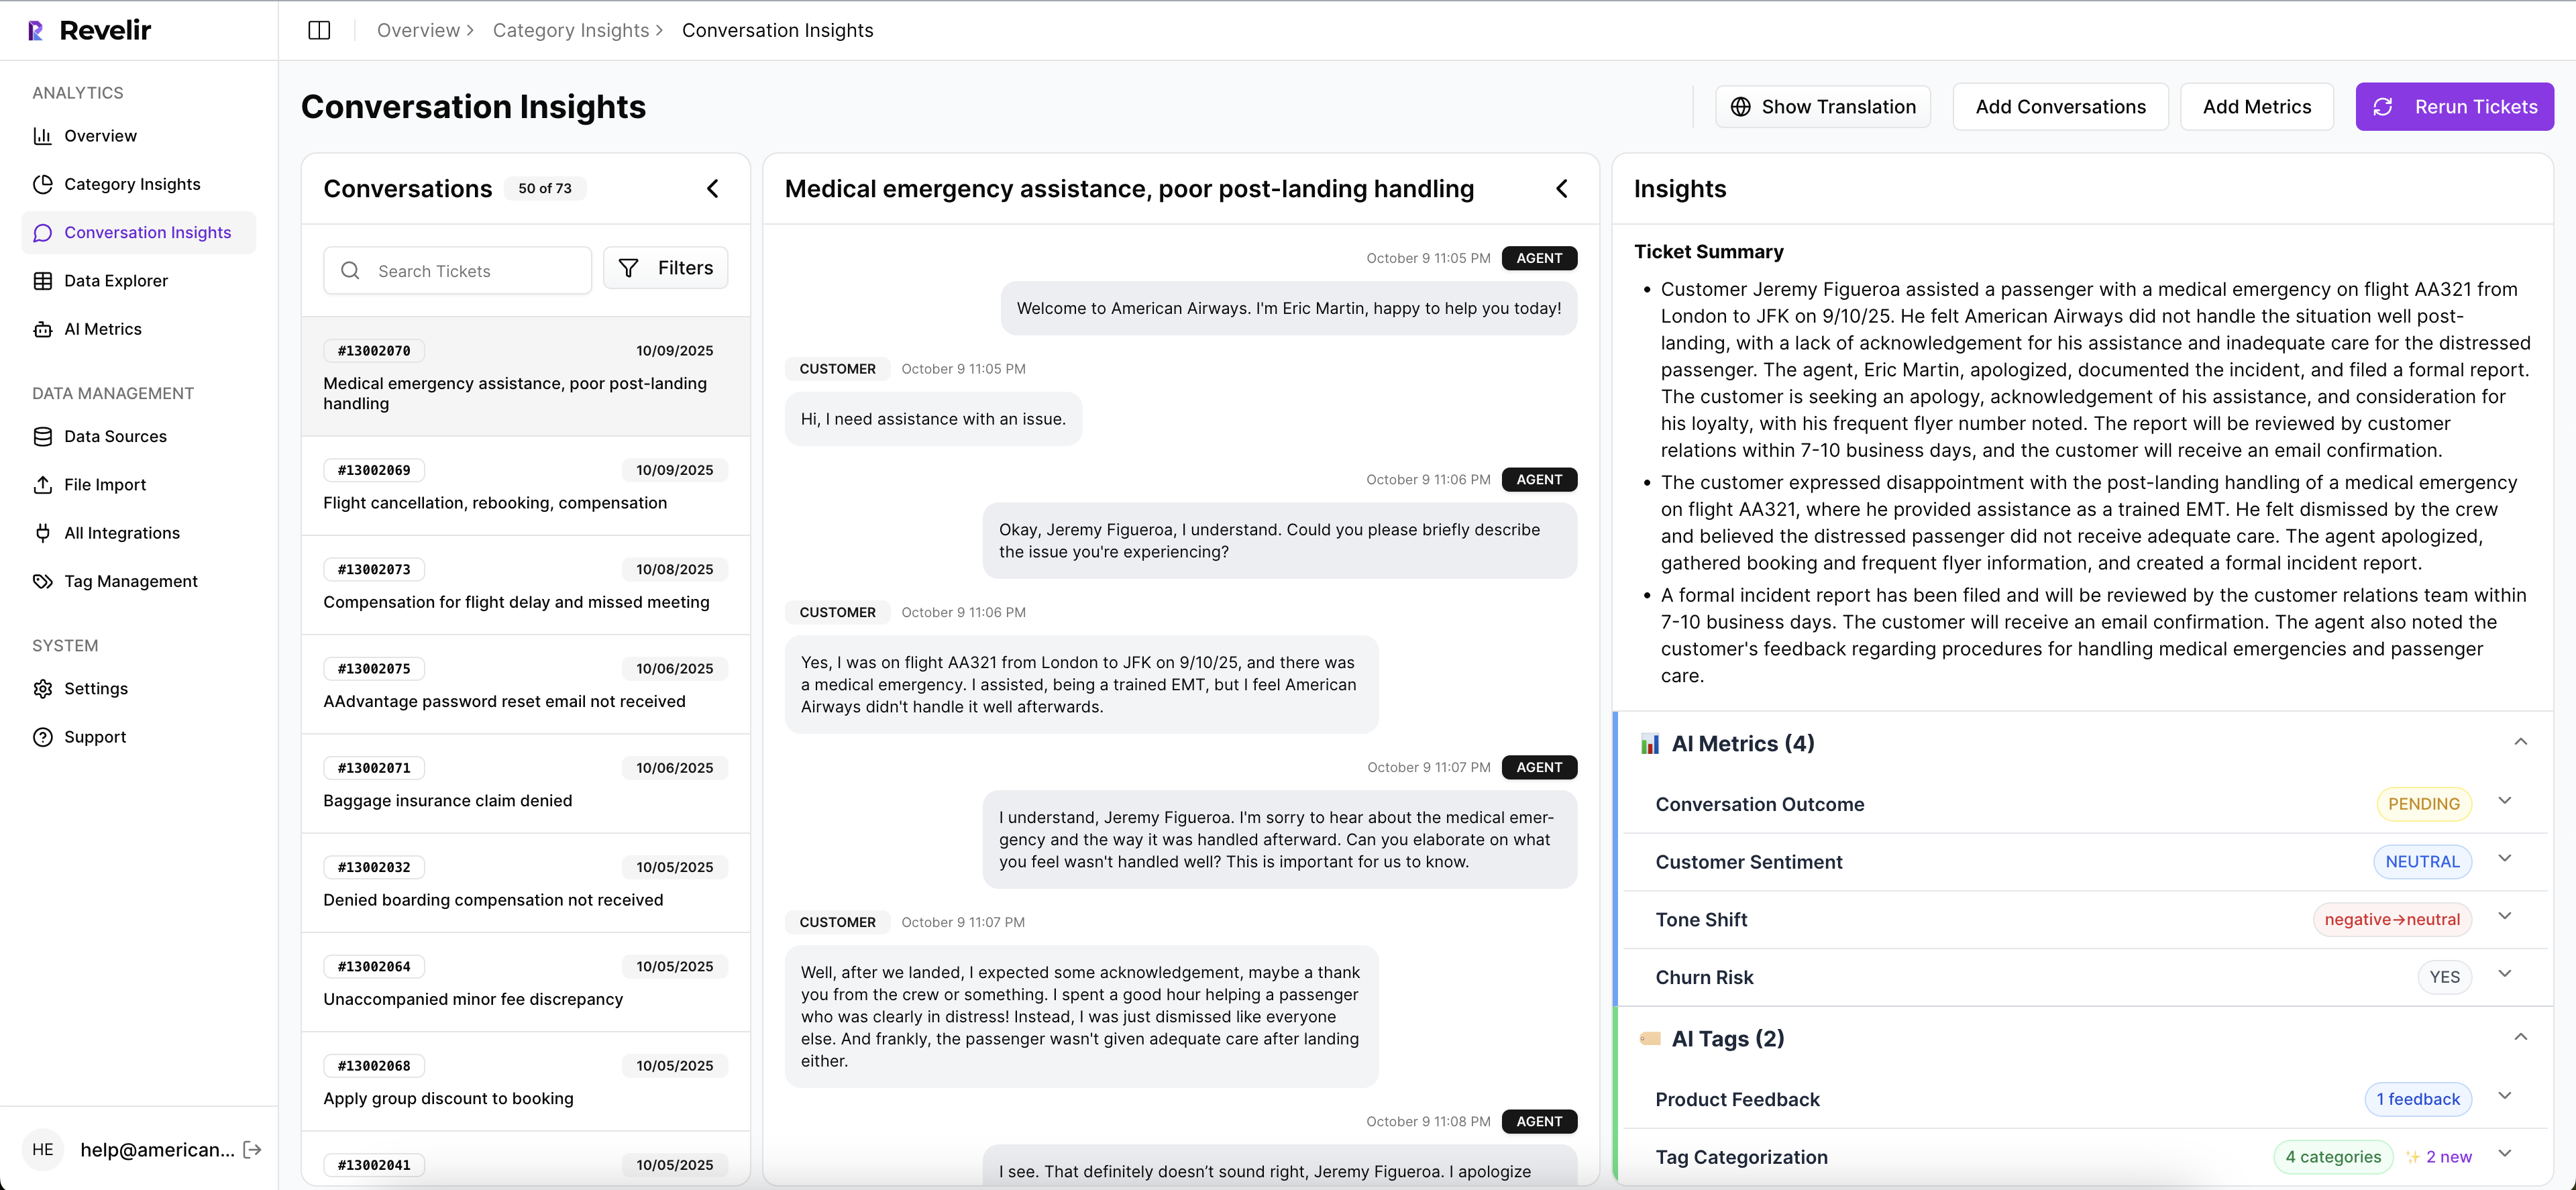
And when someone pushes back, which they will, Evidence-Backed Traceability and Conversation Insights let you drill into the exact conversation, transcript, summary, assigned tags, drivers, and metrics behind the chart. That's how you structure support ticket data without creating a new black box. You get speed, but you also get proof. If you want to see that structure in action, Get started with Revelir AI.
Structure first, then decisions get easier
If you're trying to structure support ticket data, don't start with prettier dashboards. Start with better structure. Signal, grouping, evidence. That's usually the missing piece.
Manual review still has a place. Scores still have a place. But if you need defensible answers about what's breaking, who it affects, and what to fix first, you need a system that can read all the conversations, organize them clearly, and tie every insight back to the source. Structure is what turns support from a cost center story into an evidence engine.
Frequently Asked Questions
How do I integrate Revelir AI with Zendesk?
Integrating Revelir AI with Zendesk is straightforward. First, connect your Zendesk account through the Revelir AI interface. This allows Revelir to pull in historical and ongoing tickets automatically. Once the integration is set up, Revelir will process 100% of your support conversations, providing you with structured insights without the need for manual exports. This setup ensures that all your ticket data is continuously analyzed, helping you make informed decisions based on comprehensive data.
What if I want to analyze historical ticket data?
If you want to analyze historical ticket data, you can use the CSV Ingestion feature in Revelir AI. Simply export your past tickets from Zendesk or another helpdesk as a CSV file. Then, upload this file through the Revelir interface. Revelir will parse the data and apply its full tagging and metrics pipeline, allowing you to explore insights from your historical tickets just like you would with ongoing data.
How do I ensure all tickets are analyzed without bias?
To ensure all tickets are analyzed without bias, use Revelir AI's Full-Coverage Processing feature. This capability processes 100% of ingested tickets, eliminating the blind spots that can occur with sampling. By analyzing every conversation, you can confidently identify patterns and insights without relying on a potentially unrepresentative subset of tickets. This comprehensive approach allows you to make data-driven decisions based on the full picture of customer interactions.
Can I create custom metrics for my specific needs?
Yes, you can create custom metrics in Revelir AI using the Custom AI Metrics feature. This allows you to define domain-specific classifiers that align with your business needs. For example, you might want to track metrics like 'Upsell Opportunity' or 'Reason for Churn.' Once defined, these custom metrics become usable columns in your analyses, enabling you to filter and explore your ticket data in a way that directly supports your operational goals.
When should I use the Data Explorer feature?
You should use the Data Explorer feature in Revelir AI whenever you need to dive deep into your support ticket data. It's particularly useful for quickly filtering, grouping, and sorting tickets based on various metrics like sentiment, churn risk, and effort. If you're trying to answer specific questions about customer issues or trends, Data Explorer provides a pivot-table-like workspace that lets you interactively analyze your data and drill down into the underlying conversations for more context.