

42 tickets can fool you just as easily as 4,200. If you're trying to reduce customer churn through support analysis, sampling is usually the first mistake, not the safety net.
Key Takeaways:
- If you want to reduce customer churn through support analysis, you need 100% conversation coverage, not a sample.
- Scores tell you that something changed. Drivers, tags, and quotes tell you why.
- The fastest way to lose trust in a leadership review is to show a chart you can't trace back to real tickets.
- Custom metrics beat generic sentiment when your business has its own churn signals.
- If your team still exports tickets into spreadsheets, you're paying an insight tax every week.
- Good support analysis doesn't replace judgment. It gives judgment a much better starting point.
Why Sampling Fails When Churn Risk Is Hiding in Tickets
Reducing customer churn through support data starts with coverage. If you only review a slice of tickets, you aren't measuring customer risk. You're measuring what happened to show up in the slice.
Most teams think the issue is dashboard quality. Better charts, cleaner filters, nicer reporting. Same thing with CSAT and NPS. People act like the problem is presentation, when the real problem is upstream. You're trying to draw hard conclusions from partial evidence.
At 8:14 AM on a Monday, a support director opens Zendesk and exports a 300-ticket sample from last month’s 12,000 conversations. By 9:02, she’s in Slack telling product that onboarding friction looks like the main retention risk because 27 sampled tickets mention setup confusion. Meanwhile, 41 enterprise accounts had billing-related tickets that never made the cut, and 9 of those accounts later opened renewal-risk conversations with CSMs. The sample felt clean. The business signal wasn't.
This is the False Confidence Loop: sample a subset, spot a pattern, report it with confidence, then build plans around a maybe. It feels disciplined. It isn't. Once ticket volume passes about 1,000 conversations a month, manual sampling starts breaking down as a decision system, even if it's still useful for spot checks. At that point, the hidden cost isn't review time. It's mis-prioritization.
There is a fair case for sampling, by the way. It's fast. It's cheap. A good operator can catch nuance in a small set of tickets. That's true. But nuance without coverage turns into anecdote, and anecdote gets loud fast in product and CX meetings. You leave the room arguing over whose example feels more representative. That isn't analysis. That's theater.
And yeah, it's exhausting. You know the feeling. Somebody asks, "Do we know if this is widespread?" and all you've really got is a few screenshots, a score trend, and a hunch. The next section answers the real question: if the issue isn't missing feedback, what structure do you need to reduce customer churn through support analysis with any confidence at all?
If you want a closer look at the shift from sampled reviews to evidence-backed coverage, you can Learn More.
The Real Problem Isn't Missing Data, It's Missing Structure
The reason teams struggle to reduce customer churn through support analysis isn't that they lack customer feedback. It's that the feedback sits in free text, and free text doesn't make decisions easy on its own.
Support teams already have the raw material. Product teams do too. Thousands of conversations. Complaints, confusion, requests, cancellations, effort signals, frustration signals, weird edge cases, all of it. But raw conversation data has a nasty property: it creates the illusion of richness while blocking consistent measurement. You can read it. You can't easily compare it.
That's why I think a lot of teams are solving the wrong problem. They go shopping for better scorecards when what they really need is a metrics layer that turns messy conversations into structured fields. No structure, no repeatability. No repeatability, no confidence. Simple as that.
A score can flag pain, but it can't explain the mechanism
A sentiment dip tells you that something got worse. It doesn't tell you whether the issue is onboarding friction, account access, broken billing logic, slow performance, or a support policy that made a bad situation worse.
This is where the Why Ladder matters. Ask three questions in order:
- What changed?
- Which customers are affected?
- Why did it happen?
If your system answers only the first question, you're still stuck. Plenty of teams live in that state for years. They track sentiment or CSAT changes month over month, but when leadership asks what to fix, they can't get there without another manual project. That's too slow if churn risk is already building.
The Harvard Business Review archive on customer defections made this point in a broader retention context years ago: keeping customers depends on understanding the drivers behind defection, not just watching lagging indicators. Support conversations are one of the clearest places those drivers show up.
Manual tags look organized until the team changes
A lot of companies try to solve this with internal tagging. Reasonable instinct. It works for a while. Then reality kicks in. One agent tags "refund issue." Another tags "billing confusion." A third skips tagging because the queue is on fire. Now your reporting is built on inconsistent human behavior.
It's usually not laziness. It's the system. Manual tagging asks busy people in live workflows to behave like taxonomists. That rarely lasts. It's like asking airport gate agents to redesign the baggage routing codes while boarding is already delayed; the planes still leave, but the sorting logic quietly degrades until everybody's suitcase ends up in the wrong city.
A better rule is this: if a reporting category needs over 85% consistency to be useful in leadership reviews, don't make frontline speed depend on perfect manual tagging. Use automation to surface granular themes, then normalize them into categories people can actually report on. That's the only way the taxonomy matures instead of drifting.
Black-box outputs create a trust ceiling
What happens when an exec asks, "Show me the ticket," and the system can't? That's the moment a polished insight turns back into a guess.
This is the Proof Threshold: the moment an executive, PM, or support lead asks, "Show me the ticket." If your system can't answer that in under 30 seconds, the insight is weaker than it looks. People may nod in the meeting, but they won't bet roadmap or staffing decisions on it.
I've seen this dynamic enough times that I don't think it's a minor UX issue. It's the whole adoption problem. AI without traceability feels clever right up until someone needs to defend the conclusion in front of finance, product, or the CEO. Then the room gets quiet.
So what does a better operating model look like? You stop asking for prettier summaries and start building evidence-backed metrics from every conversation, which is exactly how the next section approaches reducing customer churn through support analysis.
What Full-Coverage Churn Analysis Actually Looks Like
The way to reduce customer churn through support analysis is to treat tickets like a measurement system, not a reading exercise. Full coverage changes the job from "find examples" to "detect patterns, test them, and act."
That sounds obvious. It isn't. Most teams never make the shift.
Start with a diagnostic, not a dashboard rebuild
Before you change tools or workflows, figure out what stage you're actually in. I use a simple 3-Bucket Support Insight Test:
- Bucket 1: Score-watching. You track CSAT, NPS, maybe sentiment, but can't explain shifts quickly.
- Bucket 2: Sample-reading. You review tickets manually and find themes, but coverage is thin and inconsistent.
- Bucket 3: Evidence-backed analysis. You can segment, quantify, and trace issues back to exact tickets and quotes.
If you're in Bucket 1 or 2, don't jump straight to advanced segmentation. First fix coverage and structure. If you're already in Bucket 3, the next move is usually better prioritization, not more data collection.
That diagnostic sounds basic, but honestly, it saves months. Teams often buy complexity before they have reliable inputs. Before: a team rebuilds dashboards and still can't explain churn. After: they identify the real gap—coverage or structure—and stop solving the wrong layer.
Measure all conversations, then segment by risk
A 2% pattern in 20,000 tickets is 400 conversations. Sampled workflows miss that kind of cluster all the time.
Full coverage means every ingested conversation gets processed, so you can actually see the shape of the problem. Not a guess. Not a weekly hunch. The whole picture.
Once that's in place, use what I call the Churn Signal Stack:
- Negative sentiment or worsening sentiment
- High customer effort
- Churn risk mentions or indicators
- Repeated drivers across a segment
- Revenue or account tier context, if available in your reporting flow
A single angry ticket matters. A cluster of high-effort, high-risk tickets tied to the same driver matters a lot more. That's the difference between noise and a fix list. If three or more signals stack on the same segment in the same month, escalate it as a retention issue; if only one signal appears, monitor it but don't overreact.
Bain's work on retention economics gets cited constantly, but the useful lesson isn't just "retention matters." It's that small signals compound when left alone. Support tickets are where that compounding often starts, long before churn shows up cleanly in a board slide. You can read more in this Bain explainer on retention and growth.
Translate messy language into business language
Picture a revops lead looking at five versions of the same billing complaint in a spreadsheet: "invoice wrong," "charged twice," "refund delay," "annual renewal confusion," "payment issue." Different words. Same fire.
You need two layers. A discovery layer that captures specific themes as they emerge, and a reporting layer that rolls them up into categories leaders can act on. That's the only sane way to reduce customer churn through support analysis at scale. Otherwise every month becomes a new debate about naming.
This is where a raw-to-canonical model works well. Raw themes surface what's new and specific. Canonical categories keep reporting stable enough for trend analysis. If five versions of a billing complaint all roll up into one clear category, your team can finally see whether "billing confusion" is a blip or a pattern.
Custom metrics matter here too. Generic sentiment alone is too blunt. If your business has its own risk signals, say refund intent, downgrade pressure, onboarding confusion, repeated escalations, whatever it is, then define those directly. My rule is simple: if a churn driver comes up in more than 2% of monthly tickets or shows up in leadership reviews twice in a quarter, it deserves its own metric.
Work backward from drivers, not isolated complaints
Bold claim: the loudest ticket is usually the least useful unit of analysis.
Drivers are what let you move from "customers are upset" to "account access issues are creating high effort for new admins in week one" or "billing confusion is increasing churn risk among annual plans." That's useful. That's something product and CX can act on together.
A lot of churn work fails because teams go too narrow too fast. They zoom into examples before they've grouped the pattern. The better sequence is:
- Find the driver
- Measure the size
- Check the segments affected
- Validate with ticket-level evidence
- Prioritize the fix
If step four doesn't happen, you risk building a whole response plan on a labeling error. Fair point if you're thinking this sounds slower. On paper, maybe. In practice, it's faster because you stop revisiting the same debate every week. The tradeoff is real: better structure upfront means more setup work. True. But that setup is exactly what lets you reduce customer churn through support analysis without rebuilding the narrative from scratch in every meeting.
Build a meeting-ready evidence standard
Screenshots persuade. Traceable evidence survives follow-up.
I call this the Meeting-Ready Rule: every claim in a product or CX review should have three things behind it:
- a measured pattern
- a segment or timeframe
- at least two traceable ticket examples
Without those three, you don't really have an insight yet. You have a possible story.
That standard changes behavior. Product gets fewer vague escalations. CX stops bringing screenshot collections that collapse under follow-up questions. Founders and ops leaders can see what's broken, who is affected, and what deserves attention first.
Some teams prefer a lighter standard, and I get why. Meetings move fast. Nobody wants a process tax. But if you're serious about trying to reduce customer churn through support analysis, this is the tradeoff: a little more structure upfront, a lot less confusion downstream.
If you want to see what that looks like in practice, See how Revelir AI works.
How Revelir AI Makes This Process Defensible
Revelir AI is built for teams that want to reduce customer churn through support analysis without relying on samples, stitched-together spreadsheets, or black-box summaries. It sits on top of your support data, processes 100% of ingested conversations, and turns raw tickets into structured signals you can actually trust.
Full coverage and traceability change the conversation
Revelir AI uses Full-Coverage Processing (No Sampling), which means it processes 100% of ingested tickets instead of forcing your team to work from a subset. That's the first shift. You stop arguing about whether the sample was representative and start looking at the full pattern.

Then comes Evidence-Backed Traceability. Every aggregate number links back to the original conversations and quotes. That matters more than people think. When a product leader asks why churn risk is rising in one segment, you don't have to defend a mystery chart. You can show the underlying tickets.
And for teams that need to validate fast, Conversation Insights gives ticket-level drill-down with full transcripts, AI-generated summaries, assigned tags, drivers, and AI metrics. So the proof isn't abstract. It's sitting right there.
Custom metrics and structured analysis make prioritization easier
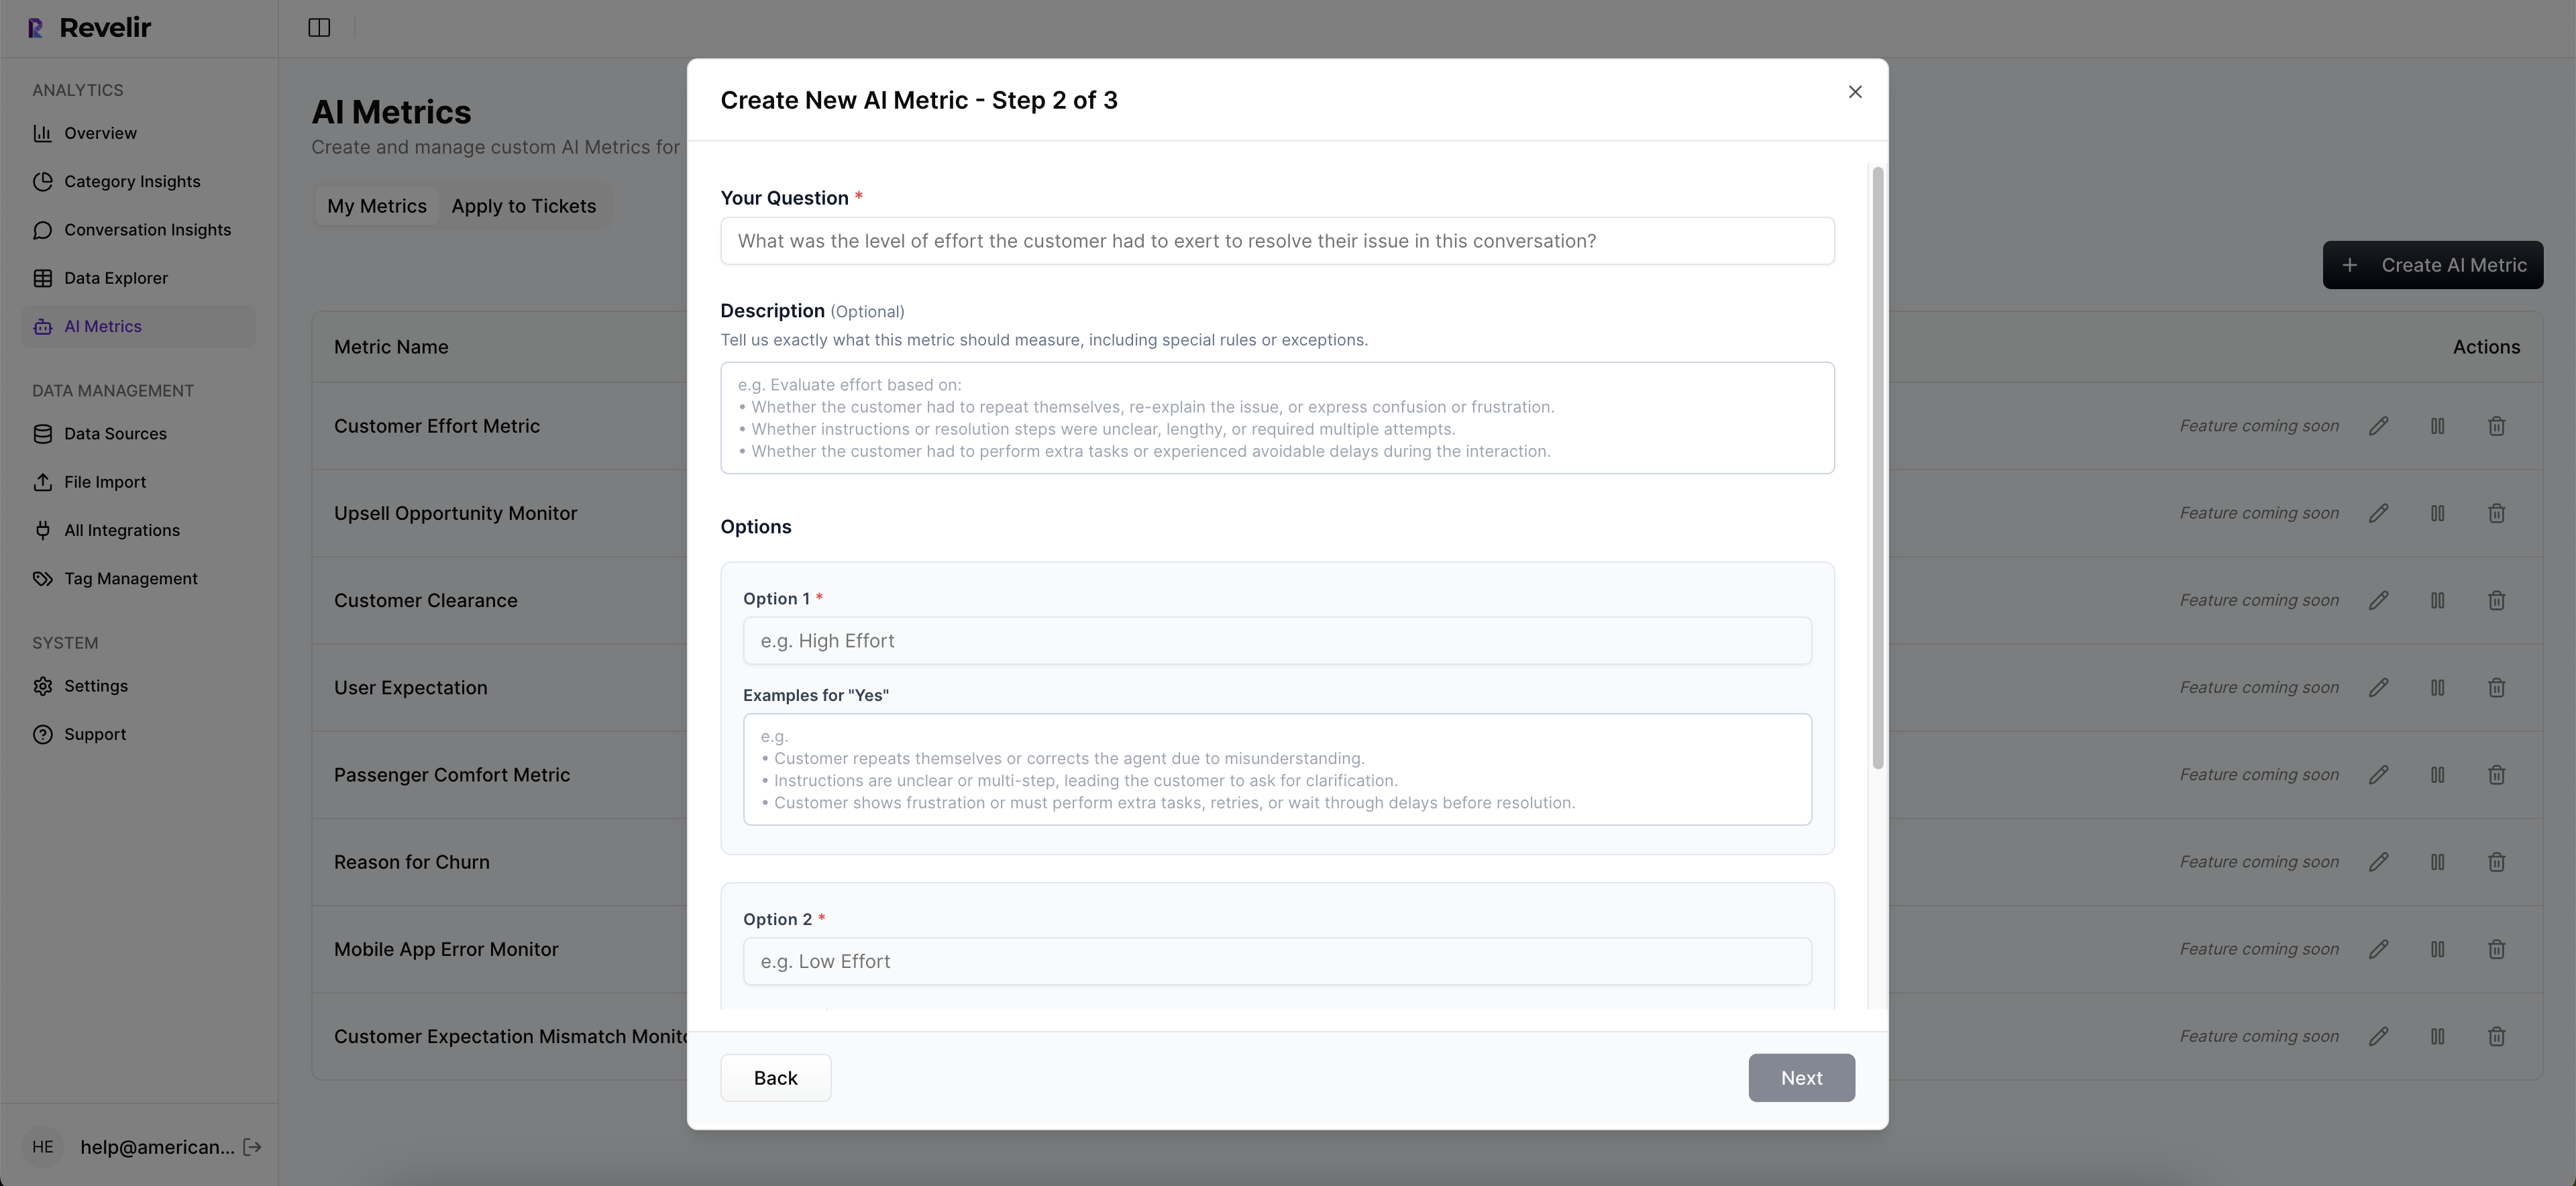
Generic sentiment won't capture every business-specific risk signal. Revelir AI handles the core layer with the AI Metrics Engine, including Sentiment, Churn Risk, Customer Effort, and Conversation Outcome. But the bigger win for a lot of teams is Custom AI Metrics. You can define domain-specific classifiers in your own language, then use those results as structured columns across analysis.
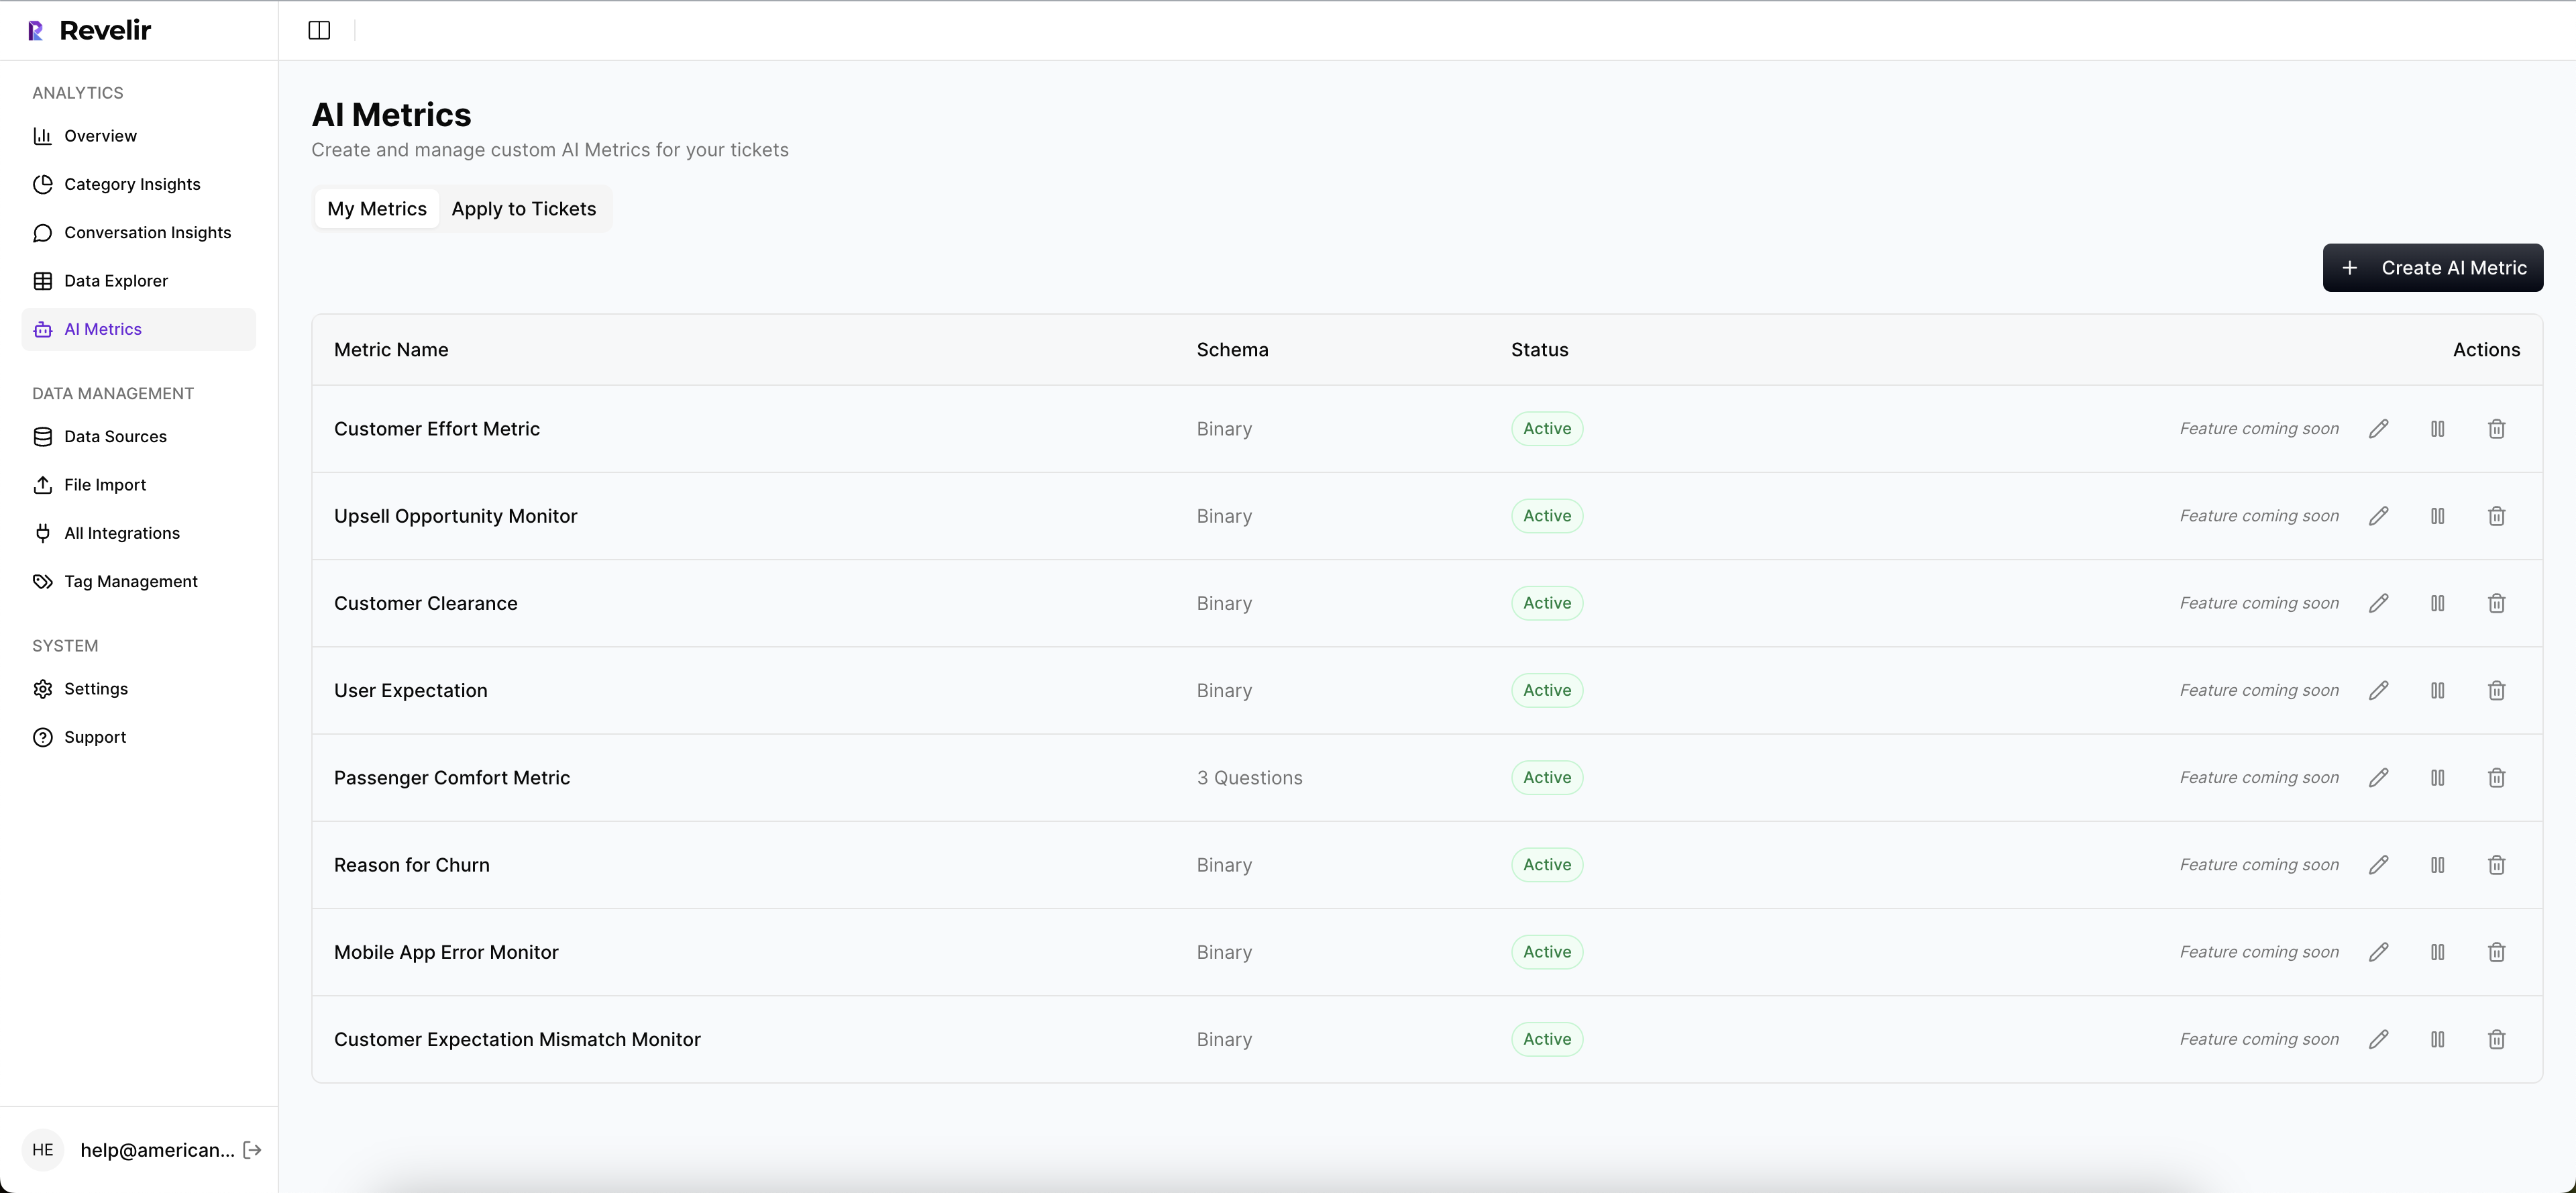
That means if your version of churn risk shows up as refund pressure, implementation friction, renewal confusion, or something else unique to your business, you can measure that directly instead of forcing it into a generic score.
From there, Data Explorer gives you a pivot-table-like workspace to filter, group, sort, and inspect tickets with columns for metrics, tags, drivers, and custom fields. Analyze Data adds grouped analysis by dimensions like Driver, Canonical Tag, or Raw Tag, with interactive tables and stacked bar charts that connect back to the tickets underneath. If your support data already lives in Zendesk, the Zendesk Integration brings in historical and ongoing tickets. If you're starting with exports, CSV Ingestion gives you a low-friction way to pilot or backfill.
That's the real payoff. The hours you used to spend sampling, tagging, and defending your findings turn into a cleaner workflow: measure everything, identify the driver, validate with evidence, and move. If you want to put that model to work, Get started with Revelir AI (Webflow).
What Better Churn Reduction Looks Like From Here
Reducing customer churn through support analysis isn't about collecting more anecdotes. It's about replacing false certainty with full coverage, structure, and proof.
Sampling still has a place for spot checks. Sure. But it shouldn't be the system you trust for churn decisions. Not anymore. The teams that move faster now are the ones that can measure 100% of conversations, define metrics in their own business language, and trace every insight back to the ticket that earned it.
That's usually the shift. Stop reading around the problem. Start measuring it well enough to fix it.
Frequently Asked Questions
How do I analyze customer support tickets effectively?
To analyze customer support tickets effectively, start by using Revelir AI's Data Explorer. This tool allows you to filter, group, and sort tickets based on various metrics like sentiment and churn risk. You can view every ticket with key metadata and even drill down into specific conversations for deeper insights. Remember to segment your analysis by different drivers, such as billing or onboarding issues, to pinpoint areas needing attention.
What if I need to track specific churn signals?
If you need to track specific churn signals, consider using Revelir AI's Custom AI Metrics feature. This allows you to define domain-specific classifiers that reflect your unique business needs, such as refund pressure or onboarding confusion. By setting these custom metrics, you can measure and analyze the signals that matter most to your organization, ensuring that your insights are relevant and actionable.
Can I integrate Revelir AI with my existing support platform?
Yes, Revelir AI can be integrated with your existing support platform, such as Zendesk. This integration allows you to automatically pull in historical and ongoing tickets, ensuring that your analysis is based on the most current data. Once connected, Revelir AI processes 100% of your ingested conversations, giving you a comprehensive view of customer interactions without the need for manual exports.
When should I consider switching to full-coverage processing?
You should consider switching to full-coverage processing when your ticket volume exceeds 1,000 conversations per month. At this scale, relying on sampled reviews can lead to mis-prioritization and missed critical patterns. Revelir AI's Full-Coverage Processing ensures that every ticket is analyzed, providing you with accurate insights into customer churn risks and allowing for more informed decision-making.