

24% of support teams get responses from less than 15% of their surveys, according to CustomerGauge. If you're trying to identify and address churn from that tiny slice while thousands of support conversations sit untouched in Zendesk, you're basically steering from the rearview mirror.
It usually isn't neglect. The signal is trapped in free text, scattered across tickets, and buried under whatever the team had time to sample that week. Same thing with churn: you see the outcome late, then work backward with guesses. If you want to identify and address churn earlier, you need evidence from actual conversations, not scorecards built on partial data. Curious what that looks like in practice? Learn More
Key Takeaways:
- Sampling support tickets is a liability when the goal is to identify and address churn fast.
- The real churn signal usually shows up in support conversations before it shows up in revenue reports.
- Scores can tell you that something changed, but they rarely tell you why customers are frustrated.
- Teams move faster when they use 100% conversation coverage, not small samples and stitched-together anecdotes.
- A useful churn workflow needs three layers: full coverage, meaningful categorization, and proof tied back to real tickets.
- To identify and address churn well, you need segment-level patterns, not a few scary screenshots from Slack.
Why Sampling Makes Churn Harder to Catch
Sampling makes churn harder to catch because it strips out the three things you need to identify and address churn early: frequency, pattern, and concentration by segment. A small review set can surface anecdotes. It cannot tell you, with any confidence, which issue is spreading, who it hurts most, or whether the problem is noise or revenue risk.

A handful of tickets feels smart right up until it doesn't
At 8:14 AM on Monday, a VP of CX opens a Zendesk export and asks an ops manager to review 100 tickets out of 18,000 from the prior month. By 9:30, the summary lands in Slack: billing seems noisy, onboarding feels rough, response times look frustrating. Then the CRO asks the only question that matters: which of those issues is actually tied to churn risk for enterprise accounts? Nobody knows, because "seems" is not a measurement system.
That's the trap. Humans are good at nuance and bad at scale. Manual review has merit, and that's a fair concession, because an experienced operator can catch tone and context a model may miss in a single thread. But once volume moves past roughly 500 tickets a month, the Coverage Confidence Rule kicks in: if you're reviewing under 30% of conversations, you're doing pattern theater, not pattern detection.
You feel busy. You still miss the signal. That's expensive. And once sampling breaks, the next question is obvious: if scores are still intact, why aren't they enough?
Scores tell you something changed, not what to fix
Contrast is the point here: a score can show motion, while a conversation shows mechanism. CSAT and NPS still matter. That's a valid status-quo defense, especially for leadership teams that need one number on a board slide. But if unhappy customers ignore surveys, or your response rate is weak to begin with, the score becomes a lagging indicator with missing fingerprints.
This is where the old dashboard model fails. A score drop says something is wrong. It does not tell you whether the issue is onboarding confusion, broken account access, policy friction, or a workflow that keeps sending customers back to support. The Signal Ladder helps teams identify and address churn without stopping at the first clue:
- Score tells you that pain exists.
- Conversation analysis tells you why it exists.
- Segment analysis tells you who it hurts most.
- Traceability tells you whether the claim survives scrutiny.
Most teams stop at rung one. Then they act surprised when priorities keep getting re-litigated in every meeting. If the score is only the alarm, where does the actual churn story live?
The business cost shows up before finance names it
According to Zendesk's CX Trends research, customers expect companies to use support interactions to improve the product experience, not just close tickets. That sounds soft until the cost lands in hard numbers. Support data, treated correctly, is one of the earliest systems you have to identify and address churn before renewals get weird.
Picture a support lead at 4:47 PM on a Thursday. She notices more tickets mentioning setup friction and repeated login loops in newly launched accounts. Product doesn't see the issue until renewal risk pops 60 days later. Success gets pulled into escalations, finance starts asking about contraction, and now three teams are trying to reconstruct a pattern from CSV exports, Slack screenshots, and memory. It's like trying to audit a call center with sticky notes on a conference-room wall: technically possible, operationally ridiculous.
The hard part isn't getting more feedback. It's seeing the churn pattern while it's still small enough to fix. And that means the next step is obvious: you have to look where customers actually explain the problem.
The Real Churn Problem Lives in Free Text, Not in the Dashboard
The real churn problem lives in free text because customers describe risk in their own language long before they cancel, downgrade, or answer a survey. If you want to identify and address churn early, you need to turn those messy words into structured signals without losing the evidence underneath.
Churn rarely announces itself with the word "churn"
What does churn sound like before it becomes a revenue event? Usually not a cancellation threat. Usually not a dramatic refund demand. More often it sounds like "still not working," "we're blocked again," a ticket reopened for the third time, or a workflow that keeps bouncing between support and product.
That's why the Whisper-to-Exit Model works better than the classic red-flag approach. Stage 1 is repeated effort. Stage 2 is visible frustration. Stage 3 is avoidance or reduced usage. Stage 4 is commercial risk. Wait until Stage 4 and you are no longer trying to identify and address churn. You're writing the postmortem.
nobody's checking for cumulative friction. They're checking for drama. Big difference.
Manual tags break when the taxonomy isn't alive
A support team with 12 agents can create taxonomy debt in a single quarter. One agent logs "login issue," another uses "auth problem," a third writes "MFA loop," and leadership later asks for a clean report on account access friction. The data, which looked organized at creation time, collapses under aggregation.
This is why hybrid tagging matters more than it gets credit for. The Raw-Then-Roll-Up Rule is simple: if your system cannot surface emerging customer language first and then map it into stable reporting categories, you'll miss new problems or drown in tag sprawl. Before, teams force every ticket into a fixed list and lose nuance. After, they capture raw phrasing like "can't log in after password reset" and roll it into canonical buckets like "Account Access" for decision-making.
Same thing with drivers. A driver isn't just a label. It's the bridge between messy ticket language and executive action. Once the taxonomy is stable, though, a harder question shows up: which issue deserves action first?
Evidence changes the politics of prioritization
Bold claim: most churn debates are not debates about churn. They're debates about confidence. One team brings anecdotes. Another brings a dashboard trend. A third brings instinct. Everyone has a slice of reality, and nobody trusts anyone else's slice enough to commit resources.
The Defensibility Test fixes that. Can you answer these three questions in under five minutes?
- Which issue is driving the most negative sentiment?
- Which customer segment is affected most?
- Which exact tickets prove the pattern?
If the answer to any of those is no, the argument is not really about priorities. It's about whether the underlying data can be trusted. Evidence changes the politics because it shortens the distance between claim and proof. So what does a system look like when the point is to identify and address churn before the meeting turns into a courtroom?
How High-Trust Teams Identify and Address Churn Earlier
High-trust teams identify and address churn earlier by converting every support conversation into structured signals, grouping those signals into stable patterns, and ranking issues by business risk instead of volume alone. The goal is not another dashboard. It's a faster way to decide what to fix first and defend that decision across product, CX, success, and finance.
Start with a churn-detection diagnostic, not a tool search
Before you shop for software, run a diagnosis. This is the diagnostic step most teams skip, and it matters because the apparent visibility problem is often a categorization problem or a trust problem. The CARE Framework gives you a fast way to sort that out: Coverage, Attribution, Risk, Evidence.
Ask four questions:
- Coverage: Are you reviewing 100% of support conversations or a sample?
- Attribution: Can you group issues into stable buckets without losing nuance?
- Risk: Can you see churn risk, sentiment, and effort by segment?
- Evidence: Can every chart link back to the exact tickets and quotes?
If you answer no to two or more, stop shopping and fix the broken layer first. If Coverage is weak, start there. If Evidence is weak, do not trust the beautiful chart yet. That may sound unglamorous, and fair enough, because infrastructure work rarely gets applause. But teams that skip this step usually buy reporting before they buy credibility.
Measure churn drivers, not just complaint volume
180 tickets can matter more than 800. That's the part teams miss when they rank issues by volume. Loud issues create operational pain, sure, but the patterns most likely to identify and address churn are often smaller, sharper, and concentrated in valuable segments.
The Driver Severity Matrix helps. Score each issue on three axes: negative sentiment rate, customer effort, and churn-risk concentration. If an issue is high on two of the three, escalate it. If it's high on all three, fix it before the month closes. That's a real decision rule, not a vague priority exercise.
Before, a team sees 800 billing tickets and calls billing the top issue. After, they segment the data and find onboarding generates only 180 tickets, but 42% of those conversations carry high-effort and high-churn-risk signals among new enterprise accounts. Different issue. Different urgency. Different roadmap conversation.
And yes, volume still matters because ops load is real. That's the honest limitation. But if the goal is to identify and address churn, operational inconvenience cannot outrank retention risk by default.
Use segment cuts early or you'll fix the wrong thing
Question first: what if the issue isn't broad at all? Churn risk is rarely uniform, which means averages can be actively misleading. The Segment-First Rule is blunt for a reason: if a pattern has not been broken down by customer type, plan, geography, lifecycle stage, or product area, treat the conclusion as provisional.
A concrete example helps. A support team sees a rise in negative conversations about performance. Without segmentation, leadership assumes a broad reliability issue and starts discussing platform investment. Once the team cuts the data by plan tier and account age, the pattern shrinks fast: the issue is concentrated in newly onboarded mid-market customers using one workflow in one region. Not a platform crisis. A targeted churn risk with a clear owner.
Done right, segmentation works like packet inspection for customer operations. From the outside, all the traffic looks similar. Open the payload and the real problem appears. That is how teams identify and address churn without funding the wrong fix.
Build a 14-day fix loop, not a quarterly insight deck
Quarterly insight decks feel responsible. They also let churn harden in the background. A tighter operating rhythm works better, which is why the 14-Day Fix Loop is so useful for teams trying to identify and address churn before renewal calls get awkward.
Here is the walkthrough:
- Pull the top 3 issues by driver severity.
- Isolate the affected segment.
- Review 20 to 30 representative conversations.
- Assign one owner per issue.
- Ship one fix, message change, or workflow adjustment.
- Recheck sentiment, effort, and churn-risk movement two weeks later.
Before, insights pile up in slides. After, one owner ships one change against one pattern and checks whether the signal moved. That's not perfection. It's learning speed. Want to see how a workflow like that can run without ripping out your helpdesk? See how Revelir AI works
Treat traceability as a decision tool, not a compliance feature
A chart without a trail back to real tickets is just a polished opinion. Lots of teams treat traceability as a nice-to-have for audits or skeptical executives. Too small a view. Traceability is the mechanism that lets cross-functional teams identify and address churn without stalling in the trust gap.
The Quote-to-Chart Rule is dead simple: if an aggregate trend cannot be traced back to underlying conversations in one click path, expect delay. People trust what they can inspect. Especially in retention work, where product, CX, success, and finance all have different thresholds for belief.
This changes the presentation layer too. Instead of saying, "customers are frustrated with onboarding," the team can say, "newly onboarded enterprise accounts show a 31% negative sentiment rate on onboarding-related conversations, and these eight tickets explain why." Different sentence. Different credibility. And once credibility is in place, the product question becomes practical: what system makes that level of proof possible by default?
How Revelir AI Makes Churn Analysis Defensible
Revelir AI makes churn analysis defensible by processing 100% of support conversations, structuring them into usable metrics and tags, and linking every pattern back to the original tickets behind it. That gives teams a practical way to identify churn with evidence instead of argument.
Full coverage first, then structure you can actually use
Revelir AI starts with Full-Coverage Processing, meaning it processes 100% of ingested tickets without requiring manual tagging upfront. That's the first operational shift. You're not inferring from a subset anymore. You're using the full conversation body, which makes it much easier to identify churn risk before the signal gets diluted.

From there, Revelir AI applies a Hybrid Tagging System. Raw Tags surface the specific language customers actually use. Canonical Tags roll those signals into cleaner reporting buckets. Drivers group those patterns into leadership-friendly themes. Discovery first. Reporting second. The sequence matters because support analytics is a lot like warehouse logistics: if the boxes arrive unlabeled, every downstream report looks tidy while the floor stays chaotic.
If your data lives in Zendesk, the Zendesk Integration can pull in historical and ongoing tickets with transcripts and metadata. If you'd rather start with exports, CSV Ingestion gives you a lower-risk pilot path.
Metrics, drill-downs, and proof in the same workflow
Once conversations are ingested, Revelir AI computes structured signals through its AI Metrics Engine, including Sentiment, Churn Risk, Customer Effort, and Conversation Outcome. If your team needs different lenses, Custom AI Metrics let you define classifiers in your own language and analyze them like any other field.

Then the workflow gets more useful. Data Explorer gives teams a pivot-table-like workspace to filter, group, sort, and inspect tickets by sentiment, churn risk, effort, tags, drivers, and custom metrics. Analyze Data summarizes those metrics by dimensions like Driver, Canonical Tag, or Raw Tag with interactive grouped views. And if you need to validate a pattern before taking it to leadership, Conversation Insights lets you drill all the way down to ticket-level transcripts, summaries, assigned tags, drivers, and metrics.
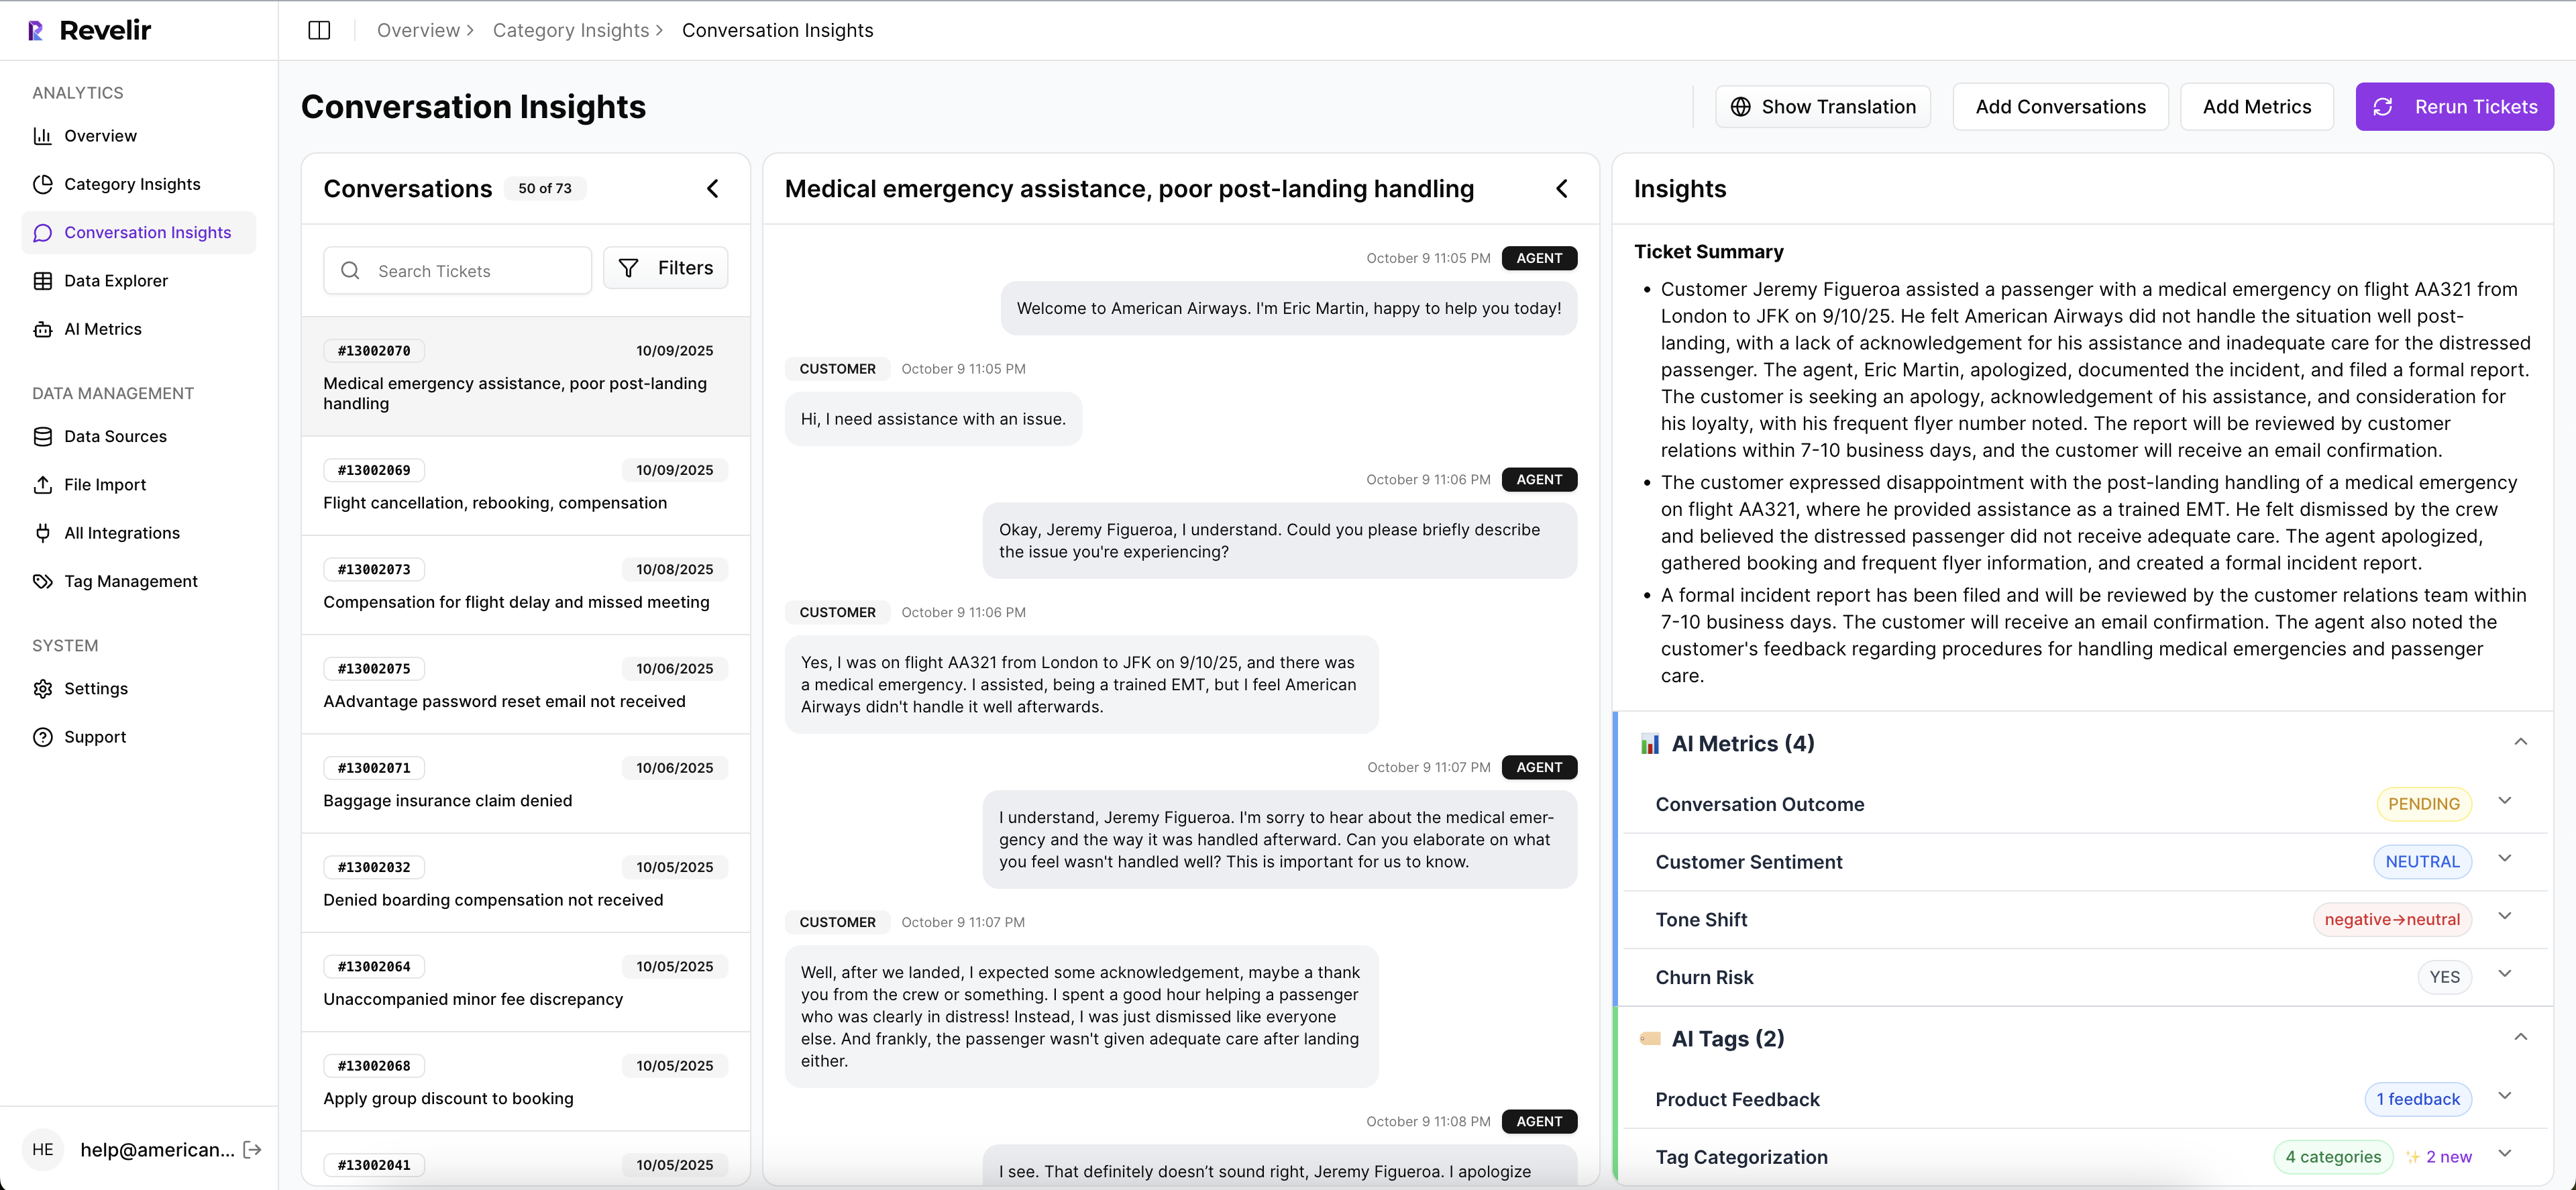
This is the part that changes meetings. Revelir AI includes Evidence-Backed Traceability, so every aggregate number links to the underlying conversations and quotes. That's what closes the loop between "we think this is causing churn" and "here's the proof." If you need structured outputs elsewhere, API Export is there too.
If you're ready to stop arguing over samples and start working from the full picture, Get started with Revelir AI
Stop Guessing Which Issues Put Revenue at Risk
If you want to identify and address churn, start where the evidence already lives: support conversations. Sampling gives you partial truth. Full coverage, structured drivers, and traceable evidence give you a way to identify and address churn faster, with less internal debate and a lot more confidence.
The teams that get ahead of churn aren't reading more random tickets. They're building a clearer system for seeing what customers are already telling them. The real question isn't whether the signal exists. It's whether your team can see it before revenue does.
Frequently Asked Questions
How do I use Revelir AI to analyze churn risk?
To analyze churn risk with Revelir AI, start by ingesting all your support conversations through the Zendesk integration or CSV ingestion. This ensures you have full coverage of your data. Next, use the Data Explorer to filter and group tickets by churn risk and sentiment. You can drill down into individual conversations to understand the underlying issues better. Finally, leverage the AI Metrics Engine to compute structured signals like Customer Effort and Churn Risk, which will help you identify patterns and prioritize issues effectively.
What if I need to validate patterns before presenting to leadership?
If you need to validate patterns before a leadership meeting, use the Conversation Insights feature in Revelir AI. This allows you to drill down into ticket-level data, view AI-generated summaries, and see assigned tags and metrics. By linking your findings back to specific conversations, you can build a strong case with evidence-backed insights. This transparency helps gain trust and credibility in your presentation.
Can I customize metrics in Revelir AI?
Yes, you can customize metrics in Revelir AI using the Custom AI Metrics feature. This allows you to define specific classifiers relevant to your business needs, such as reasons for churn or upsell opportunities. You can create custom questions and value options, which will then be stored as columns for analysis. This flexibility helps you tailor the insights to what matters most for your team.
How do I ensure consistent tagging of support tickets?
To ensure consistent tagging of support tickets, utilize Revelir AI's Hybrid Tagging System. This system automatically generates Raw Tags based on the language used in customer conversations while allowing you to create and manage Canonical Tags for reporting. By refining your taxonomy over time, Revelir AI learns and applies these mappings to future tickets, ensuring that your tagging remains organized and relevant.
When should I consider switching from sampling to full coverage?
You should consider switching from sampling to full coverage when you notice that your current approach isn't capturing the full picture of customer sentiment and churn risk. If your team is relying on a small subset of tickets, you're likely missing critical signals. With Revelir AI's Full-Coverage Processing, you can analyze 100% of your support conversations, which eliminates blind spots and provides a more accurate understanding of customer issues.