

Sampling support tickets feels responsible. It isn't enough if you're trying to extract actionable insights from support data you can actually defend in a product review, board slide, or weekly ops call.
Most teams don't have an insight problem. They have a proof problem. And if nobody's checking the full conversation set, you're usually making decisions off partial truth.
Key Takeaways:
- If you want to extract actionable insights from support conversations, sampling creates blind spots you can't see.
- CSAT, NPS, and basic sentiment can flag that something changed, but they rarely explain why.
- The real unlock is turning free-text tickets into structured metrics tied back to the original conversations.
- Drivers, traceable quotes, and full-coverage analysis give CX and product teams something they can act on.
- A better system starts with 100% conversation coverage, then layers in taxonomy, metrics, and drill-down validation.
- Tools should sit on top of your existing helpdesk, not force a rip-and-replace.
Why Most Teams Struggle to Extract Actionable Insights From Support Data
Extracting actionable insights from support data is hard because most teams are not really analyzing support conversations. They're sampling, scanning dashboards, and filling in the blanks with intuition. That gives you motion, not clarity. And once that pattern sets in, every decision gets a little shakier.
Sampling feels disciplined, but it quietly breaks the picture
It's usually the same story. A support leader pulls a few dozen tickets, maybe reads the ugly ones, maybe checks a sentiment trend, then tries to summarize what customers "seem" to be saying. On paper, that sounds reasonable. In practice, it means the loudest examples start standing in for the whole customer base.
The problem isn't that sampling is lazy. It's that sampling creates false confidence. If you're handling hundreds or thousands of tickets a month, even a thoughtful sample misses edge cases, emerging patterns, and low-volume issues that later become expensive. McKinsey has written about the value of using unstructured data in decision-making, and support is one of the clearest cases for it. The signals are there. They're just buried.
Manual review also burns time fast. Read 100 tickets closely and you've already spent hours. Read 10% of a 5,000-ticket month and you still don't know if the sample was representative. That's where teams get stuck. You did the work. You still can't prove the conclusion.
Scores tell you something changed, not what caused it
CSAT and NPS have a place. Fair point. They can help you spot movement over time. Same thing with basic sentiment labels. They can show whether the mood is shifting. But none of that really explains the root cause unless you connect the score back to the underlying conversation.
That's the hidden problem. Scores compress the story. A drop from 82 to 74 matters, sure, but what are you supposed to do with that on Monday morning? Fix billing confusion? Improve onboarding emails? Change a product flow? Without the driver behind the score, you're still guessing.
I've seen teams spend whole meetings arguing over what one dip "probably means." That's the exhausting part. Not the data collection. The debate after. You leave with three theories, no proof, and a follow-up doc nobody wants to own.
Free-text support data gets ignored because it isn't decision-ready
Most of the useful stuff in support lives inside the messy part. The actual words. The repeated complaint. The odd phrase customers keep using. The point where someone says they're thinking about canceling. That's where you extract actionable insights from support conversations that matter. But free-text is inconvenient, so teams flatten it into counts, tags, and anecdotes.
That shortcut has a cost. Product teams end up with a handful of quotes and a broad claim. CX teams end up with dashboard tiles but no explanation. Execs ask, "How big is this really?" and nobody has a clean answer. If you've been in that room, you know the feeling. Your instinct says the pattern is real, but your evidence looks thin.
So the issue isn't lack of data. It's lack of structured, traceable interpretation. Once you see that, the old workflow starts to look broken on purpose.
What You Really Need to Extract Actionable Insights From Support Conversations
To extract actionable insights from support conversations, you need a system that converts raw ticket text into structured, reviewable evidence. That means full coverage, consistent classification, and a way to move from aggregate pattern to original ticket without losing context. Otherwise you're still operating on summaries of summaries.
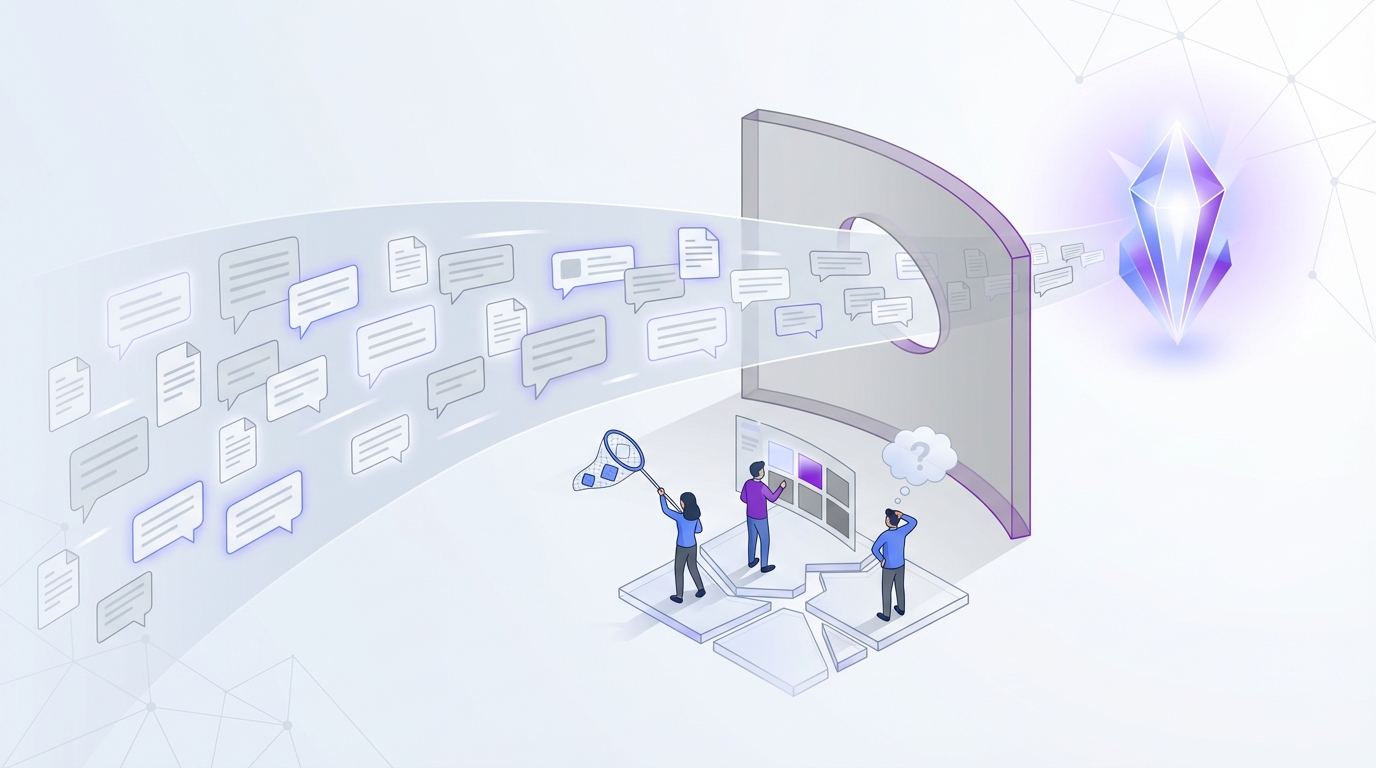
Start with coverage, or you're building on bias
The real problem isn't that support teams lack dashboards. It's that the data underneath those dashboards is incomplete. Most teams are trying to reason from a subset, then acting like the subset tells the whole story. It doesn't.
If you want a defensible answer, start with 100% conversation coverage. Not because bigger is always better. Because blind spots are expensive. Sampling misses the low-frequency issues that often hit high-value customers first. It also misses changes in language over time, which matters when a known issue starts showing up in a new segment or new product area.
This matters even more when leadership asks hard questions. Who's affected? How many customers? Is this new or recurring? A sample can't answer that cleanly. You need the whole set. Gartner has pointed to the growing importance of using customer service data as a strategic input. That's not possible if you're only looking at fragments.
Then structure the mess into categories your team can use
Coverage alone won't save you. Reading every ticket manually is just a bigger version of the same pain. You need structure. That usually means turning raw conversation text into fields you can filter, compare, and group.
At a minimum, the system has to capture themes, risk signals, and business-relevant categories. Raw labels are useful because they surface detail humans might miss. But you also need cleaner reporting categories that match how your team actually talks. Otherwise you end up with hundreds of tiny labels and no shared language.
That's why the best setups combine granular tagging with a more stable taxonomy. You can keep the nuance without wrecking reporting. And you can finally answer basic but important questions like:
- Which issues are driving negative sentiment this month?
- Are onboarding complaints rising in one segment or across the board?
- Which themes show high effort and churn risk together?
- What changed after the last release?
Those are the questions that help you extract actionable insights from support data, not just observe it.
You need drivers, not just labels
This is where a lot of analytics projects go wrong. They stop at tagging. Better than nothing, sure. Still not enough. A pile of tags tells you what was mentioned. It doesn't always tell you why the issue matters or how to roll it up for decision-making.
Drivers solve that. They group related issues into a higher-level explanation the business can use. Billing. Onboarding. Performance. Account access. Stuff like that. Once you have that layer, your reporting gets sharper. Product can see what to fix first. CX can see where effort is climbing. Ops can see where escalations are coming from.
Honestly, this is the part most teams underestimate. They think the challenge is finding signals. The challenge is organizing signals into something a room full of humans will trust and act on.
Every metric has to lead back to the original conversation
Let's pretend your dashboard says churn risk is up in one customer segment. Good. Useful. Now what?
If you can't click into the source conversations and read what customers actually said, the metric becomes another black box. That's where trust falls apart. Product leaders get skeptical. Support leaders start caveating everything. Analysts spend half their time pulling quotes to back up the chart.
Traceability fixes that. Every aggregate number should connect back to real tickets and real language. That makes the insight audit-ready. It also changes the tone of the discussion. People stop arguing about whether the pattern exists and start asking what to do next.
That's the shift. Not more charts. Better evidence.
A Better System for Turning Support Tickets Into Decisions
A better way to extract actionable insights from support tickets starts with a simple sequence: ingest the conversations, structure the text, analyze the patterns, and validate them in the source. The method isn't complicated. The discipline is. Most teams skip one of these stages and then wonder why the output feels weak.
Ingest everything first, then stop exporting spreadsheets forever
You need all relevant support conversations in one analyzable layer before anything else works. If data comes in late, partially, or by one-off export, you're already behind. Pull the historical set. Keep the incoming flow current. Then work from that shared base.
For most teams, this means connecting the existing helpdesk or uploading historical exports when you need a backfill or pilot. The key is not the transport method. It's consistency. You want the same logic applied across the whole dataset so trends mean something over time.
Once that base exists, you can finally extract actionable insights from support conversations without rebuilding the dataset every month. That's a huge operational relief. It also removes one of the quietest sources of bias: whoever happened to export the file and how they cleaned it.
Translate raw conversations into structured fields people can filter
After ingestion, the next step is turning free-text into structured columns the business can actually use. Sentiment. Churn risk. Effort. Outcome. Tags. Drivers. Custom business metrics when needed. Without that structure, you can't compare, filter, or segment anything at speed.
This is also where nuance matters. Generic labeling won't cut it if your team has domain-specific questions. A travel company might care about passenger comfort. A B2B SaaS team might care about renewal risk, setup friction, or expansion signals. Same thing with enterprise support. One-size-fits-all labels usually miss what matters most.
A solid system lets you define those categories in your own language, then use them like any other field in analysis. That's when support stops being a pile of transcripts and starts becoming an operating signal.
Analyze patterns at the group level, not ticket by ticket
Most teams begin with anecdote because that's the easiest thing to see. One angry ticket. One weird thread. One customer who says exactly what leadership fears. The problem is that anecdote doesn't tell you scale.
Group-level analysis does. You need to compare patterns by theme, segment, tag, date range, or issue cluster. You need to ask which driver is tied to negative sentiment, where effort is high, and which categories are appearing more often in a specific cohort. That's how you extract actionable insights from support data that can influence priorities.
A lot of this can be done in table views and grouped summaries. Harvard Business Review has covered how firms are using unstructured data to improve decisions. The point isn't fancy analysis for its own sake. It's fast pattern recognition with enough structure to move from hunch to action.
Validate the pattern before you socialize it
This is the step people skip when they're rushed. They see a spike. They build the slide. They send the note. Then somebody asks for examples and the whole thing slows down.
A better rhythm is simple. Spot the pattern. Drill into the source conversations. Read enough examples to validate what the aggregate is telling you. Pull the representative quotes. Then take it to the room.
That last part matters. Because trust isn't built by saying the model found something. Trust is built when the metric and the transcript say the same thing. When your chart and your quote agree, you stop sounding speculative.
Turn findings into a repeatable operating loop
The goal isn't a one-time insight deck. It's a recurring system for decisions. Weekly CX review. Monthly product themes. Quarterly churn-risk analysis. Whatever cadence makes sense for your team. What matters is that the method repeats.
That loop usually looks like this:
- Ingest current support conversations.
- Structure them into usable metrics and categories.
- Group by driver, tag, segment, or risk signal.
- Drill into source tickets to confirm the pattern.
- Bring evidence and counts into the decision meeting.
- Track what changes after the fix.
Do that consistently and support becomes one of the clearest sources of customer truth in the business.
If you want to see what that kind of workflow looks like in practice, See how Revelir AI works.
How Revelir AI Makes Support Insights Defensible
Revelir AI turns support conversations into structured, evidence-backed analysis by processing 100% of tickets, classifying them into usable metrics and tags, and linking every number back to the source conversation. That means you can extract actionable insights from support data without relying on samples, black-box outputs, or stitched-together spreadsheets.
Full coverage and flexible ingestion remove the blind spots
Revelir AI starts by getting the conversation data in cleanly. The Zendesk Integration pulls in historical and ongoing tickets, including transcripts, tags, requesters, agents, timestamps, and metadata. If you're not ready for a live connection, CSV Ingestion lets you upload exports from systems like Zendesk, Intercom, or Freshdesk for pilots, backfills, or testing.

That matters because the cost we talked about earlier is coverage. If nobody's checking the full set, your conclusions stay soft. Revelir AI addresses that with Full-Coverage Processing, which analyzes 100% of ingested tickets with no manual tagging required upfront. So instead of debating whether the sample was representative, your team can work from the full picture.
Metrics, tags, and drivers make the dataset usable
Once the tickets are in, Revelir AI structures the mess. The AI Metrics Engine computes Sentiment, Churn Risk, Customer Effort, and Conversation Outcome as fields you can filter and analyze. The Hybrid Tagging System adds AI-generated Raw Tags for detailed themes, while Canonical Tags give your team human-aligned categories for reporting. Users can map raw tags to canonical tags, refine the taxonomy, and let Revelir AI learn those mappings over time. Drivers add the higher-level layer that helps answer why an issue is happening, not just what was mentioned.

That combination is what makes analysis usable in the real world. You can look across thousands of tickets and isolate which driver is tied to higher effort, which canonical category is rising, or where churn risk is clustering. And if your business needs a metric that generic models don't capture, Custom AI Metrics let you define classifiers in your own language and store the results as columns in the dataset.
If that's the problem you're trying to solve, Learn More.
Data Explorer and traceability turn analysis into proof
This is where the story gets practical. Revelir AI gives teams a pivot-table-like Data Explorer where they can filter, group, sort, and inspect every ticket with columns for sentiment, churn risk, effort, tags, drivers, and custom metrics. Analyze Data adds guided grouped analysis so you can summarize those metrics by Driver, Canonical Tag, or Raw Tag and inspect the results in interactive tables and charts.

Then you validate it. Conversation Insights lets you drill into the ticket-level transcript, see AI-generated summaries, and review assigned tags, drivers, and AI metrics. Evidence-Backed Traceability links every aggregate number to the underlying conversations and quotes, which is a big deal when product or leadership asks for proof. And if your team wants to bring those structured metrics into an existing BI setup, API Export supports that workflow after the analysis is done inside Revelir AI.
Get started with Revelir AI (Webflow)
The Teams That Learn Fastest Usually Listen Better
The best way to extract actionable insights from support data is to stop treating support as a reporting afterthought and start treating it like a decision system. When you analyze 100% of conversations, structure the text into usable metrics, and trace every finding back to source tickets, the guessing drops fast.
Most teams already have the raw material. It's sitting in the helpdesk. The difference is whether you're still reading samples and debating scores, or finally working from evidence you can trust.
Frequently Asked Questions
How do I set up Revelir AI with my existing helpdesk?
To set up Revelir AI with your helpdesk, start by integrating it with platforms like Zendesk. This allows Revelir to pull in historical and ongoing support tickets automatically. If you're not ready for a live connection, you can use the CSV ingestion option to upload ticket data from your helpdesk. Just export your tickets as a CSV file and upload it via the Data Management section in Revelir. This will help you analyze your support conversations without missing any critical data.
What if I need to analyze specific themes in support tickets?
If you want to analyze specific themes in your support tickets, use the Hybrid Tagging System in Revelir AI. This system generates AI-driven Raw Tags for detailed themes and allows you to create Canonical Tags that align with your team's language. You can filter and group tickets by these tags in the Data Explorer, helping you identify patterns and issues that matter most to your business.
How do I ensure my analysis is based on complete data?
To ensure your analysis is based on complete data, leverage Revelir AI's Full-Coverage Processing feature. This processes 100% of your ingested tickets without any manual tagging required upfront. By analyzing all support conversations, you eliminate blind spots and biases that come from sampling. This way, your insights are more reliable and defensible when discussing findings with your team.
Can I customize metrics for my specific business needs?
Yes, you can customize metrics in Revelir AI using the Custom AI Metrics feature. This allows you to define domain-specific classifiers tailored to your business needs, such as tracking upsell opportunities or customer satisfaction levels. You can create custom questions and value options, and the results will be stored as columns in your dataset, making them easily accessible for analysis.
Why should I validate patterns in support data before sharing?
Validating patterns in support data is crucial because it builds trust in your findings. Use the Conversation Insights feature in Revelir AI to drill down into the original tickets and review AI-generated summaries, tags, and metrics. By confirming that the aggregate data aligns with the actual conversations, you can present evidence-backed insights that stakeholders will trust, reducing skepticism during discussions.