

Support data is messy for a reason. If you want to analyze customer experience data with sampled tickets, CSAT trends, and a few screenshots in a slide deck, you're not really analyzing it. You're just reducing uncertainty badly.
It's usually the same story. The team has plenty of customer data, nobody's checking all of it, and the big decisions still get made off a mix of scorecards, memory, and whoever read the angriest ticket that week.
Key Takeaways:
- To analyze customer experience data well, you need full conversation coverage, not a sample.
- Scores can flag that something changed, but they rarely explain why it changed.
- The root problem is unstructured ticket data, not a lack of dashboards.
- Better CX analysis starts with turning conversations into structured metrics, tags, and drivers.
- Traceability matters because leaders trust insights they can verify in the original tickets.
- Tools like Revelir AI fit best after you've decided the new standard is evidence-backed analysis, not score-watching.
Why Most Teams Analyze Customer Experience Data the Wrong Way
Most teams analyze customer experience data through summaries, exports, and score trends. That approach misses the real signal because the most useful evidence sits inside the conversations, not above them in a dashboard.
The problem isn't low visibility
The problem isn't that teams have no data. It's that they have too much of the wrong shape of data. Support platforms are full of tickets, replies, tags, timestamps, and status changes, but very little of that is structured in a way that lets you answer basic questions with confidence.
You see this all the time. A support leader notices CSAT slipping. A product manager hears that onboarding complaints are up. Someone exports a CSV, reads 50 tickets, groups a few issues by hand, and tries to tell a clean story from a tiny slice of the whole thing. It feels responsible because people are doing real work. But it's still guesswork.
Same thing with sentiment tools. If all you get is a positive, neutral, or negative label, you still don't know what's driving the drop. Was it billing confusion? A login issue? Slow performance for one segment? Angry customers with high churn risk? The score is real. The explanation usually isn't.
Sampling creates false confidence
Sampling makes customer analysis look cleaner than it is. You review a handful of tickets, find a pattern, and assume it's representative. Sometimes it is. Often it isn't. That's the problem.
Let's pretend your team handles 8,000 tickets a month. Even if you review 400 of them, that's still only 5% of the dataset. You're betting product priorities, staffing choices, and executive updates on the idea that the 5% you saw reflects the 95% you didn't. That's a risky way to run CX. And when the sample is biased toward escalations, VIP accounts, or whatever happened to get attention that week, the mistake compounds.
The cost isn't just analytical. It slows action. Teams end up arguing about whether the sample was fair instead of deciding what to fix. That's the hidden drag. Not the meeting itself. The credibility gap underneath it. If you've ever had someone ask, "But how many tickets is that really based on?" you already know the problem.
The emotional hit is real, even if nobody says it out loud
Bad customer analysis creates a weird kind of organizational fatigue. You know something is broken, but you can't prove it cleanly enough to get alignment. So people hedge. They soften the recommendation. They ask for another pass.
Honestly, that's when teams start losing time and trust at the same time. Support feels ignored. Product feels blamed. Leadership gets charts without conviction. Nobody loves working like that.
What Customer Experience Data Actually Needs to Become Useful
Customer experience data becomes useful when conversations are turned into structured, traceable signals. Until that happens, most teams are looking at noise with a few anecdotes attached.
Free text is the real bottleneck
Support tickets are rich. That's the good news. They're also chaotic. That's the bad news. Customers don't describe problems in neat categories. Agents don't tag things consistently. Two people can read the same thread and come away with different conclusions about effort, urgency, or root cause.
That's why so many teams think they have an analysis problem when they really have a data-shape problem. The information exists. It's trapped in language. To analyze customer experience data in a way that stands up in product reviews or leadership meetings, you need those conversations translated into structured fields you can filter, group, compare, and validate.
That means more than a top-line score. It means issues, themes, drivers, effort, churn signals, and outcomes. It means being able to look at a pattern and trace it back to the actual tickets behind it. Without that, you're still one skeptical executive question away from the whole story wobbling.
Scores tell you what happened, not why
Scores aren't useless. They just get too much credit. CSAT, NPS, and basic sentiment can signal movement. They can tell you when something changed. They can't reliably tell you why it changed or what deserves attention first.
That's where most teams go wrong. They treat the score like the strategy. But the score is just the alert. The real work starts when you ask what is driving the shift, who is affected, how broad the problem is, and whether the issue maps to a fixable product or support pattern.
A McKinsey piece on customer care points to the value of using advanced analytics to identify the drivers behind customer behavior, not just watch lagging indicators like satisfaction scores. That's the distinction that matters for operators. Read the McKinsey analysis.
Trust comes from traceability
This part gets overlooked. A chart is only persuasive for as long as no one asks where it came from. The second a leader asks for examples, segments, or source context, weak analysis starts to crack.
If you can analyze customer experience data and connect every pattern back to the original conversations, the conversation changes fast. Now the question isn't whether the issue is real. It's what to do about it. In my experience, that's the line between analysis that informs and analysis that actually moves a roadmap.
For a broader take on why unstructured customer feedback needs more than summary metrics, Gartner has written about the shift toward using text analytics and VoC data to find root causes, not just watch score movement. See Gartner's customer analytics perspective.
How to Analyze Customer Experience Data Without Guessing
To analyze customer experience data well, start with full coverage, structure the language into usable fields, group issues into decision-ready themes, and validate every pattern against the source tickets. That's the operating model that holds up.
Start with complete conversation coverage
You need all the conversations. Not the loudest ones. Not the newest ones. Not a handpicked sample. All of them. That's the baseline if you want to analyze customer experience data without built-in bias.
This sounds obvious until you look at how most teams really work. They sample because sampling feels practical. It keeps the project small. It also keeps the blind spots intact. Quiet but costly issues stay hidden. Long-tail patterns never get enough volume to show up. Segment-specific pain gets flattened into averages.
Full coverage changes the math. Once every ticket is processed, you can stop debating representativeness and start slicing the dataset by date, segment, issue type, product area, or customer risk. That's when analysis becomes operational instead of editorial.
Turn conversations into structured metrics
Raw text has to become fields. That's the move. Sentiment matters. So do effort, outcome, churn signals, and issue labels. But those metrics need to be usable in analysis, not buried in one-off model output.
The better approach is to create a structured layer on top of the ticket stream. Each conversation should carry a set of attributes that let you compare, filter, and group without rereading every transcript. That gives you speed without losing the original context.
And yes, some teams worry this flattens nuance. Fair point. But the alternative is worse. Unstructured review at scale almost always collapses into selective reading and memory. Structured metrics don't replace judgment. They make judgment possible at volume.
Build a taxonomy people can actually use
This is where most internal systems break. Teams either go too loose or too rigid. If tagging is too granular, nobody can report on it. If it's too broad, nothing useful emerges. You need both layers.
A workable model starts with detailed issue signals, then rolls them up into normalized categories and broader drivers. That gives operators one level for discovery and another for reporting. Support can see what's surfacing. Product can see why it matters. Leadership can see where the pattern sits at a higher level.
Same thing with custom business questions. If your company cares about churn risk in enterprise accounts, failed onboarding for self-serve users, or refund pressure after policy changes, your analysis model has to reflect that. Generic labels rarely capture what your business actually needs to know.
Keep validation close to the analysis
This is the part I'd argue matters most. Every aggregate needs a path back to the underlying tickets. Not just because it's nice to have. Because that's how you stop bad interpretation before it spreads.
When a metric spikes, you should be able to inspect the underlying conversations quickly. Read the transcripts. Check the quotes. See whether the issue is real, edge-casey, or broader than it first looked. That loop between summary and source is what keeps the analysis honest.
A lot of AI systems lose trust right here. They produce outputs, but nobody can inspect the reasoning in a useful way. That's a problem. Transparent systems get adopted faster because they let teams verify before they escalate.
Ask operational questions, not vanity ones
Once the data is structured, the questions need to improve too. Don't stop at "How is sentiment trending?" Push further. Which drivers are pushing negative sentiment? Which issue types show high customer effort? Which conversations point to churn risk? Which product area is creating repeat contact volume?
Those are fix-first questions. They turn CX analysis into prioritization. And they create a much better link between support, product, and ops because everyone is looking at the same evidence from different angles.
If you want a clean starting point, use questions like these:
- Which drivers are growing fastest this month?
- Which issues are linked to negative sentiment most often?
- Which customer segments show the highest effort?
- Which themes appear in high churn-risk conversations?
- Which problems are frequent, painful, and fixable?
That's how you analyze customer experience data in a way that actually changes decisions.
Create one reporting layer for support and product
Support sees pain first. Product owns many of the fixes. The handoff between those teams usually breaks because the evidence gets watered down on the way over. A weekly summary isn't enough. A screenshot in Slack isn't enough either.
You need one shared language for what happened, why it happened, and how many conversations it affected. That means the reporting layer has to work for both operational review and strategic prioritization. In practice, that means tags, drivers, metrics, segmentation, and source evidence all living in one place.
We were surprised to find how often the failure isn't lack of effort. It's format mismatch. Support has stories. Product wants patterns. Leadership wants confidence. Good analysis bridges all three.
How Revelir AI Makes This Analysis Practical
Revelir AI makes it practical to analyze customer experience data by processing 100% of support conversations, turning them into structured metrics and tags, and linking every result back to the original tickets and quotes.
Full coverage changes the starting point
Revelir AI processes 100% of ingested tickets through Full-Coverage Processing, so your analysis doesn't begin with a sample and its built-in blind spots. You can bring conversations in through the Zendesk Integration for historical and ongoing tickets, or use CSV Ingestion for pilots, backfills, or exported data from systems like Intercom and Freshdesk.
That matters because the old cost shows up before analysis even starts. Manual review burns hours and still leaves uncertainty. Sampling looks efficient until someone asks whether the pattern is representative. Revelir AI removes that argument by analyzing the whole set, not a slice.
Structured signals and evidence stay connected
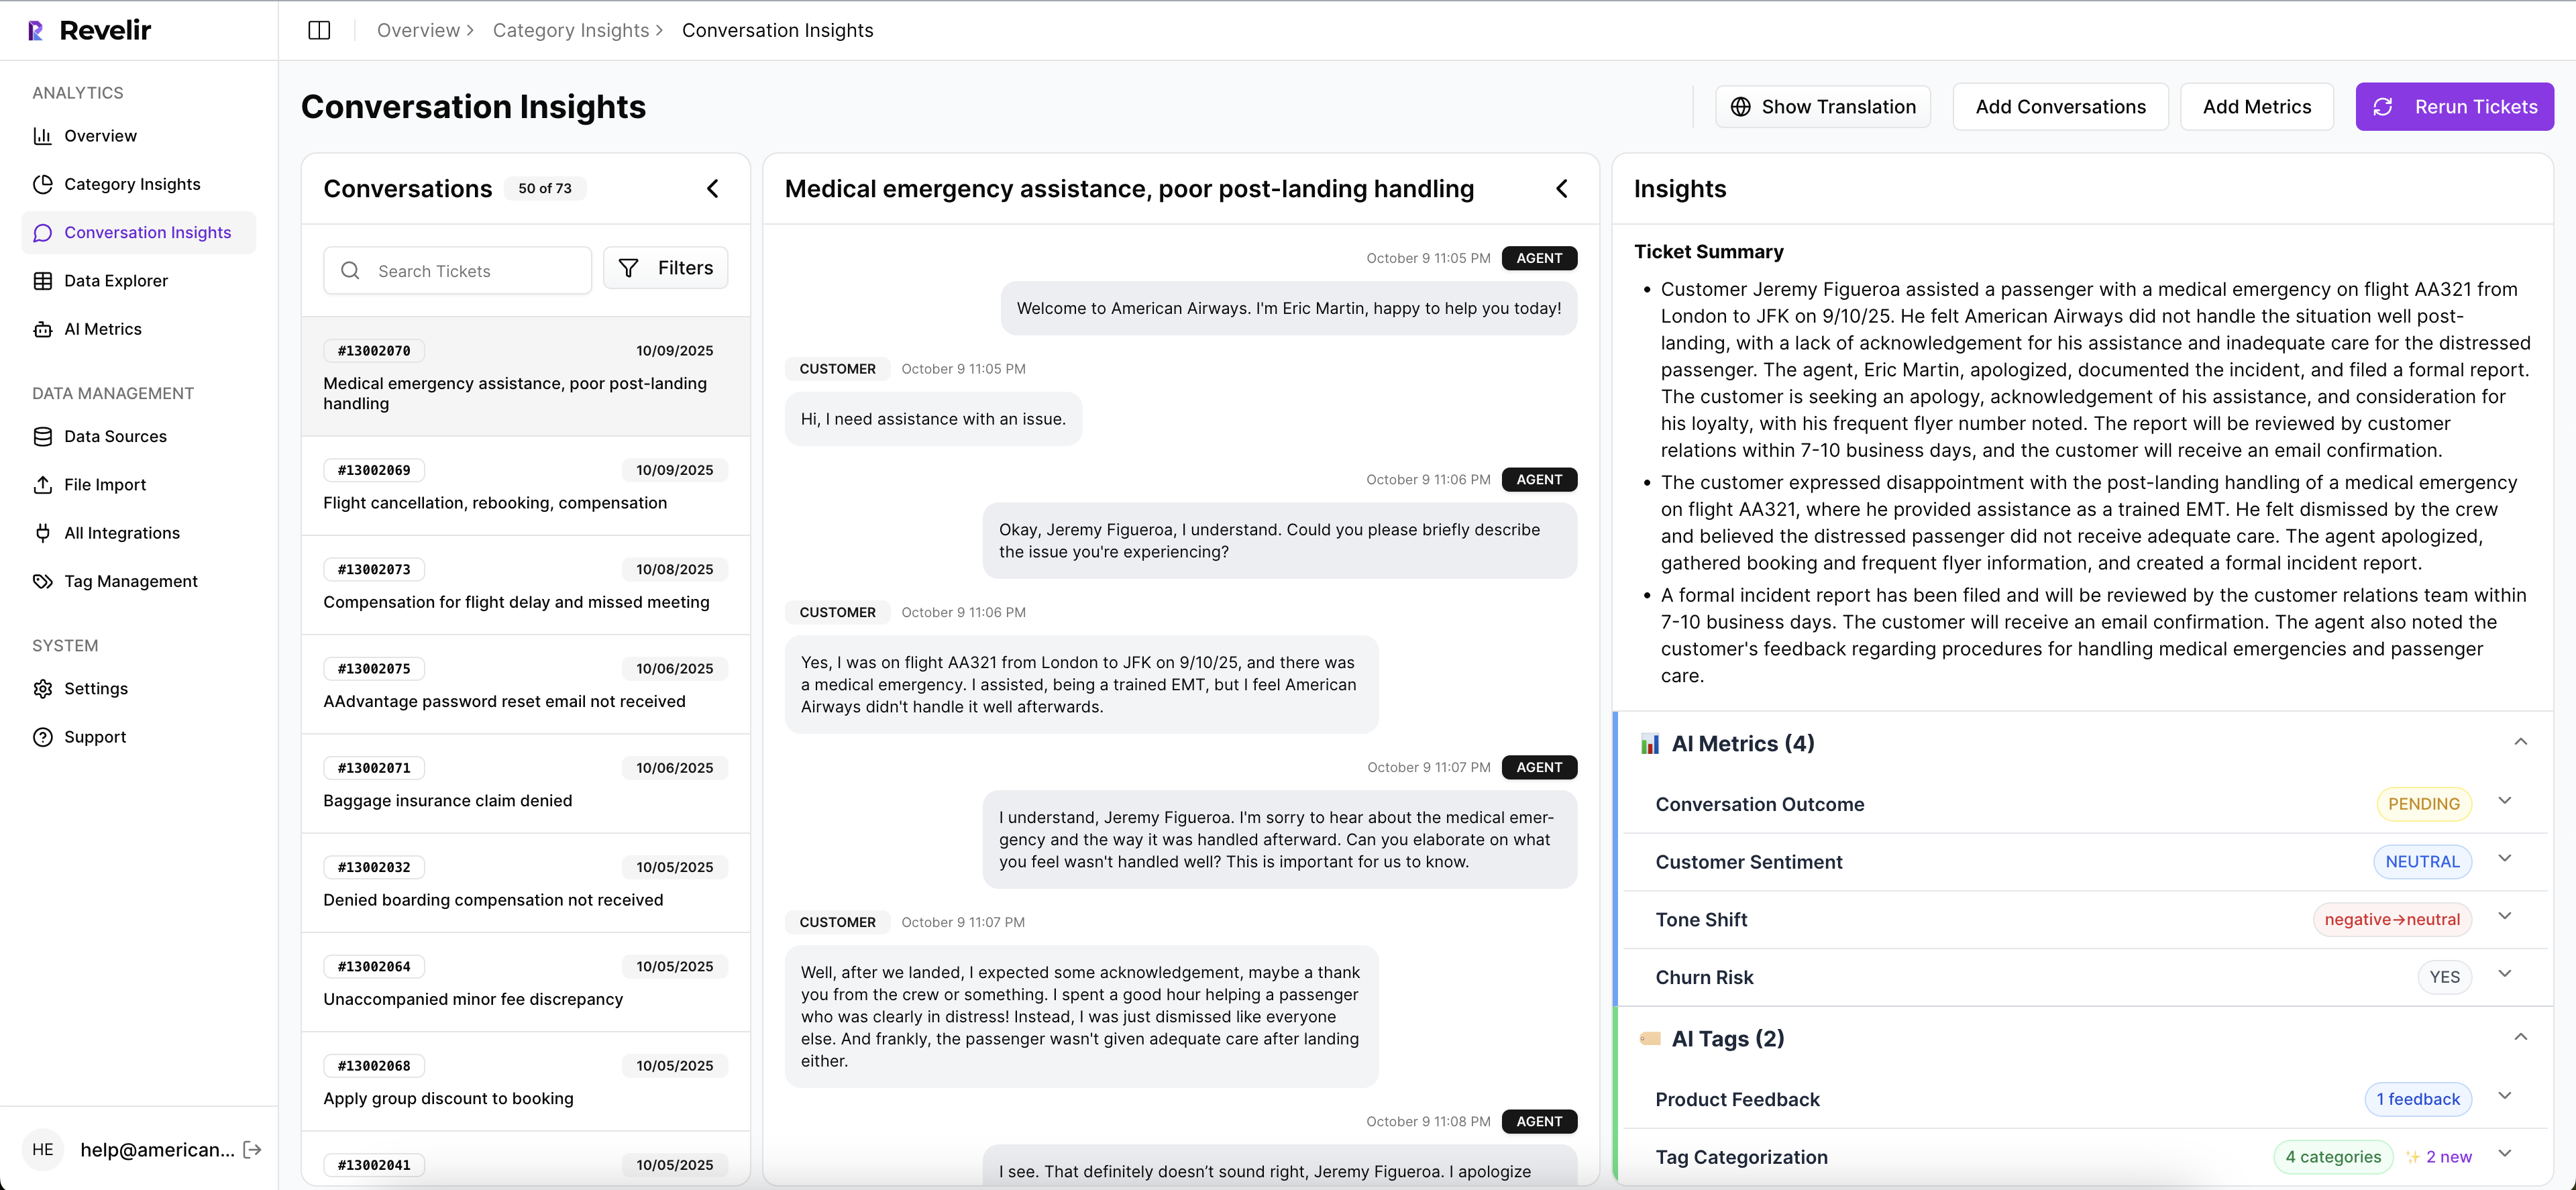
Once the conversations are in, the AI Metrics Engine adds structured fields like Sentiment, Churn Risk, Customer Effort, and Conversation Outcome. The Hybrid Tagging System adds Raw Tags for detailed issue discovery and Canonical Tags for cleaner reporting. Drivers then group those patterns into leadership-friendly themes so teams can move from what happened to why it happened.

This is where the product feels different in practice. Revelir AI doesn't stop at summary output. Evidence-Backed Traceability links every aggregate number back to the source conversations and quotes. Conversation Insights gives you ticket-level drill-down with transcripts, AI-Generated Summaries, assigned tags, drivers, and metrics so you can validate the pattern fast instead of defending a black box.
Analysis gets faster without turning vague
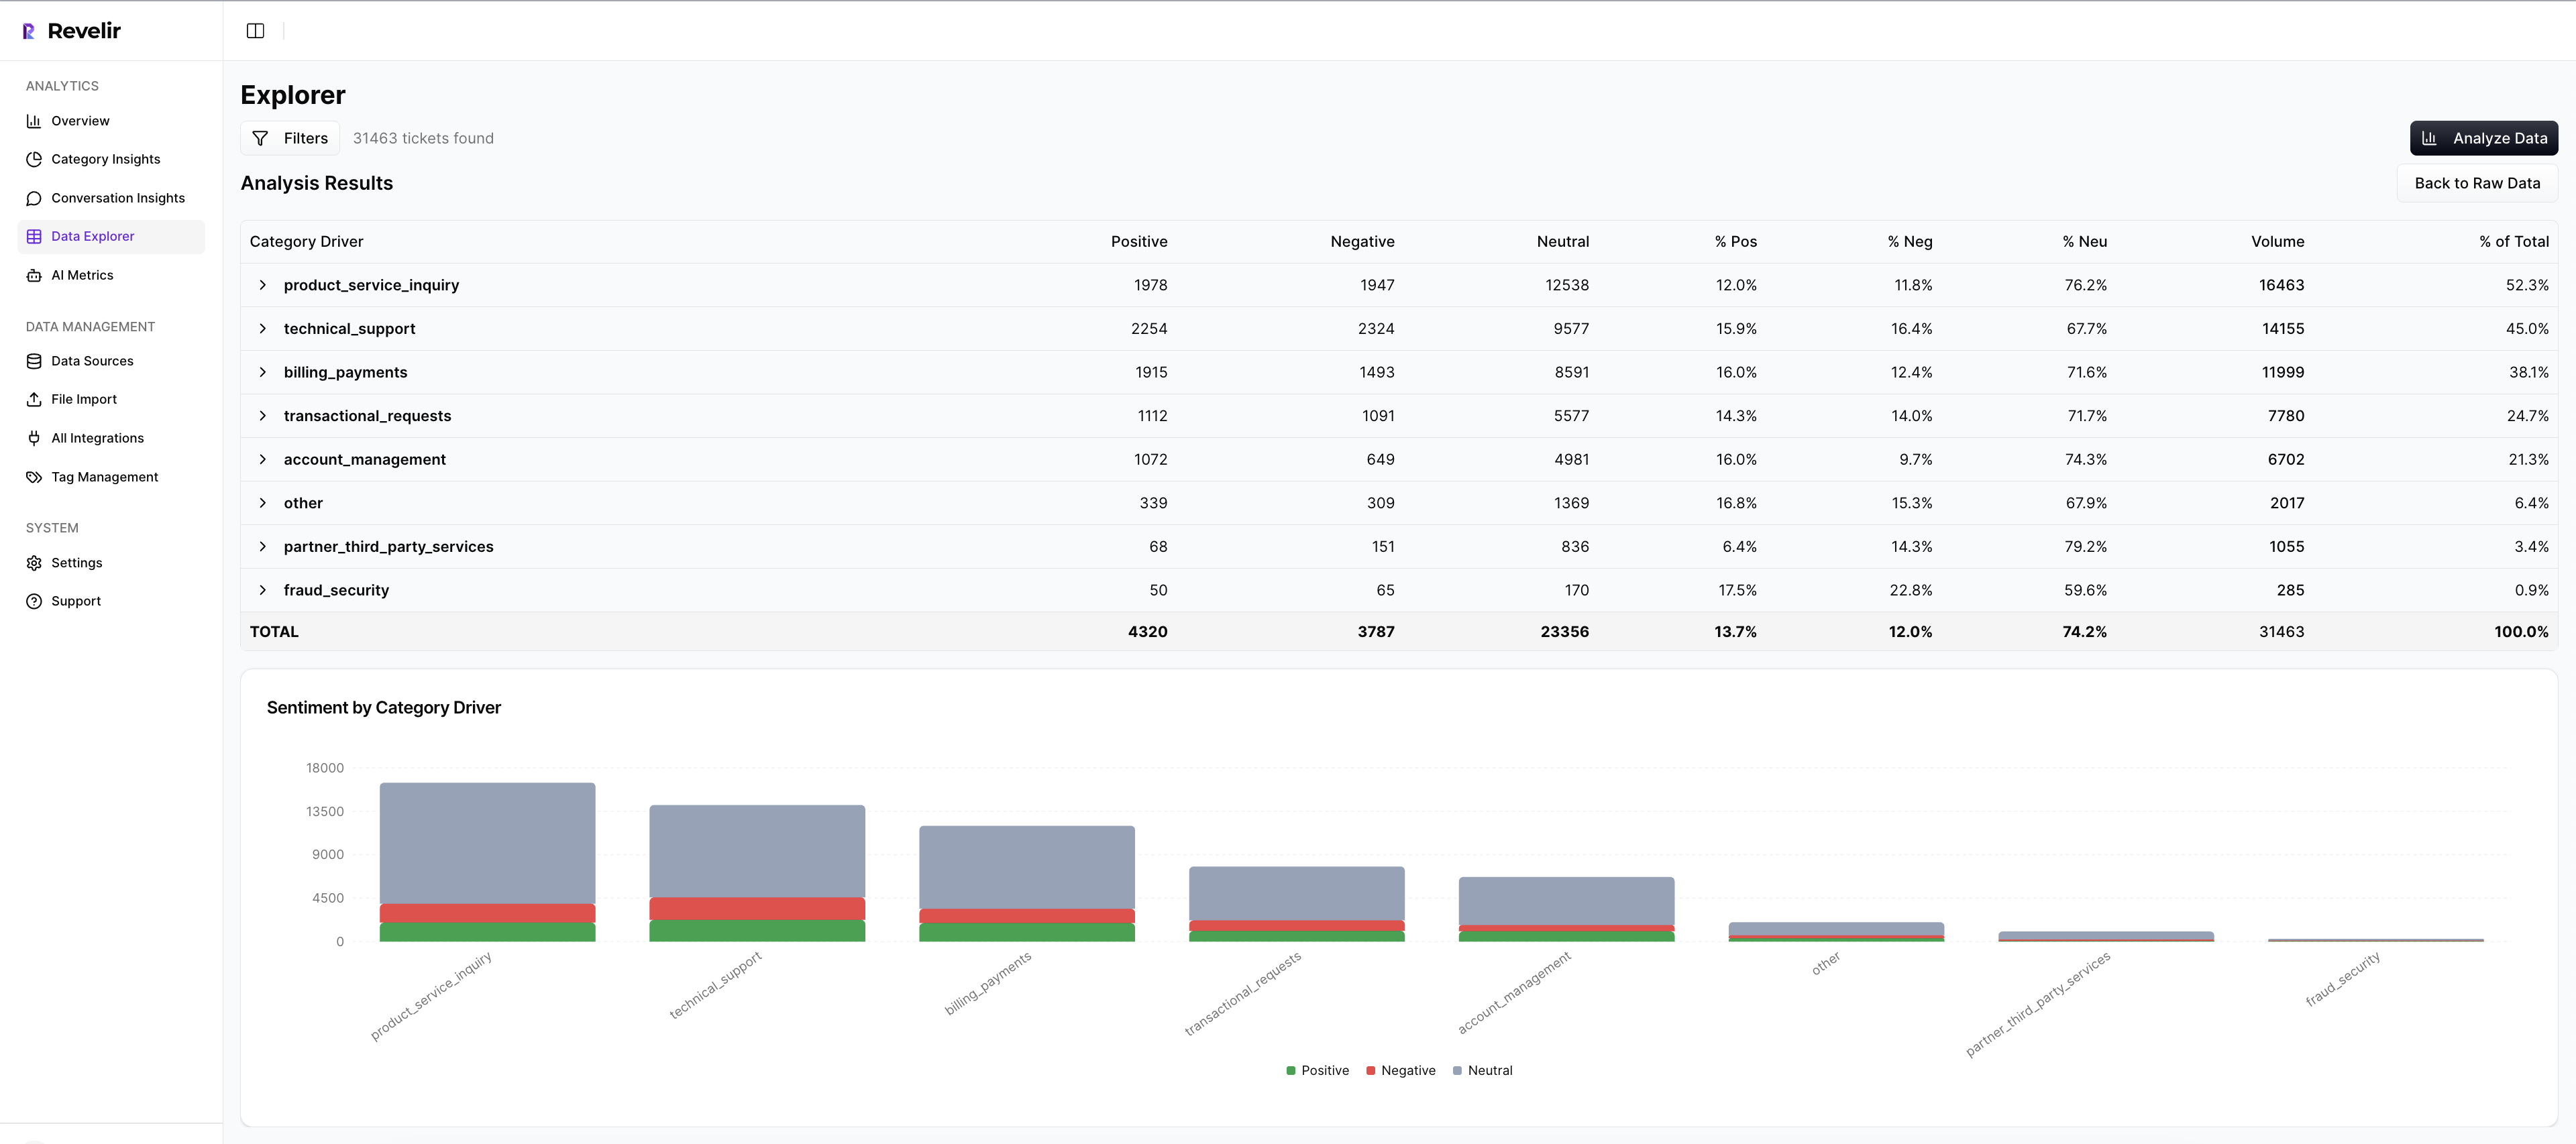
Data Explorer gives teams a pivot-table-like workspace to filter, group, sort, and inspect every ticket across sentiment, churn risk, effort, tags, drivers, and Custom AI Metrics. Analyze Data adds grouped analysis by dimensions like Driver, Canonical Tag, or Raw Tag, with interactive tables and stacked bar charts that connect back to the underlying tickets. And if your BI team needs the structured output elsewhere, API Export lets you move those metrics into existing reporting workflows.
Custom AI Metrics matter here too. If your business needs to analyze customer experience data around a specific question, like upsell opportunity, reason for churn, or a domain-specific operational issue, Revelir AI lets you define that in your own language instead of settling for a generic model. That's a big deal. It's usually the difference between a system people demo and a system people actually use.
Get Started With Revelir AI (Webflow)
A Better Standard for Customer Experience Analysis
To analyze customer experience data well, you need coverage, structure, and proof. Not just charts. Not just scores. The old way asks teams to trust partial views. The better way gives them evidence they can inspect and act on.
If you're tired of sampled reviews, weak explanations, and meetings where nobody agrees on the signal, start with the conversations themselves. Then build the metrics layer on top. Revelir AI is built for exactly that.
Frequently Asked Questions
How do I ensure complete coverage of customer conversations?
To ensure complete coverage, you can use Revelir AI's Full-Coverage Processing feature. This processes 100% of your ingested tickets, eliminating the bias that comes from sampling. You can connect Revelir AI to your support platform, like Zendesk, to continuously import historical and ongoing tickets. This way, you won’t miss any critical conversations that could signal underlying issues.
What if I want to analyze specific customer segments?
You can analyze specific customer segments using the Data Explorer feature in Revelir AI. This tool allows you to filter and group tickets based on various dimensions, such as sentiment, churn risk, and tags. By applying these filters, you can focus on the conversations that matter most to your analysis, helping you identify issues specific to different customer groups.
Can I create custom metrics for my analysis?
Yes, Revelir AI allows you to define Custom AI Metrics tailored to your business needs. You can create domain-specific classifiers, such as reasons for churn or upsell opportunities, and use these custom metrics in your analyses. This flexibility helps ensure that you’re capturing the specific insights that are relevant to your organization.
When should I validate my analysis against original tickets?
You should validate your analysis against original tickets whenever you notice a significant change in metrics or patterns. Revelir AI's Evidence-Backed Traceability feature enables you to link every aggregate number back to the source conversations and quotes. This validation step is crucial for maintaining trust in your insights and ensuring that your conclusions are based on solid evidence.
Why does my team need structured metrics for analysis?
Structured metrics are essential because they allow you to filter, group, and analyze data efficiently. Revelir AI transforms unstructured conversations into structured fields, such as sentiment and churn risk, making it easier to derive actionable insights. Without structured metrics, you risk relying on anecdotal evidence and sampling, which can lead to misinformed decisions.