

You want fewer debates and more shipped fixes. Same here. The fastest way to get there is to stop arguing about anecdotes and start from support tickets you can prove. Give product a driver, a cohort, and two or three quotes. Then test. If it’s not auditable in one click, it’s not ready.
It’s usually the simple gaps that cost you. Sampling instead of full coverage. Scores without drivers. Hypotheses that can’t be wrong. We’ve watched teams burn weeks on “possible” fixes because nobody’s checking the actual conversations. Let’s keep this tight and shippable.
Key Takeaways:
- Start with evidence you can prove, not a hunch
- Package drivers with quotes and a reproducible cohort
- Quantify waste from sampling, then remove it with full coverage
- Write falsifiable hypotheses with one primary metric and a guardrail
- Instrument experiments so outcomes tie back to the original tickets
- Use traceability to move execs from doubt to decision
From Support Tickets to Real Experiments, Not Opinions
Real experiments start when your inputs are verifiable. Aggregate drivers from 100 percent of conversations, attach representative quotes, and define a cohort you can reproduce. That gives you a clear “why,” a scope you can defend, and a fast path to a test. Opinions quiet down when evidence speaks.
Why Starting With Evidence Beats Intuition
You don’t need to kill intuition. You need guardrails around it. When a driver shows volume and severity, and the quotes show exactly where the workflow breaks, you cut through debate. In practice, that means you pivot by driver first, then click into tickets to collect examples that match the pattern. Do this, and you’ll stop shipping band‑aids and start shipping fixes that hold. For broader context on testing discipline, see this overview of product experimentation fundamentals.
Intuition still helps you spot opportunities, sequence bets, and shape UX. Evidence tells you whether it is the right hill to fight on. The combo reduces rework, shortens meetings, and gets engineering cycles pointed at the real problem.
What Is The Minimum Evidence To Start?
Keep the entry criteria simple. You need three things: a driver with volume and severity, two or three quotes that make the pain vivid, and a cohort you can reproduce with filters. That’s it. If you can’t link back to tickets in one click, you’re not ready to test.
A lightweight template travels well:
- Driver statement with metric context, for example “Billing fee confusion drove 34 percent of negative sentiment last 30 days”
- Cohort definition, including time window, plan tier, channel, and any exclusions
- Two or three quotes with ticket IDs and links
The Risk Of Optimizing Symptoms
Vague inputs create waste. If your only signal is a sentiment dip, you’ll tweak copy or publish more help docs while the real defect sits in a workflow. Anchor on drivers plus quotes to find the root cause. Ask which product behavior correlates with the driver, who feels it most, and where in the journey it shows up.
When you do that, experiments land faster and cleaner. Want a primer on turning fuzzy ideas into testable ones? This guide to writing product hypotheses is a helpful reference.
From Support Tickets to Root-Cause Signals, Not Score Watching
Scores show that something changed. Drivers tell you what to fix. Use full-coverage data to pivot sentiment, effort, or churn risk by driver, validate with drill downs, and package insights as driver statements with linked quotes. That format holds up in product reviews and budget rooms.

Drivers And Evidence Over Scores
A score alone is a red flag without a plan. Pair it with drivers and quotes, and you get a story you can act on. Start broad, then refine: pivot sentiment by driver, isolate the top offenders, and open the tickets behind them. If the examples match the pattern, you’ve got something real. If they don’t, adjust before you pitch a fix.
Package the finding the way leaders think: “In the last 30 days, 40 percent of negative sentiment in onboarding came from account access loops. Here are three examples.” That sentence moves work.
How Do You Preserve Traceability To Quotes?
Make traceability non‑negotiable. Every chart should click into the exact tickets that produced it. In practice, that means stable ticket IDs, drillable analysis, and briefs with embedded links. If an insight can’t be audited in one step, it’s a trust risk.
When traceability is default, the conversation changes. PMs stop asking “where did this come from” and start asking “what will we change first.” For teams formalizing this habit alongside planning, a hypothesis‑driven strategy workflow is a good mental model.
Evidence Or It Does Not Happen: Quantifying The Waste
Sampling, recency, and escalation bias distort your inputs and slow decisions. The cost is not only time, it is missed risk and wrong priorities. Full coverage with click‑through evidence removes representativeness debates and catches quiet patterns early. When the source is one click away, meetings get shorter and plans get sharper.
The Sampling Cost You Cannot Ignore
Let’s pretend you handle 1,000 tickets a month. Reviewing 10 percent at three minutes each costs five hours, and you still risk missing the churn signal. Reviewing 100 percent at that pace hits 50 hours, which nobody has. Meanwhile, the 90 percent you didn’t read can hide the real driver.
This is where teams lose days. They argue about representativeness and miss slow‑burn problems. Full coverage eliminates that waste. You get the complete picture, then slice by cohort to stay specific.
The Rework Spiral After Wrong Fixes
Ship the wrong fix and you pay three times. First in engineering hours, then in new tickets, then in leadership trust. When the insight isn’t tied to conversations, debates sprawl and escalate. A driver backed by quotes short circuits that spiral. It narrows the scope, trims the brief, and pulls the right fix forward.
If you want a way to break big ideas into testable chunks before you spend cycles, this take on breaking down hypotheses is simple and practical.
What Does Bias Do To Your Metrics?
Bias sneaks in fast. Sampling favors the loudest account. Recency overweights last week’s fire. Escalations overshadow slow‑burn churn risks. Guard against this with full coverage, fixed windows, and pre‑defined cohorts. Then verify that grouped results match real transcripts. If the examples feel off, adjust before you test.
Discipline here prevents wasted sprints and frustrating rework. It also builds credibility with leaders who have learned to be skeptical of dashboard‑only claims.
What It Feels Like To Ship Fixes Without Proof
Weak inputs create a real emotional tax. You feel it in late‑night rewrites, in defensive meetings, in the slow leak of trust. Flip the inputs, and the room shifts. When the evidence is one click away, people stop questioning the premise and start asking how to help.
The 11 PM Rewrite Moment
You’re rewriting a release note at 11 pm because the fix didn’t land and the feedback is vague. It’s demoralizing. Replace it with a small, defensible packet: driver, cohort, two quotes, metric trend. Share the tickets and the exact moments where the workflow failed. Now the rewrite is a decision, not a guess.
The difference is night and day. Engineers see the source. Design sees the language customers used. You get alignment without a fight.
Why Your Executive Loses Trust
Executives don’t ignore problems. They ignore slides without proof. Volume trends and CSAT alone invite second‑guessing. Bring drivers with quotes, and the posture changes. You’re not asking for faith. You’re bringing receipts.
Then the next question is the right one: “What will change the metric within this cohort fastest” That’s where you want to be.
How It Feels When The Evidence Is One Click Away
The room gets quiet. You say “here are the tickets behind this spike” and “here are the moments where the flow broke.” People nod. They stop debating whether the problem is real and start planning the fix. That’s momentum. Build a habit around it.
If you want a quick mental model catalog to sharpen this muscle, skim a primer on mental models for product managers. Pick one, pair it with evidence, and ship.
From Support Tickets to Testable Hypotheses: A 5-Step Protocol
Evidence‑first doesn’t have to be heavy. Use a simple, repeatable protocol to move from support tickets to experiments that change behavior. Define scope, extract drivers and quotes, frame falsifiable hypotheses, design a traceable test, then validate outcomes against the original conversations. That rhythm prevents waste and protects roadmap capacity.
Step 1: Define Scope And Cohorts
Start narrow. Fix your time window, segment, and channel. Think last 30 or 60 days, new customers on Standard plan, web channel only. Document exclusions too. This reduces bias, makes replication easy, and keeps comparisons honest.
Write the cohort so anyone on your team can recreate it with filters. If the cohort can’t be reproduced, refine before you proceed. Clarity here saves hours later.
Step 2: Extract Drivers And Evidence
Run grouped analysis on sentiment, effort, or churn risk by driver or canonical tag. Identify top contributors, then click through to pull two or three representative quotes. Save the ticket IDs alongside the driver statement. This becomes your evidence pack.
It proves the problem exists and seeds your experiment language. Nobody argues with the words customers actually used. Same thing with churn mentions and frustration cues, they’re hard to ignore when you can show them.
Step 3: Frame Measurable Hypotheses
Convert drivers into a falsifiable statement. Use this pattern: Because [driver] affects [cohort], we believe [change] will move [metric] by [effect size] within [duration]. Choose one primary metric and a guardrail, for example effort should not increase. If it can’t be wrong, it’s not a hypothesis.
Keep it simple enough to explain in a sentence. If you need a refresher on structure, these notes on product hypotheses are a good starting point.
Step 4: Design Experiment And Instrumentation With Built-In Traceability
Select control and treatment from the same cohort to avoid selection bias. Instrument your primary metric and guardrail, and log the ticket IDs that inspired the test in your tracking doc. Add telemetry to capture exposure, key events, and outcomes. Define stop rules before launch.
Include a short pre‑mortem. List sampling, recency, and escalation risks with how you’ll mitigate them. You’ll prevent common mistakes and protect confidence in the readout.
Step 5: Run, Link Back, And Validate Outcomes
Launch, monitor basic checks, and wait for your planned duration. Analyze lift with the method you agreed on. Then link outcomes to the original support conversations. Did the quotes describe behavior the metrics changed? If not, iterate the hypothesis or the slice.
Archive the packet so future teams can audit the chain from problem to proof. That library compounds. It also helps new teammates learn faster.
Want to run this protocol on your data? See How Revelir AI Works.
How Revelir AI Takes You From Support Tickets to Traceable Experiments
Revelir AI turns raw conversations into evidence‑backed metrics with 100 percent coverage and click‑through traceability. You slice by cohort, pivot by driver, and drill into the exact tickets behind any chart. That removes representativeness debates, catches quiet patterns early, and speeds the jump from insight to test.
Evidence-Backed Metrics And 100 Percent Coverage
Revelir AI processes every conversation automatically, no sampling. Each ticket gets AI metrics like Sentiment, Churn Risk, and Customer Effort, plus raw tags, canonical tags, and drivers. Because every aggregate links back to source conversations, you can audit findings in one click.

That traceability addresses the biggest trust gap. When someone asks “show me,” you open the transcript. Debates shrink. Decisions speed up.
Data Explorer, Analyze Data, And Conversation Insights Working Together
Data Explorer is where you work day to day. It feels like a pivot table for tickets. Filter by time window, plan tier, channel, or driver. Click Analyze Data to group metrics by driver or canonical tag. Then click any cell to open the tickets in Conversation Insights, where you’ll see full transcripts, AI summaries, tags, and metrics.

This is your repeatable path from cohort selection to driver extraction, without spreadsheets. What used to take hours across exports now takes minutes, and the selections are reproducible. Evidence stays attached to the metric, so your brief is audit‑ready.
3 to 5 features that matter most:
- Bold coverage, real confidence: Full‑population processing so you don’t miss hidden churn risks or quiet frustration patterns
- Bold drivers with quotes: Metrics you can pivot across drivers and canonical tags, with linked examples for fast validation
- Bold drill‑down on demand: Conversation Insights shows the transcript, summary, tags, and metrics for any ticket you click
- Bold flexible ingestion: Connect Zendesk for ongoing syncs or upload CSVs to backfill history and start fast
- Bold custom AI metrics: Add business‑specific metrics so your dashboard speaks your language
Evidence in minutes. That’s what Revelir delivers. Learn More.
With this setup, you also protect against the waste you quantified earlier. Sampling cost disappears because every ticket is analyzed. Rework shrinks because drivers and quotes remove guesswork. And meeting friction drops because stakeholders can check the source in seconds instead of debating slides.
Revelir’s job is not to replace your helpdesk. It sits on top of it, turns messy text into measurable signals, and keeps the evidence one click away. Then you do the part only humans can do, prioritize, design, and ship.
Ready to grab quotes directly from the source and move faster on fixes? Get Started With Revelir AI (Webflow)
Conclusion
If your goal is fewer arguments and more shipped fixes, start from evidence you can prove. Full coverage, drivers, and quotes give you inputs you don’t have to defend. Then run a tight, falsifiable hypothesis with traceability baked in. You’ll cut waste, protect roadmap capacity, and feel the room shift toward action.
Frequently Asked Questions
How do I connect Revelir AI to my helpdesk?
To connect Revelir AI to your helpdesk, you can either integrate it directly with Zendesk or upload your ticket data via CSV. If you're using Zendesk, simply follow the prompts to link your workspace, and Revelir will automatically import historical tickets and ongoing updates. For CSV uploads, export your tickets from your helpdesk, then go to the Data Management section in Revelir and select 'File Import' to upload the CSV. This process ensures that all your support conversations are analyzed, providing you with actionable insights in minutes.
What if I need to analyze specific customer segments?
You can easily analyze specific customer segments using the Data Explorer in Revelir AI. Start by applying filters based on customer attributes like plan type or account status. For example, filter by 'Plan = Enterprise' to focus on high-value customers. After filtering, use the 'Analyze Data' feature to group by metrics like sentiment or churn risk. This will help you identify trends and issues specific to those segments, enabling you to tailor your support and product strategies effectively.
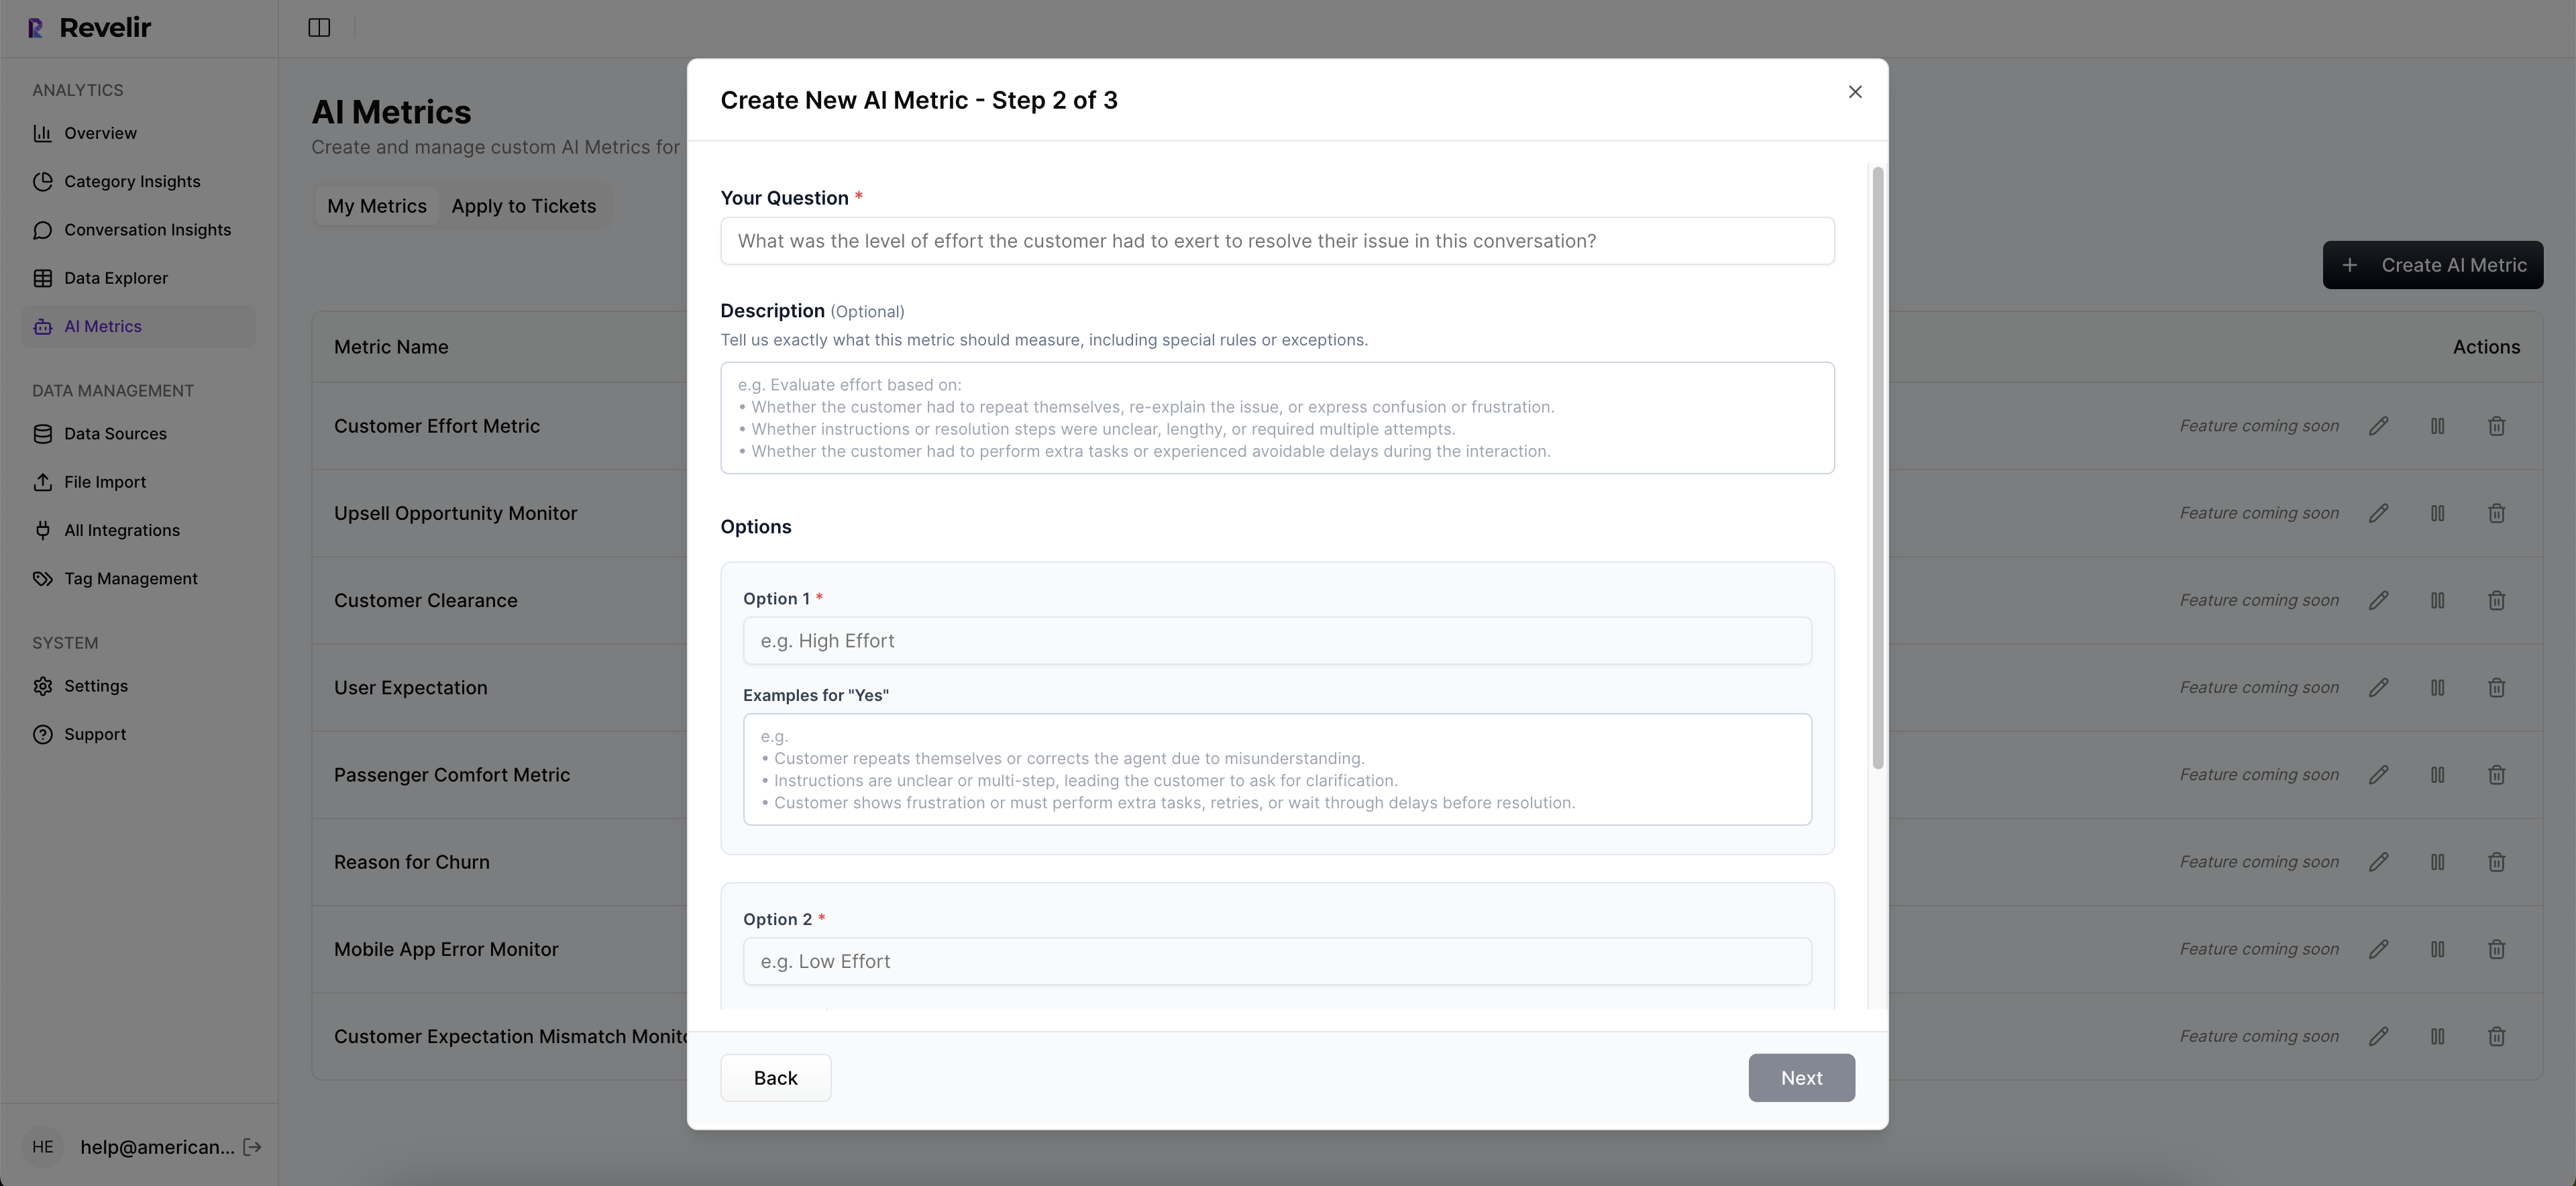
Can I customize the metrics in Revelir AI?
Yes, you can customize metrics in Revelir AI to match your business needs. You can define custom AI metrics that reflect your specific terminology, such as 'Upsell Opportunity' or 'Reason for Churn.' To set this up, navigate to the metrics configuration section within Revelir and specify the parameters for your custom metrics. This flexibility allows you to capture the unique signals that matter most to your organization, making your insights more relevant and actionable.
When should I validate insights with Conversation Insights?
You should validate insights with Conversation Insights whenever you identify a significant trend or anomaly in your data. For instance, if you notice an increase in churn risk or negative sentiment, click into the relevant metrics in the Data Explorer to access the underlying tickets. Reviewing these conversations will help you confirm that the metrics align with the actual customer experiences. This step is crucial for ensuring that your decisions are based on accurate, real-world evidence rather than assumptions.
Why does Revelir AI emphasize full coverage processing?
Revelir AI emphasizes full coverage processing because it analyzes 100% of your support conversations, eliminating the biases and delays associated with sampling. By processing every ticket, you gain comprehensive insights into customer sentiment, churn risk, and operational issues. This approach allows you to detect early signals that might be missed otherwise, ensuring that your product and support teams can make informed decisions based on complete data rather than partial views.