

Most support orgs can show a chart. Fewer can prove where the number came from. If leadership asks, “Which tickets back this up?” and you cannot click to the quote, you lose the room. That’s the gap an event-sourced support pipeline closes. Model every ticket, message, tag change, and AI verdict as events. Keep lineage safe and obvious. Then numbers stop being fragile opinions and start being evidence.
It’s usually not about more data. You already have plenty. The problem is traceability, reprocessing, and trust. When metrics are derived from immutable events, you can replay safely, fix taxonomy mistakes without side effects, and point from any bar on a chart to the exact conversations. That’s how reviews shift from defense to decisions.
Key Takeaways:
- Build metrics from immutable events so every number carries evidence back to tickets and quotes
- Keep events compact, versioned, and idempotent to avoid drift and double counts
- Separate raw AI tags from canonical tags, then map with versioned events you can replay
- Store lineage pointers in every aggregate so you can click from chart to conversation
- Reprocess safely when definitions change and verify with reconciliation jobs, not guesswork
- Stop sampling, process 100 percent of tickets, and make traceability a default
Stop Trusting Opaque Aggregates: The Event-Sourced Support Pipeline Pays Off
An event-sourced support pipeline restores trust because every metric links to the immutable events that produced it. You avoid sampling bias, preserve full lineage, and can reprocess safely when taxonomies evolve. Leaders ask “why,” and you open the ticket and quote in seconds. The conversation changes from debate to action.

Dashboards Without Lineage Lose The Room
If a CFO asks where a spike came from and nobody can click to a ticket, skepticism spikes faster than your chart. That is the credibility cost of black-box ETL. Aggregates that hide inputs invite doubt, slow approvals, and push teams into anecdote wars. Evidence-first design fixes this without adding manual review overhead.
In practice, this means building from events, not mutable rows. Each ticket_created, message_appended, or ai_metric_emitted carries a strong ID and minimal payload. Aggregates become rebuildable views, not the source of truth. When someone asks “show me,” you move from bar chart to transcript in one click, then right back to metrics with context intact.
The difference is visible on day one. People stop arguing about sample representativeness and start asking which fix to ship. You aren’t chasing audit trails during prep. You are showing work, which builds confidence. It is small, but it compounds.
Materialized Views With Pointers Change Behavior
Materialized views are valuable, but only when they carry their lineage. Store both the metric and its pointer set: event_ids, ticket_ids, and the message offsets for any quoted text. That way, leaders can check the exact words that led to the number. Nobody’s guessing. Nobody’s checking screenshots after the meeting.
This pointer set also pays off during change. New taxonomy? Replay. New metric threshold? Replay. Since events are immutable and idempotent, you regenerate the same truth with updated logic and avoid double counting. If you need a primer on why this approach works, Martin Fowler’s write-up on Event Sourcing covers the core mechanics clearly.
Rethink Tickets As Events: Designing An Event-Sourced Support Pipeline Model
Design the pipeline around a small, explicit event vocabulary and strict identity. Keep events immutable and versioned. Put only derived, current-state values in aggregates, then attach lineage pointers. When definitions shift, you replay with confidence. That is how you keep numbers stable while your taxonomy evolves.

Canonical Event Vocabulary That Stays Small
Start with clear types: ticket_created, message_appended, tag_applied, tag_removed, tag_mapped_canonical, ai_metric_emitted, ticket_resolved. Each event is append-only and self-sufficient. Add message offsets or quote spans so you can show the exact sentence behind a metric later without guesswork.
Avoid shoving derived fields into events. That data will drift. Put the minimum payload needed to recompute state and metrics. When you need a refresher on event-sourced modeling patterns, the Introduction to Eventsourcing guide is a solid reference.
Identity, Sequencing, And Idempotency Keys
Events need globally unique event_ids, monotonic sequence numbers per ticket, and timestamps. Include producer and event_version for safe evolution. Add correlation_id when messages cross systems. Use idempotency keys so replays do not create duplicates. Get this wrong and you will spend weekends reconciling subtle, costly inconsistencies.
What does this look like in real life? Let’s pretend you backfill six months of Zendesk data. With stable IDs and idempotency keys, you can replay as often as needed to refine your taxonomy. Without them, you waste hours on brittle cleanup scripts and you still wonder if your aggregates are off by two percent.
The Hidden Cost Of Skipping An Event-Sourced Support Pipeline
Skipping event sourcing looks faster, until reprocessing breaks counts, sampling misses signals, and nobody can prove a claim in a review. The costs show up as lost time, misprioritized roadmaps, and slow decisions. One fix with evidence beats three meetings without it.
Reprocessing Debt Shows Up As Lost Weekends
Let’s pretend you shipped a new mapping for “onboarding friction” and need to backfill. Without idempotent upserts and event versioning, you risk double counts or stale rollups. The compute cost is minor. The trust cost is real. Analysts hesitate to touch anything because every change might break downstream BI.
That hesitation compounds. Teams learn to live with wrong numbers to avoid risk. Roadmaps drift. Reporting becomes a ritual nobody believes. You do not want that culture. You want safe change.
Sampling And Opaque Models Create Risk
Sampling feels efficient. It fails when accuracy matters most. If you handle 1,000 tickets, reading 10 percent at three minutes each still eats five hours for a partial view that can miss churn signals. Black-box classifiers with no lineage make it worse. You cannot explain “churn risk is up” or show which drivers are wrong. You lose weeks to skepticism.
You do not need to guess here. Build the pipeline so every aggregate can be traced and recomputed. Tools exist to help with persistence patterns for events; the EventsourcingDB documentation outlines common store and replay approaches if you want a deeper dive.
What It Feels Like Without Traceability
It feels like late-night rework, audit panic, and meetings where you stall. Evidence is what calms the room. When metrics link to transcripts and quotes, teams stop arguing about whether a pattern is real and start fixing it.
Late-Night Fixes And Moving Targets
You tweak a taxonomy at 10 pm and dashboards shift. Now you worry about BI rollups, board decks, and angry stakeholders in the morning. Without idempotent reprocessing and stored lineage, even small corrections are risky. You dread change, which means you accept known errors longer than you should.
It is rarely a single mistake. It is the slow bleed of uncertainty. People start copying numbers into slides as screenshots to “lock them.” That workaround is a signal your pipeline design is wrong. Fix the design, not the screenshot.
You Versus The Room During Reviews
You say “Billing drivers spiked,” someone asks “Why.” You scroll, stall, and lose momentum. Confidence does not come from louder opinions or more bars. It comes from three representative quotes that match the metric. People remember stories, not pivot tables. When you can click from a number to a transcript, the debate ends and the work begins.
Same thing with product prioritization. A PM hears the customer’s words, recognizes the friction, and agrees to the fix. Without that proof, you risk rework and another week of debate.
Build The Event-Sourced Support Pipeline The Right Way
Build from immutable events, treat AI outputs as first-class records, keep aggregations idempotent, and make lineage visible. Then add reconciliation so you catch drift early. This is not hype. It is a handful of design choices that prevent real, expensive problems.
Ingest With Immutable IDs And Correlation
Pull historical exports and stream updates with stable ticket_ids. Normalize producers, attach correlation_ids, and write to an append-only log. Capture message_appended with author, timestamp, and offset spans for quote extraction. Never mutate old events. If a correction is needed, emit a new event that supersedes the prior one by version.
These basics protect you later. They allow replay, they make merges predictable, and they ensure every chart has a path back to text. If workflows cross systems, process managers can coordinate long-running flows; see Process Managers in Event Sourcing for patterns that keep state machines honest.
Make Aggregations Idempotent And Rebuildable
Aggregations should be materialized views keyed to deterministic IDs, not fragile tables. Store lineage pointers with each row so you can verify fast. Then schedule reconciliation: periodically recompute a sample from events and compare to stored aggregates. Alert on drift before it becomes a leadership problem.
To anchor this, follow a simple cadence:
- Define deterministic keys that include ticket_id and relevant version fields.
- Write aggregations with upserts that are safe to replay.
- Store the event_id set used to produce each row.
- Run daily sampling to compare recompute versus stored values.
After you implement these steps, reprocessing is routine, not risky. The numbers hold up even when definitions evolve.
How Revelir AI Operationalizes The Event-Sourced Support Pipeline
Revelir AI processes 100 percent of conversations, emits structured metrics, and links every chart back to the exact tickets and quotes. Data Explorer lets you pivot like a purpose-built table, then jump to transcripts for context. When definitions change, you keep consistency because evidence is always a click away.
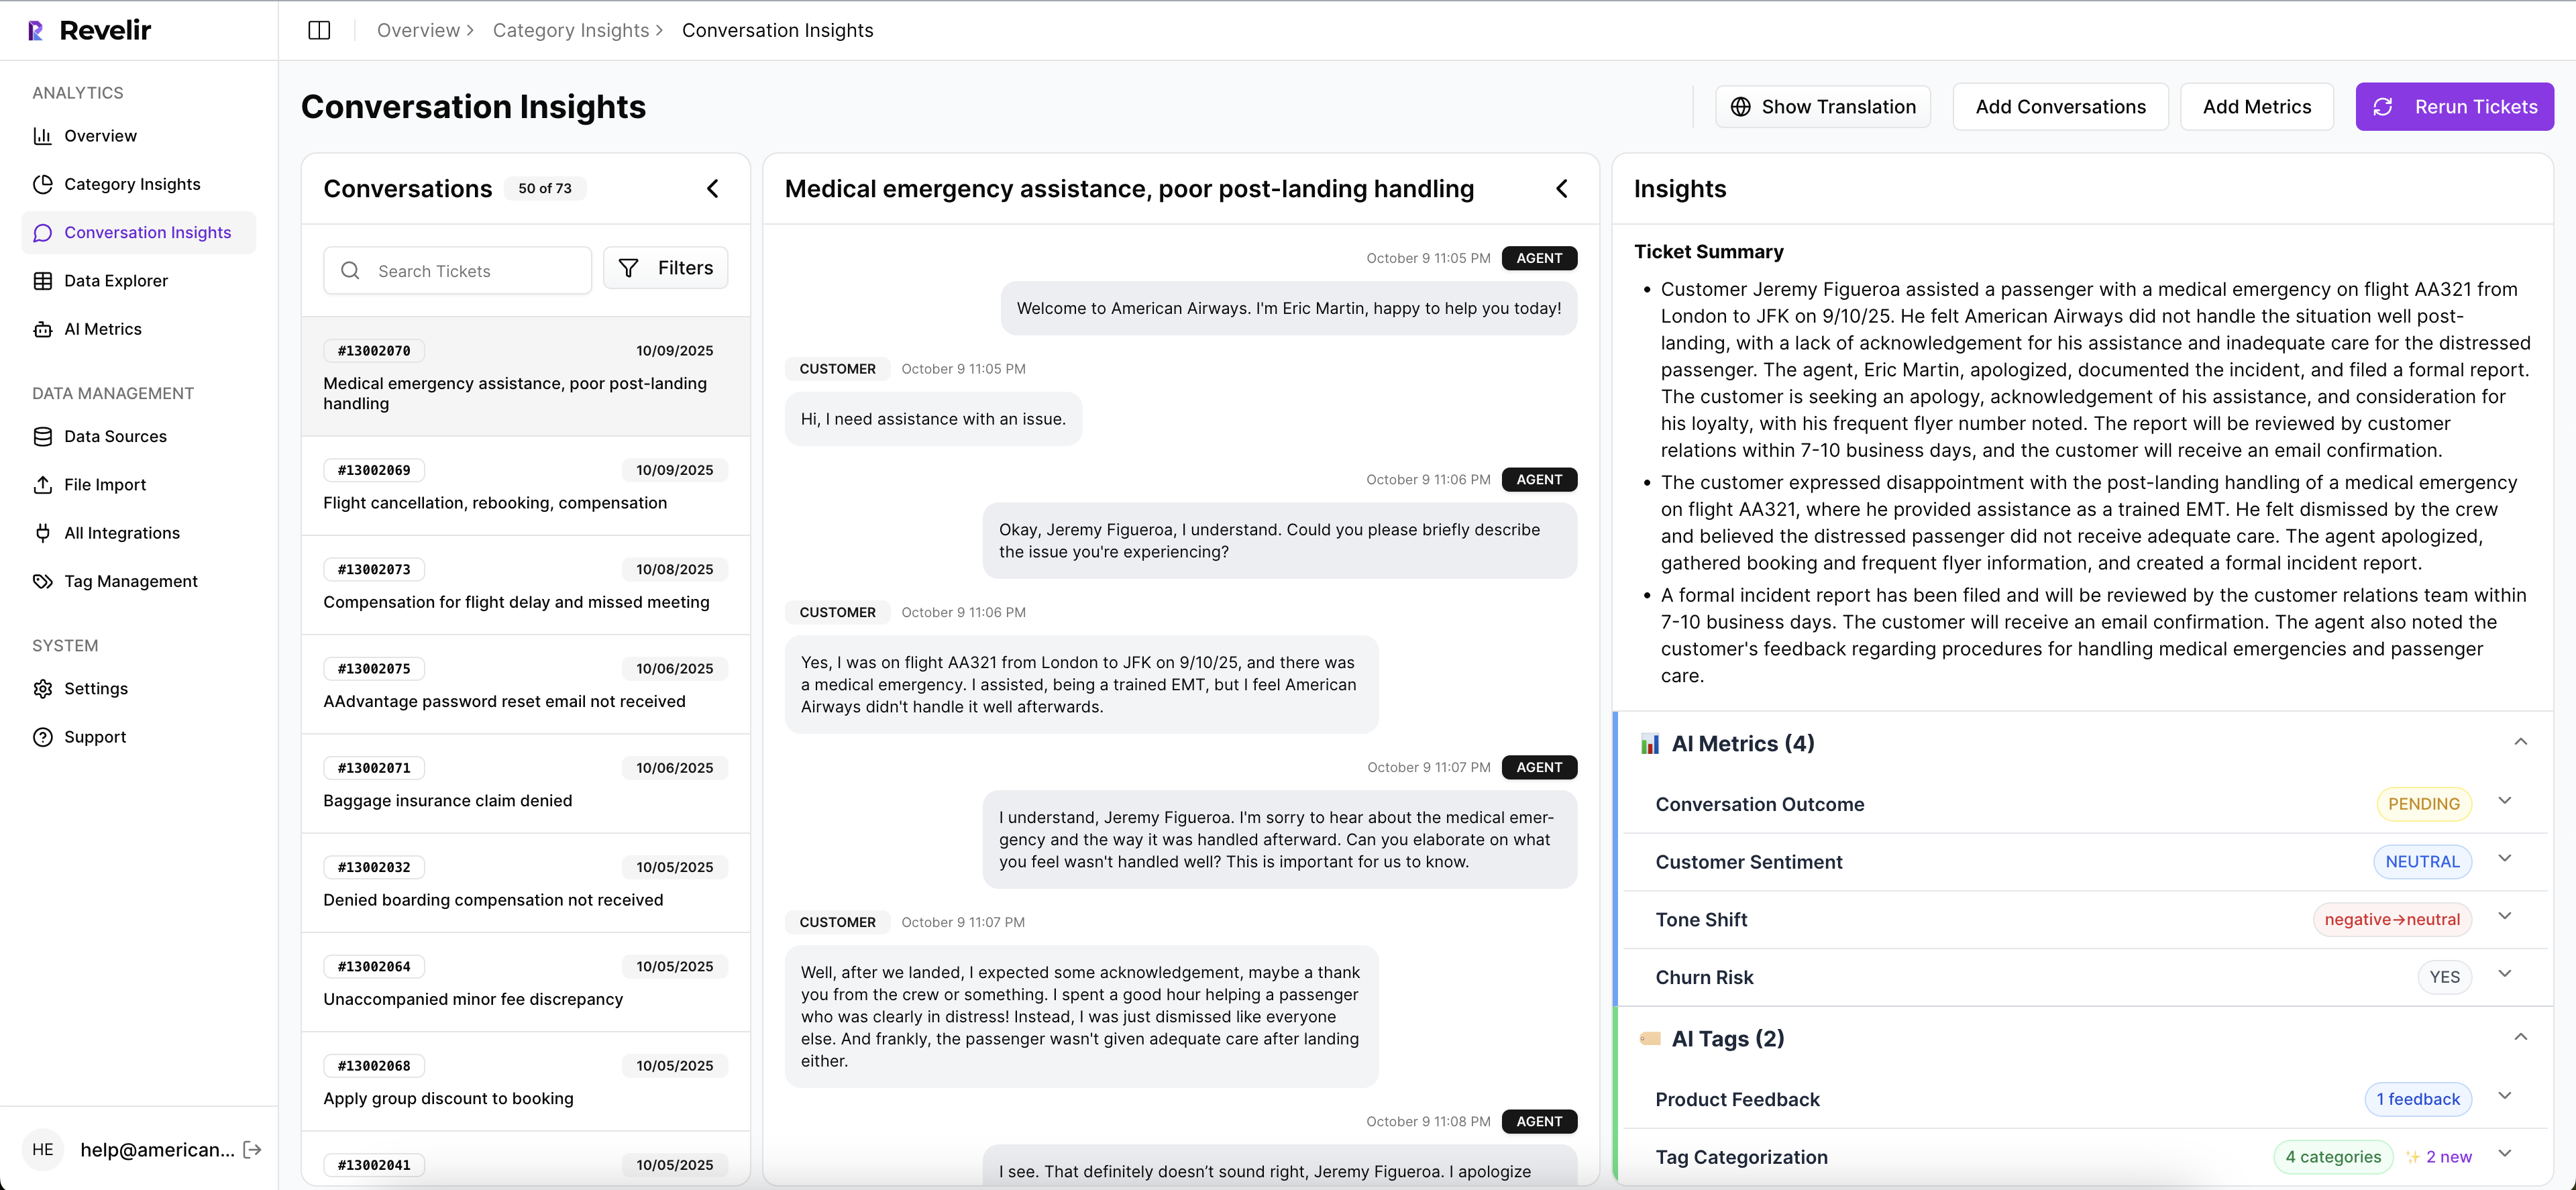
Full Coverage With Click-Through Evidence
Revelir analyzes every ticket automatically, not a sample, so you avoid bias and detect early signals. From any metric slice, you can open Conversation Insights to see the transcript, AI summary, tags, and the quotes that generated the number. When someone asks “show me,” you have proof, not a guess.
This is where credibility returns. You stop stitching example docs before reviews. You click from the bar to the ticket. You can even export metrics via API to bring structured fields into your reporting without losing traceability. It is a small change in workflow with a big trust payoff.
Hybrid Tags, Drivers, And Metrics That Align
Revelir emits sentiment, churn risk, and customer effort, plus any custom AI Metrics you enable. It also supports a hybrid taxonomy: AI-generated raw tags for discovery, canonical tags for clarity, and drivers for leadership reporting. Definitions evolve, but the lineage stays intact, so you can replay and refine without losing history.

That hybrid setup mirrors the event-sourced approach. Raw signals capture nuance. Canonical mappings create stable categories. Drivers roll it up to language your executives expect. Nobody is hand-waving. The mapping is visible and consistent.
Data Explorer And API For Evidence-First Reporting
Revelir’s Data Explorer behaves like a pivot table for tickets. Filter by sentiment, churn risk, effort, canonical tags, or drivers. Run grouped analyses to answer “what’s driving negative sentiment” or “which issues affect high-value customers.” Then click counts to drill into real conversations and validate the pattern.

In short, Revelir operationalizes the design choices above:
- Evidence-backed traceability: every metric links to tickets and quotes you can audit
- Full-coverage processing: 100 percent of conversations, no sampling, no blind spots
- Hybrid taxonomy: raw tags for discovery, canonical tags and drivers for clarity
- Data Explorer and Analyze Data: fast grouping, drilling, and validation for daily work
Ready to move from sampling and screenshots to evidence you can defend? Get Started With Revelir AI (Webflow)
Full-population insights in minutes. That is what teams want when the room asks for proof. Learn More
Conclusion
Opaque aggregates drain trust and slow decisions. An event-sourced support pipeline reverses that by anchoring every metric to immutable events and storing the pointers that prove the claim. Build it once, reprocess safely, and make evidence visible by default. If you want that proof on tap, don’t change your stories. Change the way you produce the numbers.
Frequently Asked Questions
How do I connect my helpdesk to Revelir AI?
To connect your helpdesk to Revelir AI, start by accessing the integration settings in your Revelir account. You can connect directly to platforms like Zendesk by following the prompts to authorize the connection. If you prefer, you can also upload past tickets using a CSV file. Just export your tickets from your helpdesk, then go to 'Data Management' in Revelir and select 'File Import' to upload your CSV. This way, you can start analyzing your support conversations quickly.
What if I need to customize AI metrics in Revelir?
You can easily customize AI metrics in Revelir to match your business needs. Go to the metrics configuration section of your account, where you can define new metrics that reflect specific aspects of your customer interactions, such as 'Upsell Opportunity' or 'Customer Effort.' Once defined, these metrics will be applied consistently across your data, allowing you to analyze and report on what matters most to your organization.
Can I track sentiment trends over time with Revelir?
Yes, you can track sentiment trends over time using Revelir's Data Explorer. Simply filter your dataset by the desired date range and select 'Sentiment' as one of the metrics to analyze. Revelir will provide you with a visual representation of sentiment changes, allowing you to identify patterns and correlations with specific events or changes in your product or service. This feature helps you understand how customer sentiment evolves and what factors might be influencing it.
When should I use Conversation Insights in Revelir?
You should use Conversation Insights in Revelir when you want to dive deeper into specific tickets or segments of your data. This feature allows you to view the full conversation transcript, review AI-generated summaries, and inspect the metrics and tags assigned to each ticket. It's particularly useful for validating trends you see in the Data Explorer or when you need to pull real examples for internal discussions or reporting.
Why does Revelir process 100% of my tickets?
Revelir processes 100% of your tickets to ensure that you capture all relevant signals and insights without bias. Unlike sampling methods that can miss critical patterns, full coverage allows you to analyze every conversation for sentiment, churn risk, and customer effort. This approach enhances the reliability of your metrics and provides a comprehensive view of your customer interactions, enabling informed decision-making based on complete data.