

Most teams try to detect emerging ticket trends by watching volume charts. It’s usually too late. By the time the line jumps, the issue has spread, customers are frustrated, and the fix is now a project. The better play is semantic-first trend detection that spots pattern shifts inside the conversations before counts spike.
So let’s be specific. If you want to detect emerging ticket trends early, you need clustering on meaning, not just totals, plus change detection on those clusters. You also need consistent tags you trust, and a way to click into the exact tickets for proof. Without that, you’re guessing. Same thing with most homegrown dashboards, they look fine until an edge case slips by. Then you’re in a fire drill.
Key Takeaways:
- Detect emerging ticket trends by clustering on meaning first, then running change detection on cluster counts over time.
- Volume spikes lag reality, so build early-warning signals on semantic clusters and drivers.
- Use topic modeling plus change-point detection, and back it with a stable, human-aligned taxonomy.
- Prioritize alerts with practical heuristics: severity, segment impact, rate of change, and traceable quotes.
- Measure precision and recall weekly, then refine tag mappings so the system gets sharper.
- Tie every metric to source tickets so insights survive leadership and product reviews.
Stop Waiting For Spikes: Detect Emerging Ticket Trends Early
You detect emerging ticket trends early by analyzing semantics before volume moves. Cluster tickets by topic and driver, then watch for small, statistically significant shifts inside those clusters. An onboarding bug shows up as new language and raw tags days before counts jump. That’s your head start.
What volume misses first
Volume measures absence or presence, not why it happens. You see 20% up, you don’t see the driver behind it. That invites the wrong fix. Maybe you see “billing” rise, but the language is actually “trial credit removed early.” Different root cause, different path to resolution, and very different priority.
Most teams find out the hard way. Volume looked stable, but new users quietly struggled with a recent UI tweak. The pattern was there in the words people used, not in the count. By the time someone noticed a bump, churn risk had already spread across the new cohort. Nobody’s checking the words at scale, so you miss the early signal.
Why semantics give you lead time
Meaning changes before math. Language shifts first, then clusters grow, then totals move. If you look at raw text clusters grouped into clear drivers, a scorecard can show a 3% week-over-week uptick in a niche theme. That’s tiny, but if it is consistent across a key segment, it is real.
Let’s pretend you launch a new payment flow. Early tickets mention “declined after save,” “card on file not found,” and “retry spins.” That is a semantic fingerprint. You’ll see that fingerprint appear in a small cluster days ahead of a visible spike. Catch it there and you cut escalation volume later.
The Root Cause: Why Volume-Only Alerting Misses Real Problems
Volume-only alerting misses real problems because it is a lagging indicator and depends on inconsistent, manual tags. By the time a volume rule fires, the damage is underway. And if tags are messy, your “billing issue” alert hides five unrelated problems.
Lagging indicators create false comfort
Volume is easy to graph, so it feels reliable. It isn’t. It compresses rich context into a single line that only moves when things are already bad. Teams lean on it because it’s simple and it fits existing dashboards. The result is false comfort during the quiet build-up, then panic during the sudden jump.
I’ve seen the pattern. Ops teams spend Monday morning explaining why “nothing flagged” last week. The truth is boring. The signal was there in semantics, not in counts. Counts are a rearview mirror. If you want forward visibility, you need early drift detection in the topics themselves.
Fragmented tags hide root causes
Manual tags sound good on paper. In practice, they’re noisy. Agents tag differently, the taxonomy drifts, and new issues get stuffed into old buckets. You end up with a “Payments” tag that means ten different things, so analysis collapses nuance and hides the trend you actually need to see.
Same thing with one-size-fits-all sentiment tools. A negative label can point to very different drivers. Without a clean, human-aligned taxonomy on top of granular AI raw tags, you get “what happened” without “why it happened.” That gap is where trend detection fails.
The Cost Of Missing Emerging Ticket Trends
Missing emerging ticket trends costs time, money, and trust. Hours get burned on escalations and root-cause hunts, customers wait longer, and roadmap priorities drift. Industry data points the same way. The Zendesk CX Trends 2024 report shows faster, proactive detection links to higher satisfaction and lower operational drag.
Time and escalation math you cannot ignore
Every escalation has a tail. Engineering triage, back-and-forth with support, a PM context switch, maybe a hotfix. Multiply that by dozens of tickets across a week. Even a small weekly miss compounds into sprints lost, not hours. Teams lose momentum. Leaders lose patience.
We measured this at a few companies. Catch an onboarding regression seven days earlier and you avoid the peak week of rework entirely. That is not abstract. It is fewer pages, fewer late-night pings, and a calmer release cycle. The alternative is reactive churn fighting, which is expensive and demoralizing.
Trust, decisions, and the product room
When your evidence is thin, meetings turn into debates. People argue about samples, not solutions. Leadership asks for proof. If you can’t trace a trend to the exact tickets and quotes, you stall. Worse, roadmaps drift toward the loudest anecdote. That is how small misses turn into big, wrong bets.
There’s a second-order cost too. Analysts burn time pulling exports into spreadsheets, trying to reconstruct the story. It feels diligent. It’s a waste. A reliable semantic trend system collapses that work, and it stands up to scrutiny. That changes the tone of the room, especially when evaluating detect emerging ticket trends.
- Escalations per incident rise 2-3x when trends go undetected.
- Average time-to-diagnosis can double without early semantic flags.
- Leadership confidence erodes when insights aren’t traceable to source tickets.
- Roadmap debt grows as reactive fixes push planned work out.
For context on the broader impact of proactive operations, see McKinsey’s research on customer care modernization, which ties proactive signals to measurable resolution gains.
What It Feels Like On The Ground for Detect emerging ticket trends
It feels like whiplash when you miss emerging ticket trends. Fridays are quiet, Mondays explode, and by Wednesday everyone is tired of arguing about root cause. You start dreading launches, not because change is bad, but because nobody trusts your alerts to catch the early drift.
The Monday fire drill
You log in. Queue is up 18%. Slack has ten threads with half-formed theories. Support says it started Saturday afternoon. Product says nothing changed. Engineering points to infra graphs that look normal. You know the answer lives in the words customers used, but you don’t have a clean way to see them at scale.
You copy IDs into a spreadsheet, read transcripts, and build a list of phrases by hand. It’s slow. It’s brittle. And while you do it, customers wait longer, agents stall on replies, and everyone gets grumpy. You feel behind because you are behind. The system reacted late.
The leadership moment
Thursday’s review lands. A VP asks why nobody saw it coming. You share a chart. It shows volume moving, not meaning shifting. The follow-up is predictable. “Show me the tickets.” Now you are screen-sharing snippets and hoping the sample is convincing. It rarely is.
Honestly, that’s the tell. When insight isn’t traceable to the exact conversations, decisions stall. People smell risk. They ask for more data. You leave the meeting with homework instead of a green light to fix the thing that’s actually broken.
How To Detect Emerging Ticket Trends With Semantics
You detect emerging ticket trends with a two-part system, semantic clustering plus change-point detection, wrapped in a stable taxonomy that people recognize. Cluster tickets into coherent themes, map them to canonical drivers, then watch for small, sustained shifts in those clusters. Back it up with examples you can click.

Build the pipeline that sees meaning
Start with ingestion and a clean text pipeline. Normalize, embed, and cluster conversations into raw topics, then map those raw tags into canonical categories people understand. That mapping matters. It is how you turn model output into signals your org can act on without a translation layer.
Once topics exist, compute daily or weekly cluster counts by segment, then apply change-point detection. You are looking for low-amplitude, consistent moves inside a specific cohort, not one-off noise. As signals emerge, attach representative tickets and short summaries so validation takes minutes, not days.
A simple path that works well:
- Normalize and embed text, then cluster into raw topics.
- Map raw tags to canonical tags and drivers your org already uses.
- Track cluster counts by week, segment, and driver, then run change detection.
- Attach example tickets and quotes to each alert for fast validation.
Algorithms that work on ticket data
Ticket data is short, messy, and repetitive. So pick models and detectors that handle sparse, evolving text. Modern topic modeling like BERTopic can surface coherent themes from embeddings. For change detection, cumulative sum tests or Bayesian online detectors catch small, sustained shifts without flagging every wiggle, especially when evaluating detect emerging ticket trends.
Clustering needs to tolerate weird edges. Density-based methods handle that better than rigid k-means in many support datasets. HDBSCAN is a strong default when themes vary in size. For more context, see the official HDBSCAN documentation or explore BERTopic’s approach to dynamic topic modeling in its project docs.
- Use BERTopic or similar for semantically meaningful clusters on short texts.
- Prefer HDBSCAN when cluster shapes vary and noise is high.
- Apply change-point detection on cluster time series, not total volume.
- Tune sensitivity per segment to avoid alertstorms on tiny cohorts.
Prioritize alerts with simple, defensible heuristics
The goal isn’t more alerts. It’s better alerts. So add guardrails. Require a minimum base size before an alert can fire. Weight severity by sentiment or churn-risk share inside the cluster. Emphasize changes that hit protected or high-value segments. And always link to tickets that prove the pattern.
We like practical heuristics because they are easy to explain. If an alert fires, you can answer why in one sentence. That keeps everyone aligned and reduces rework. Also, review false positives weekly. A quick calibration loop keeps noise down and precision high.
- Minimum base size, then a sustained percent increase threshold.
- Severity weighting by negative sentiment share or effort.
- Segment-aware prioritization, so high-value cohorts rank higher.
- Always include two to three representative tickets and quotes.
Ready to cut false alarms and catch issues earlier? Learn More
How Revelir AI Makes Early Trend Detection Real
Revelir AI makes early trend detection real by processing 100% of your tickets, clustering semantics into raw tags, rolling them into canonical categories, and computing metrics you can filter, group, and defend with source quotes. The result is fast, traceable signals you can act on without guesswork.
Full coverage with hybrid tagging, no sampling
Revelir ingests from Zendesk or CSV and processes every conversation, not a sample. That matters. Coverage removes blind spots and bias. The AI generates granular raw tags that catch emerging, long-tail themes. Then you map those raw tags into canonical tags and drivers your org recognizes.

Over time, Revelir learns those mappings, so new tickets roll up cleanly. You get discoverability and clarity in one system. Now your trend lines mean something, because the buckets are stable. When a niche theme starts to move, you see it in a way stakeholders understand.
Custom AI Metrics, tied to quotes you can defend
Out of the box, you get structured fields like Sentiment, Churn Risk, Effort, and Outcome. You can also define Custom AI Metrics in your own language, like “Reason for Churn” or “Upgrade Blocker.” These become columns you can filter and group in analysis, which turns a hunch into a measurable signal.
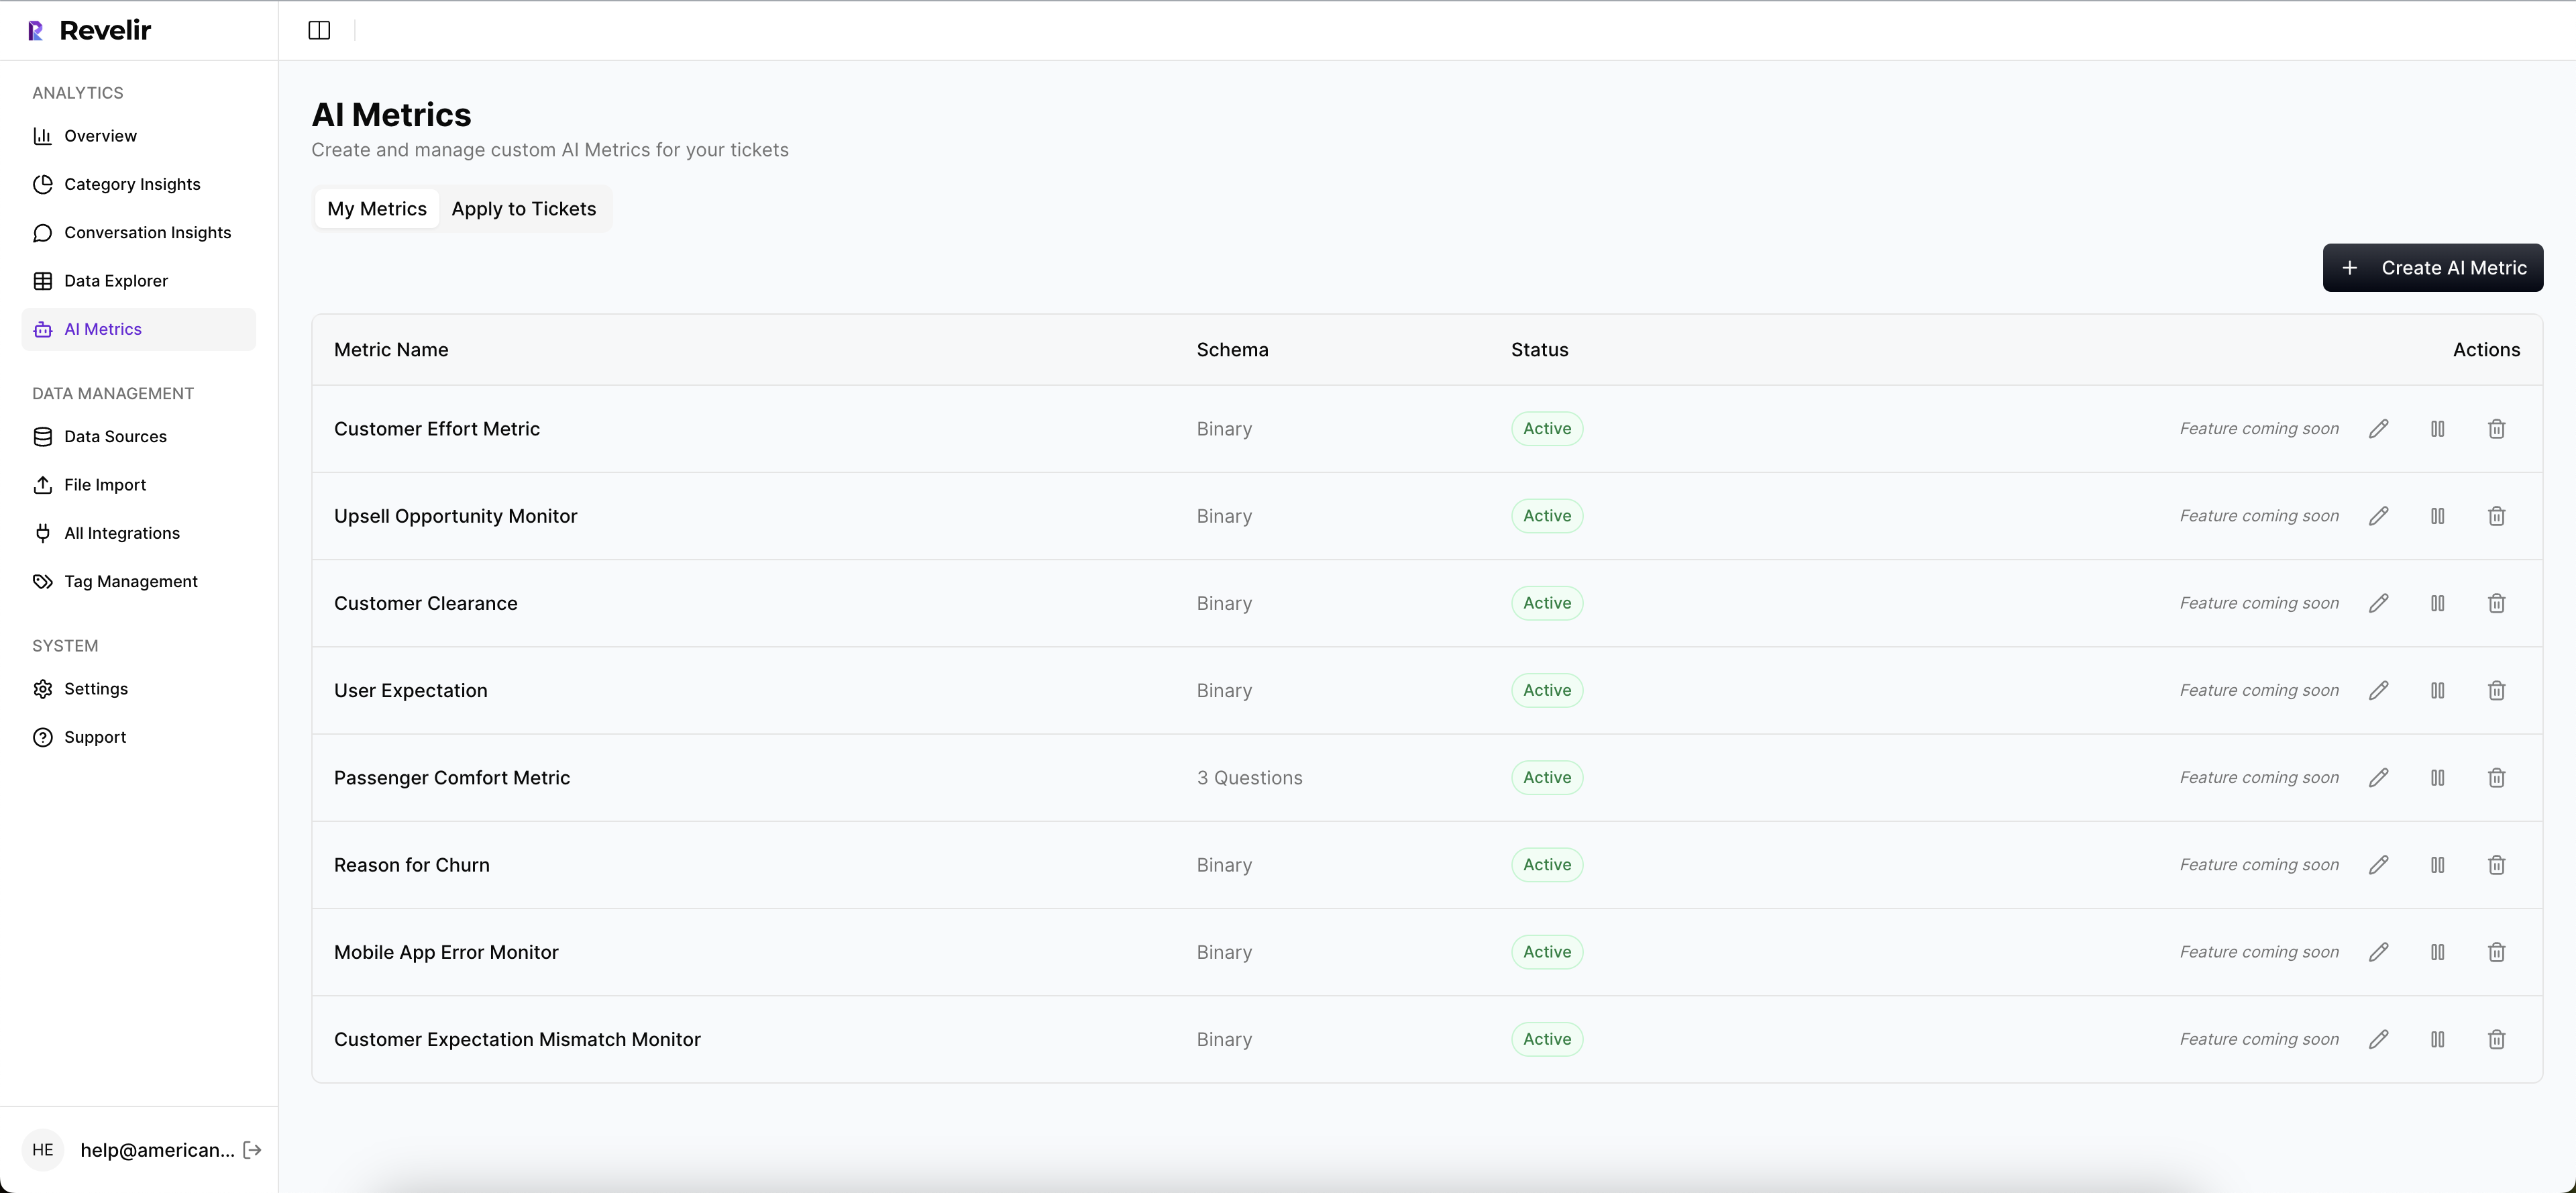
Every aggregate in Revelir links to Conversation Insights with full transcripts and AI-generated summaries. You click into the exact tickets and grab quotes for the deck. That’s the credibility piece. Leaders ask for proof, and you have it in two clicks. Meetings move faster when evidence is at hand.
Data Explorer and Analyze Data for fast pivots
Revelir’s Data Explorer gives you a pivot-table-like view of every ticket, with columns for drivers, tags, sentiment, effort, churn risk, and your custom metrics. You slice by week, segment, or product area, then group results and sort. When something looks off, you drill down, validate, and return to your view without losing context.

Analyze Data adds grouped, leadership-friendly summaries. Stacked charts and interactive tables make it easy to spot which drivers are trending negative and in which cohorts. The benefit is speed. You go from “something is off” to “here’s exactly what changed and where” in minutes, not hours.
- Full-Coverage Processing eliminates sampling risk and lag.
- Hybrid Tagging pairs AI discoverability with human-aligned reporting.
- AI Metrics and Custom AI Metrics quantify the “why,” not just the “what.”
- Evidence-Backed Traceability links every number to tickets and quotes.
- Data Explorer and Analyze Data turn exploration into decisions quickly.
Teams using Revelir routinely replace spreadsheet hunts with two-minute validations, and they address issues days earlier than volume-only monitoring would allow. That directly reduces the rework and escalation load described earlier.
Want to see this workflow against your own data? See how Revelir AI works
Conclusion
Early detection is a behavior shift. Stop waiting for the spike. Detect emerging ticket trends by watching meaning move first, then counts. Build clusters, map them to drivers, apply change detection, and tie every alert to tickets you can show in the room. Do that and you find problems 7 to 14 days earlier, with far fewer false alarms. With Revelir, that process is built in, from ingestion to traceable insight.
Ready to turn support conversations into early warnings you can trust? Get started with Revelir AI (Webflow)
Frequently Asked Questions
How do I set up semantic clustering in Revelir AI?
To set up semantic clustering in Revelir AI, start by ingesting your support tickets from Zendesk or via CSV uploads. Once the data is in, Revelir automatically generates raw tags that capture the semantic meaning of each conversation. Next, map these raw tags to canonical categories that your organization recognizes. This will help you create coherent themes. Finally, track cluster counts over time and apply change-point detection to identify any significant shifts. This process allows you to catch emerging trends before they escalate.
What if I need to analyze ticket trends by specific segments?
You can analyze ticket trends by segments using Revelir’s Data Explorer. Start by filtering your dataset based on the desired segment, such as customer type or issue category. You can then group the results by metrics like sentiment or churn risk. This way, you can easily spot which segments are experiencing issues. Remember to use the Analyze Data feature to create summaries that highlight trends specific to those segments, making it easier to address any emerging problems.
Can I customize metrics in Revelir AI for my specific needs?
Yes, you can customize metrics in Revelir AI using the Custom AI Metrics feature. This allows you to define domain-specific classifiers, such as 'Reason for Churn' or 'Upgrade Blocker'. Simply create your custom questions and value options, and Revelir will store these as columns for filtering and analysis. This flexibility helps ensure that the metrics you analyze are directly relevant to your business needs, providing more actionable insights.
When should I review false positives in my trend alerts?
You should review false positives in your trend alerts regularly, ideally on a weekly basis. This helps maintain the accuracy of your alerts and reduces noise in your analysis. Use Revelir’s hybrid tagging system to refine your taxonomy and ensure that your alerts are based on meaningful changes rather than one-off anomalies. Regular calibration can help improve the precision of your alerts, making it easier to focus on the trends that truly matter.