

Most teams feel stuck between two bad choices on feedback pipelines. Either you pay for heavy models on every ticket or you sample and miss real issues. This playbook shows a third path for costefficient fullcoverage feedback. Full ingest for every conversation, then smart controls that keep spend predictable and every metric traceable to source.
If that sounds ambitious, good. We want ambitious and grounded. We’ll define SLAs you can prove, put hard numbers on compute and storage, map an approach that cuts waste without losing signal, then show how Revelir AI makes the new way real. If you’ve been burned by reprocessing and manual audits, you’ll recognize the patterns fast.
Key Takeaways:
- You don’t have to trade coverage for cost. Design for both with tiered processing and audit-by-default lineage.
- Define coverage SLAs first, then build to those targets. Latency, retention, and auditability standards prevent hidden rework later.
- Put numbers on CPU, memory, and storage per ticket. Set budget guardrails before you scale.
- Use confidence thresholds to gate heavy processing. Recompute only where the data is uncertain or the account is high value.
- Link every aggregate to transcripts. When someone asks “show me,” you should be two clicks from the answer.
- Build idempotent ingestion and backfills. Avoid duplicates, drift, and opaque rebuilds that inflate cost without adding signal.
- Validate with real quotes before shipping conclusions. Evidence prevents wasted work and earns trust outside CX.
Stop Choosing Between Coverage And Cost In Feedback Pipelines (costefficient fullcoverage feedback)
Full coverage and cost control can coexist if you design for both from the start. The pattern is simple to explain and disciplined to run: ingest every ticket, run a lightweight first pass for discovery and core metrics, then reserve heavy processing for high-confidence need or high-value segments. That structure preserves signal, reduces reprocessing, and keeps audits clean.
The false tradeoff comes from treating every ticket the same or giving up on coverage entirely. When you push everything through the slowest path, bills spike and teams panic. When you sample, you invite bias and late detection of churn risk. The fix is a pipeline that routes by confidence and priority, where every number links back to the words customers actually said.
What Most Teams Get Wrong About Coverage
Teams equate full coverage with full complexity, which is where the money burns. You don’t need a heavy model on every pass to catch frustration cues or a churn flag. A fast classifier can tag and score enough to route. The expensive work should come later, driven by thresholds and value, not habit.
Sampling looks cheaper until it isn’t. You miss a pattern, an executive asks why, then you spin up emergency reprocessing and meetings to defend the sample. The cost is not just compute. You lose time, trust, and focus. If you think you saved budget, check the rework line item and the opportunity cost of late fixes. That’s the real waste.
Why Not Both Coverage And Cost Control?
You can get both by separating discovery from decision data. Full ingest gives you statistical confidence and early warning. The first pass gives you raw tags and core metrics fast. Confidence scores gate heavier processing so you only pay when it matters. Then trace everything to transcripts so you can answer challenges in the room.
Think about your CI jobs. You don’t run the slowest test suite on every commit if a fast check tells you nothing changed. Same idea here. Lightweight passes keep you current and visible. Heavier analysis runs when thresholds trip, when cohorts matter, or when product and finance ask for proof. See how this pattern shows up in pipeline efficiency guidance from GitLab CI/CD.
Define Coverage SLAs You Can Prove: Latency, Retention, Auditability (costefficient fullcoverage feedback)
Coverage only works when it’s defined. Start by writing the scope you can stand behind, then set latency targets by tier, plus retention and audit rules. You want to know what “processed” means, how long it takes, and how anyone can verify it without a side meeting. That’s how you avoid hidden reprocessing and debates.

Teams often skip this step and pay for it later. Ambiguous scope leads to uneven coverage. Missing latency tiers create demand for “real time” everywhere. Fuzzy retention invites second-guessing when you need to show your work. Name the SLAs, attach numbers, and hold the line. It sounds bureaucratic. It prevents chaos.
What Does 100 Percent Mean For Your Org?
Decide what “in scope” actually covers before you buy compute. Channels, languages, product lines, customer tiers, and archive age all change cost. If you serve five regions with three languages, say that. If your enterprise segment gets deeper analysis, say that too. You can’t defend coverage you never defined.
Set latency standards by tier so teams stop negotiating on the fly. Real time signals within minutes, deeper metrics within hours, batch retros by next day. Now retention. Keep raw transcripts in cold storage for long horizons, keep derived artifacts at the level you need for audits, and cap hot caches to serve validation clicks. This prevents a common mistake: deleting the one thing you need to prove a chart is real.
Auditability KPI And Drill Links: What Counts
Auditability isn’t a vibe, it’s a KPI. Every aggregate should drill to canonical evidence with stable links. That takes a unique conversation ID that survives every transform, lineage tables that record model version and timestamps, and a rule for what “complete” means during an audit. If you can’t click from a chart to a transcript, it doesn’t count.
Define the minimum drill standards now so they become muscle memory later. For example, 95 percent of metrics link to transcripts with one click, and every cell opens a filtered ticket list. Keep link formats stable, even when data moves, and log a clear path back to source. You can see the spirit of this standard in how teams review coverage results in Azure DevOps, where traceability and percent coverage are part of the same story.
The Real Cost Model For Full Conversation Processing
A cost model you can defend starts with per-ticket math. Measure average transcript size, tokenization cost, and model pass counts. Then estimate storage footprints by tier and set budget guardrails before you scale. Without this, you’ll guess, miss, and then scramble when invoices creep up. The fix is a simple worksheet you actually use.
Numbers change across stacks, so treat them as ranges you revisit. The key is visibility. Track lag SLOs and spend thresholds together so you know when to degrade gracefully. Most teams wait too long, then they overcorrect and lose signal. You want a dial, not a switch.
Estimate CPU, Memory, And Storage Per Ticket
Start by sizing the easy parts. Let’s pretend the average ticket is 8 KB in text, the first pass tagging runs in 150 milliseconds of CPU with 50 MB of memory, and you store 90 days of raw transcripts in cold storage. Add a warm index for recent search and a small hot cache for audit drill downs. Now multiply by daily volume.
Model the deeper passes separately. Custom AI metrics and long-context analysis have very different costs. Tie them to triggers like low confidence or high-value segments. Keep a line item for reprocessing so you can see whether selective recompute is working. When in doubt, write it down. Finance will ask.
- Discovery footprint: raw transcripts, raw tags, core metrics
- Decision footprint: canonical tags, drivers, heavy metrics
- Audit footprint: compact evidence slices and stable drill links
- Backfill footprint: temporary spikes during historical imports
- Overhead: lineage, logs, and metadata
Set Lag And Spend Thresholds With Alerts
Translate the model into monitors. Set processing lag SLOs for each tier and alert thresholds at 50, 80, and 100 percent of budget. Track cost per ticket, per thousand tokens, and per model pass. When thresholds breach, degrade to first pass signals, queue deeper metrics for off peak, and log variance for review.
You also want reprocessing rules that prevent a death spiral. Cap daily recompute, prioritize by risk and segment, and record why each batch ran. That note sounds small. It prevents fights later. If you need a pattern for documentation control at scale, this guide on pipeline integrity documentation management captures the idea well.
Why Teams Burn Out Chasing Manual Audits And Reprocessing (costefficient fullcoverage feedback)
Manual audits and emergency rebuilds feel like control. They’re actually a treadmill. You sample, you miss a pattern, leadership asks why, and then you burn a week proving a point that the data should have answered on day one. Morale drops. Budgets wobble. The backlog grows. You didn’t fail at effort. You failed at traceability.
We’ve all been there. A churn spike lands on your desk, and you can’t show three clean examples behind it without exporting spreadsheets, formatting quotes, and babysitting links. That’s a trust problem, not a tooling problem. It’s also fixable. Evidence turns debate into a decision, and it prevents another week of rework.
The Human Cost Of Sampling And Rework
Sampling looks reasonable during a quiet month. Then a quarter turns, and your sample misses the driver that matters. Now you’re running ad hoc reviews under pressure. People stop trusting the numbers and start defending positions. You lose weekends to rebuilds that shouldn’t have been needed in the first place.
You also pay in burnout. Engineers redirect to one-off reprocessing. Analysts patch together narratives from partial views. PMs wait for proof and push decisions to next sprint. It’s a slow, hidden cost that compounds. If you want a good gut check on why coverage matters, read a pipeline coverage practical guide. The patterns rhyme across domains.
What Happens When Someone Says “Show Me”?
This is the moment that makes or breaks momentum. A VP asks for three examples behind a spike. If you scramble across exports and screenshots, you lose the room. If every aggregate links to a filtered list of tickets, you click the count, open Conversation Insights, and copy quotes. The decision moves forward.
Write the micro flow and practice it. Click the number. Open the transcript. Confirm the quote. Share it in the doc. If that takes more than a minute, your pipeline is missing traceability. Teams often underestimate how much this single habit reduces friction and stops meetings from stalling.
A Production Playbook To Ingest, Tag, And Trace At Scale
The playbook is straightforward. Build idempotent ingestion, store raw transcripts with stable IDs, run a fast first pass, then gate heavy processing behind thresholds. Keep lineage tables updated and links stable so every metric can be audited with a click. It’s boring work in the best way. It prevents expensive surprises.
You can phase it in. Start with one source and defaults. Add canonical tags and drivers over time. Introduce custom AI metrics when your questions get sharper. The point is repeatability. When the pattern holds, you can answer more questions with less effort and lower risk.
Ingestion Patterns, Idempotency, And Backfills
Connect helpdesks for ongoing syncs and use CSV backfills for quick starts or history loads. Implement idempotent upserts keyed by canonical ticket IDs plus last updated timestamps. That prevents duplicates and drift. Batch historical imports to respect rate limits, then stream new or updated tickets on a schedule that matches your latency tiers.
Persist raw transcripts in cheap, encrypted cold storage and attach enough metadata for quick lookup. Record every ingest in a lineage table with source, ingest time, and version markers. That way, when someone asks why a ticket changed, you can show exactly which fields updated and when. Small detail. Giant trust boost.
To operationalize this approach:
- Define a canonical ID strategy and enforce it across sources.
- Build an ingest log with source, timestamp, and checksums.
- Store raw transcripts and keep a pointer in your warehouse.
- Implement upserts using ID plus last updated fields.
- Schedule backfills in batches and monitor throughput.
Tiered Processing, Confidence Scores, And Selective Recompute
Run a lightweight first pass that assigns raw tags and core metrics like Sentiment and Churn Risk. Store per-field confidence and expose it. That single column unlocks routing. Gate heavier or custom metrics behind confidence thresholds and a daily compute cap. Recompute only low confidence records or high value segments like enterprise accounts, rising drivers, or churn flagged tickets.
Expect a healthy reduction in reprocessing with this pattern because you are not rerunning everything. You are fixing uncertainty and feeding priority. When the model changes, roll updates in waves and log the version in lineage. You stop overpaying for marginal gains and you stop missing critical signals at the edges.
Stop chasing approvals and reactive rebuilds. Start publishing evidence-backed insights faster with a tiered pipeline. See how Revelir AI works
How Revelir AI Delivers Evidence Backed Coverage Without Blowing Up Spend
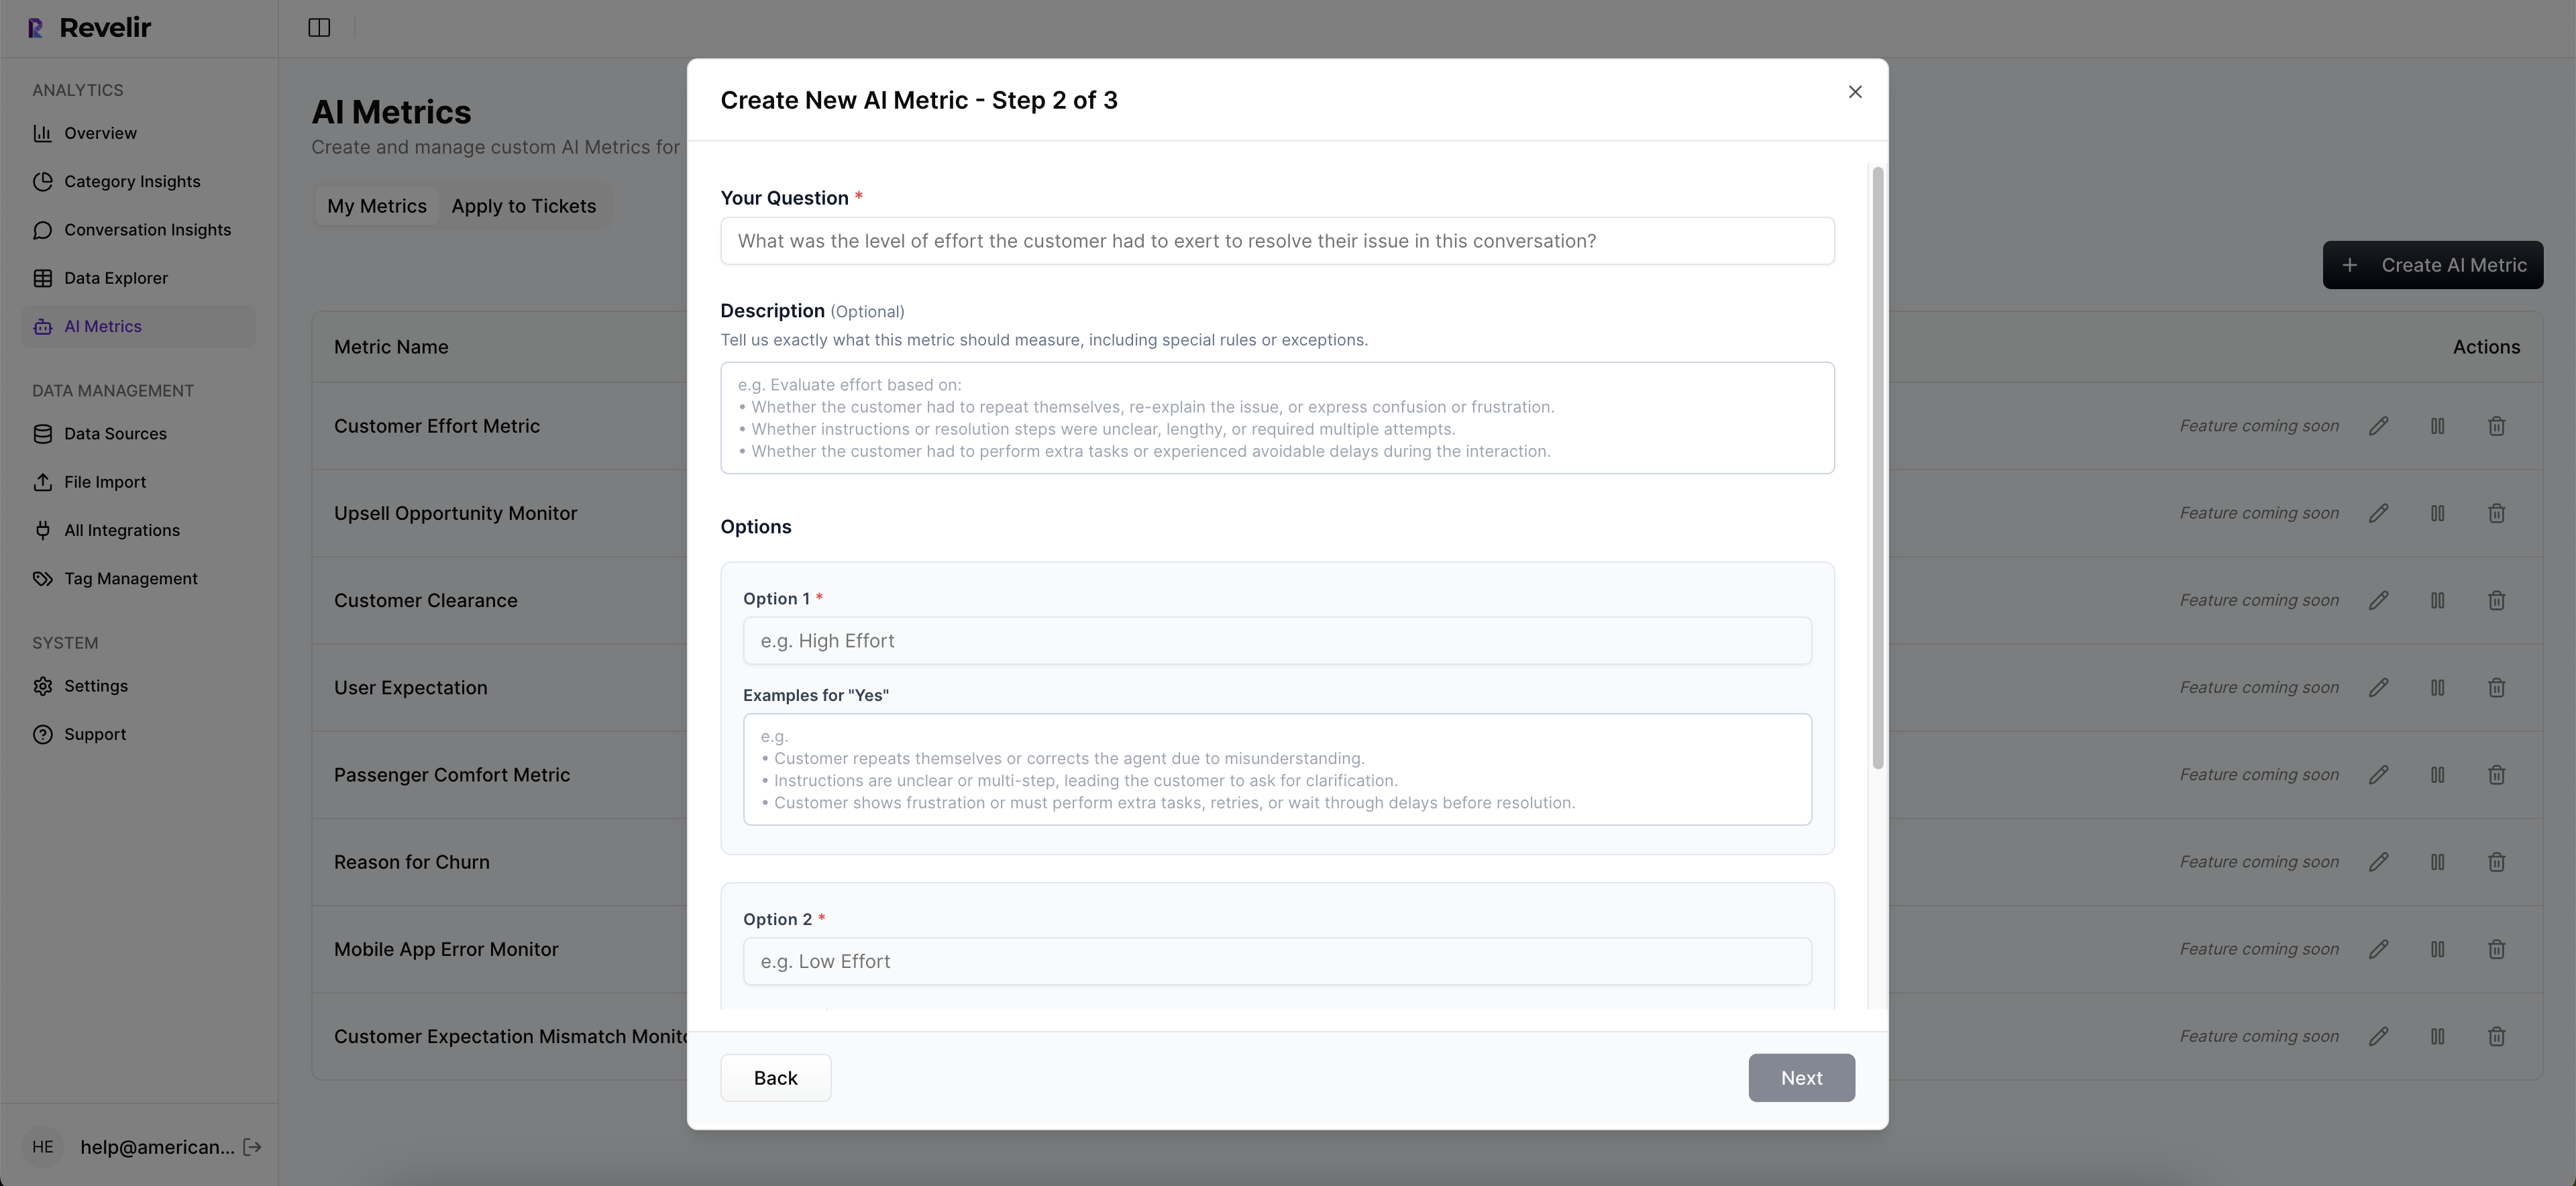
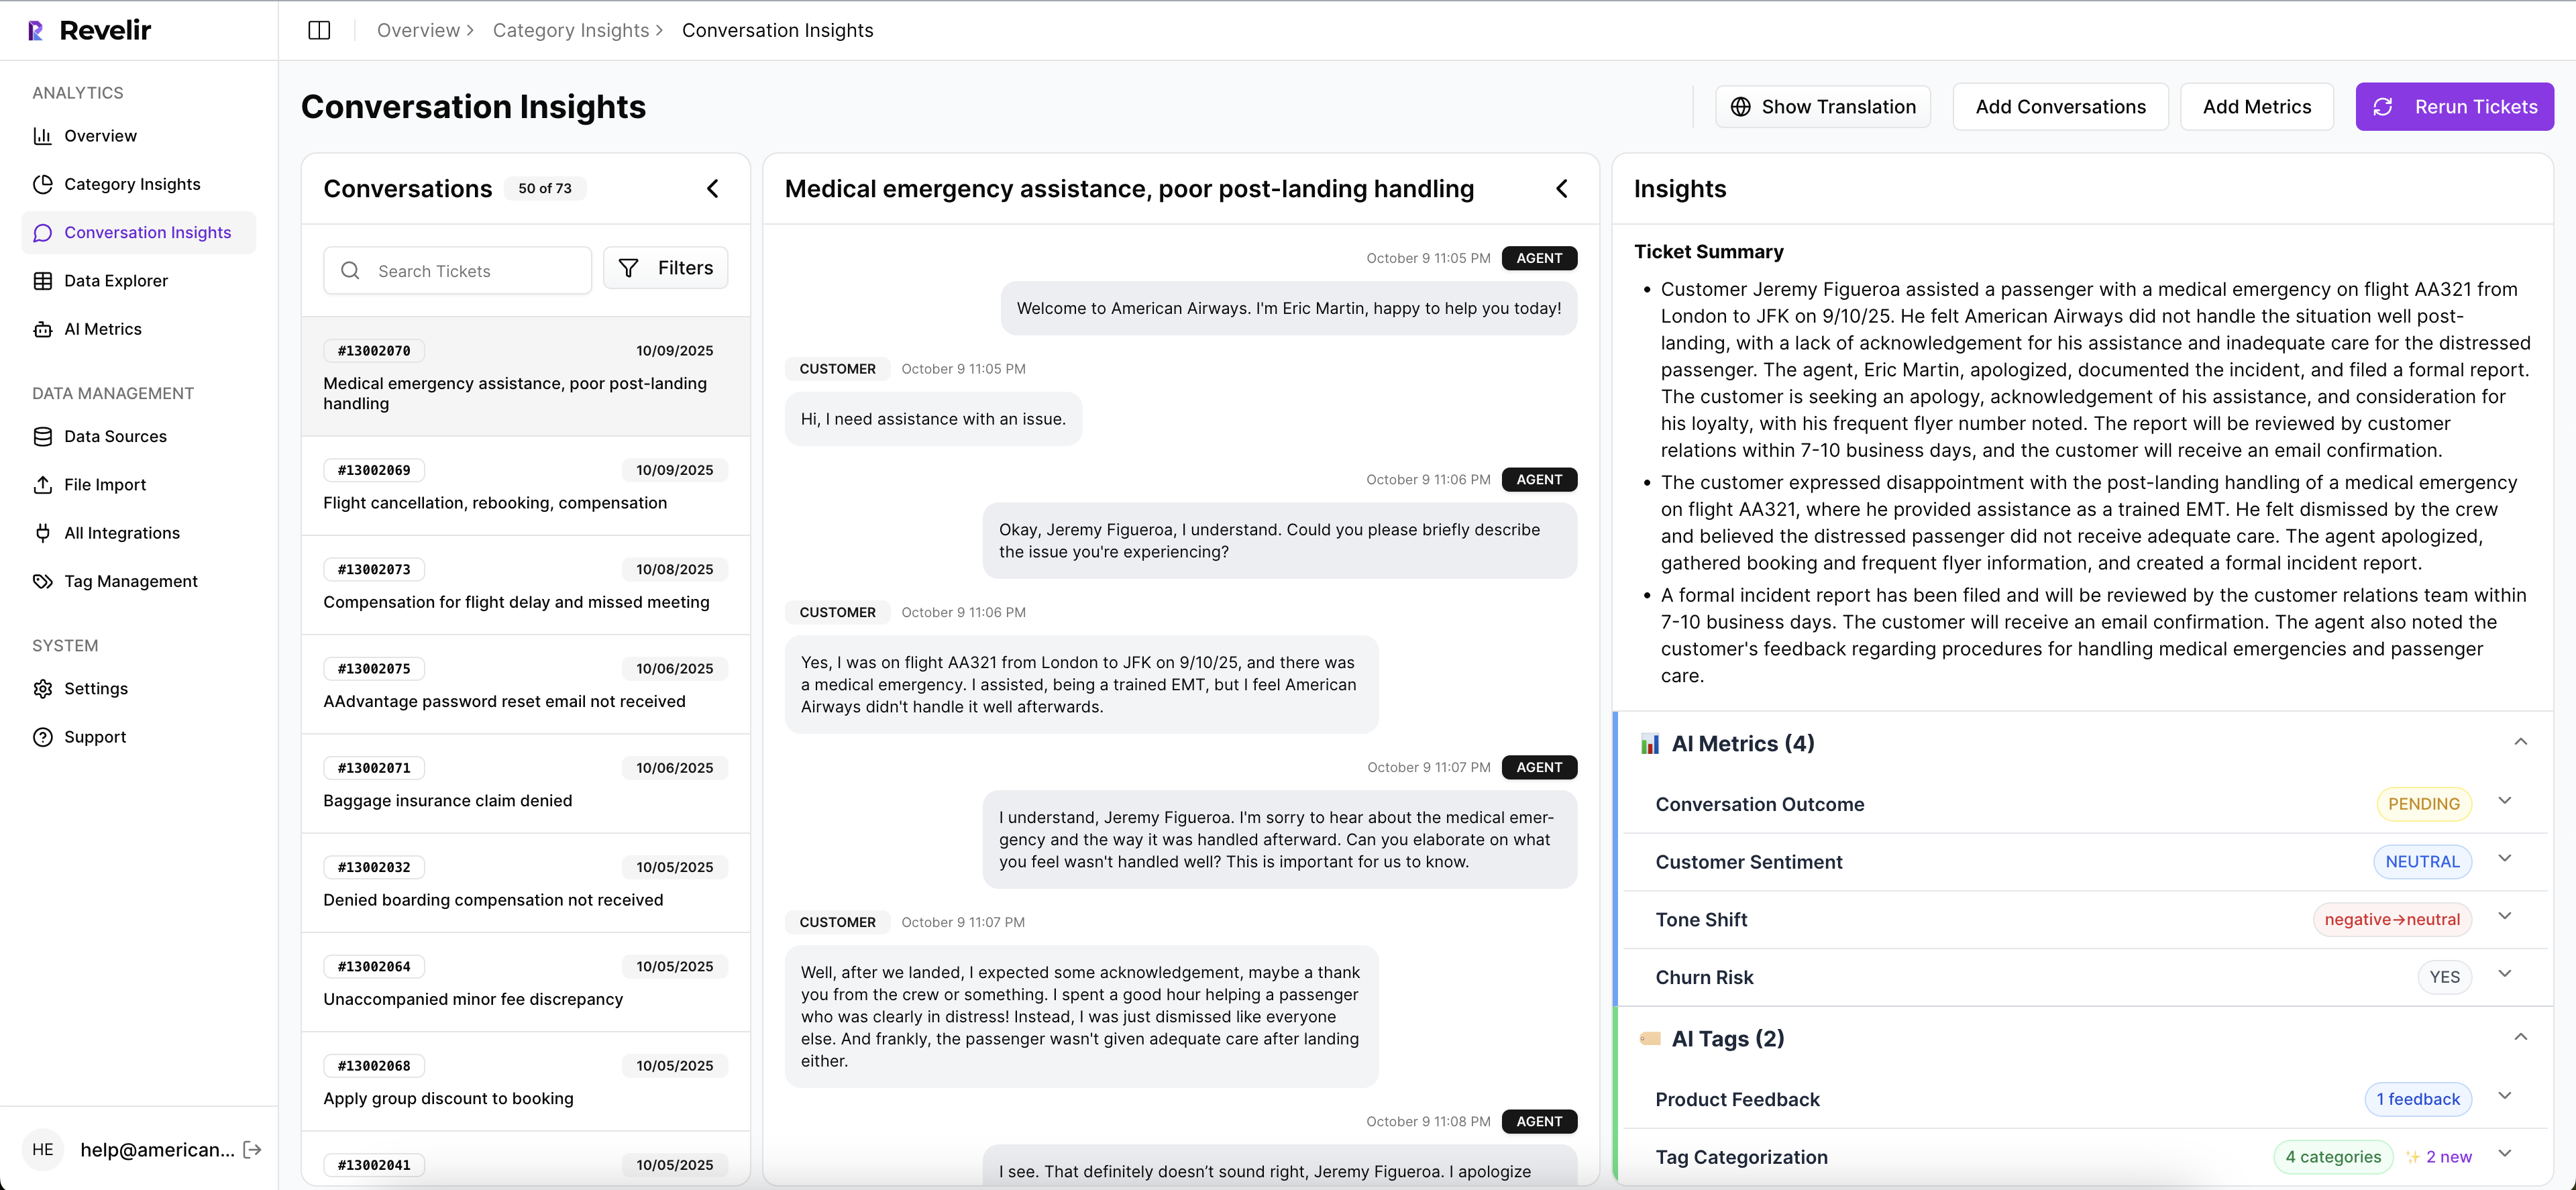
Revelir AI processes 100 percent of your tickets and keeps every metric traceable to the exact conversation. You connect Zendesk or upload a CSV, the system ingests everything, then applies raw tags, canonical tags, drivers, and AI Metrics like Sentiment, Churn Risk, and Customer Effort. The result is coverage you can trust and audits you can pass.
The workflow is simple. You explore patterns in Data Explorer, group by tags or drivers, and click any number to open Conversation Insights. There you see transcripts, summaries, and all assigned metrics. It closes the loop between aggregate and example without a separate project. That’s the culture shift most teams miss.
Full Coverage Processing With Traceability
Revelir AI reviews every conversation automatically. No sampling and no subset analysis. Each aggregate in Data Explorer links to the list of tickets behind it, and each ticket opens with a full transcript and AI summary in Conversation Insights. That means when a leader asks for proof, you have it on screen in seconds.
This directly addresses the audit and rework risks we outlined earlier. You remove the scramble because evidence travels with the metric. You cut late detection because coverage is complete. And you reduce meeting drag because examples are one click away. It’s not another dashboard. It’s a measurement layer built for decisions.
Hybrid Tagging And Actionable Metrics, Ready Day One
Revelir AI generates raw tags for discovery, then rolls them into canonical tags and drivers for clarity. You also get core AI Metrics out of the box and the option to add custom metrics that match your business language. The hybrid approach lets you evolve taxonomy without losing discoverability or consistency.

You do not have to rip out tools or rebuild classifiers. Start with a CSV or connect Zendesk. Use defaults to get signal quickly. Then refine your tags and metrics as your questions sharpen. The system remembers your mappings, so future data lands where leadership expects it. That saves time and keeps reports stable.
Key capabilities you can expect:
- Full population processing with no sampling
- Data Explorer for filtering, grouping, and fast pivots
- Conversation Insights with transcripts, summaries, and assigned metrics
- Raw tags for discovery, canonical tags and drivers for reporting
- Core AI Metrics with support for custom, business-specific classifiers
3x faster path from pattern to proof. That’s what Revelir AI delivers. Learn More
Before you wrap, decide if you want to validate this on your own data. Revelir AI’s Data Explorer is the fastest way to see patterns you can click and verify. See how Revelir AI works
Conclusion
You don’t need to choose between full coverage and a sane budget. Define the SLAs you can prove, size your costs per ticket, and build a tiered pipeline that routes by confidence and value. When every aggregate links to transcripts, you stop defending numbers and start making decisions. If you want the new way without the build, Revelir AI gives you full coverage with traceability and a workflow your teams can use today.
Frequently Asked Questions
How do I set up canonical tags in Revelir AI?
To set up canonical tags in Revelir AI, start by mapping your raw tags into a smaller set of meaningful categories. First, clean up any redundant or legacy tags. Then, create new canonical tags that reflect your business language and objectives. Once you have your tags organized, you can enable core AI metrics like sentiment and churn risk to enhance your insights. This structured tagging helps ensure clarity for leadership and aligns with your reporting needs.
What if I need to analyze specific customer segments?
You can analyze specific customer segments in Revelir AI by using the Data Explorer feature. Start by applying filters based on customer attributes such as plan type or ticket volume. Once you have your filters set, you can run analyses to see metrics like sentiment and churn risk for those segments. This allows you to identify patterns and issues that may be affecting specific groups, helping you prioritize your actions effectively.
Can I validate AI outputs with real conversations?
Yes, you can validate AI outputs in Revelir AI by using the Conversation Insights feature. After running your analysis in Data Explorer, click on any metric to access the underlying conversations. This lets you review the full transcripts and AI-generated summaries, ensuring that the metrics align with the actual customer feedback. This validation step is crucial for maintaining trust in your insights and making informed decisions.
When should I use the Analyze Data tool?
You should use the Analyze Data tool in Revelir AI whenever you need to answer specific questions about your customer support data. This tool allows you to group metrics like sentiment and churn risk by different dimensions, such as canonical tags or drivers. It’s particularly useful for identifying trends, understanding the reasons behind negative sentiment, or prioritizing issues based on their impact. Running analyses regularly can help keep your team aligned on customer needs.
Why does my data need to be structured in Revelir AI?
Structuring your data in Revelir AI is essential because it transforms unstructured support conversations into actionable insights. By applying AI metrics and tagging, Revelir organizes your data into a format that is easy to analyze and report on. This structured approach helps eliminate blind spots, ensures you capture all relevant signals, and allows your team to pivot quickly across different dimensions of your support data, making it easier to identify and address customer issues.