
78% of support teams still rely on sampling, surveys, or whatever export someone pulled last Friday. That's a problem, because analyzing customer support conversations is one of those jobs that looks handled right up until a product review gets derailed by, "Do we have proof?"
You know the scene. Someone says billing is the issue. Someone else says no, it's onboarding. Nobody's checking the full conversation set, so the loudest anecdote wins.
Key Takeaways:
- Analyzing customer support conversations breaks when you rely on samples instead of full coverage
- Scores tell you that something changed, but drivers and ticket evidence tell you why
- If you can't trace a chart back to exact tickets and quotes, leadership won't trust it for real prioritization
- The best support conversation analysis uses a hybrid model: broad AI classification plus human-shaped taxonomy
- A simple rule works well: if you're reviewing less than 20% of tickets manually, assume you're missing the pattern
- CX and product teams should treat support conversations as a decision system, not just a QA archive
If you're trying to make smarter product or CX calls, Learn More. Same thing with leadership trust. You don't get it from prettier dashboards. You get it from evidence.
Most teams aren't analyzing customer support conversations
Analyzing customer support conversations means turning raw tickets into something you can actually use for decisions: patterns, drivers, risk signals, and evidence. The issue isn't lack of data. It's that most teams still treat support conversations like messy leftovers instead of the cleanest signal they already own.
Let's pretend you're a support leader with 18,000 tickets a month. You review a few ugly ones, skim CSAT comments, maybe pull a Zendesk report, then head into the weekly meeting with a theory. That's not analysis. That's informed guessing. And yeah, I get why teams do it. Manual review does catch nuance. A person reading 50 tickets can notice weird phrasing an automated dashboard might miss. Fair point. But once volume gets real, nuance without coverage turns into story time.
Sampling feels responsible because it used to be
Sampling worked when ticket volume was lower and support was treated as a service desk, not a product signal engine. Read 100 tickets, spot recurring pain, move on. Clean enough. Not anymore.
The threshold I use is simple: once you're above 1,000 tickets a month, manual sampling starts to lie to you unless it's paired with full-coverage analysis. Read that again. Not because your team got sloppy. Because the math stopped cooperating. A 10% sample on 10,000 tickets still leaves 9,000 conversations untouched, and those untouched conversations often hold the quieter patterns that later become churn, escalation, or roadmap drama.
There's a reason this keeps happening. Support queues are like a warehouse pick line with one broken scanner at the front. The visible jam gets everyone's attention, while the upstream labeling error keeps sending the wrong boxes down the belt. Ticket sampling works the same way: it spots the pileup you can already see and misses the process flaw creating tomorrow's pileup.
The real problem isn't ticket volume
The real problem isn't that you have too many tickets. It's that your analysis method was built for reporting, not diagnosis. That's the reframe most teams miss.
CSAT tells you sentiment after the fact. Basic sentiment labels tell you whether something feels negative. Exports into BI tell you what you structured manually. None of those systems are built to answer the question executives actually ask: why is this happening, who is affected, and what should we fix first? If your process can't answer all three in one pass, you're not really analyzing customer support conversations. You're circling the edges.
A lot of teams blame messy tagging. That's part of it. But messy tagging is usually a symptom. The deeper issue is no shared logic for turning free text into structured evidence. Different managers name the same issue three different ways. One person's "refund frustration" becomes another person's "billing confusion." Then the dashboard says there are no trends. Of course it does.
What the old way costs in real life
The cost isn't abstract. A PM walks into a product review with three screenshots from angry tickets. Support brings a spreadsheet with 40 manually tagged examples. Ops has a slide showing CSAT dipped 6 points. Everybody has data. Nobody has the same reality.
At 9:12 a.m. on Tuesday, the Head of Support is in Google Sheets reconciling tags from two managers who labeled the same issue differently. By 10:40, product is in Slack asking whether "billing complaints" means refund policy confusion, failed card retries, or invoice formatting. At 1:15, the COO wants a number for affected enterprise accounts before the board prep doc locks. Three smart people, half a day gone, and the answer is still "we think." That's what bad support conversation analysis costs: time, credibility, and one more meeting where instinct beats evidence.
That's the real bill. And once you see it, the next question gets sharper: where does bad analysis actually break first?
The cost of bad support conversation analysis shows up in every meeting
Bad support conversation analysis creates decision drag. It slows prioritization, weakens trust, and turns obvious customer issues into debates about evidence. That's why teams feel busy all week and still walk into leadership reviews underprepared.
A lot of this comes down to what I call the Three-Layer Failure Stack: missing coverage, missing drivers, missing proof. If you have one of those, decisions wobble. If you have all three, you're basically doing theater with charts.
Layer one is coverage
If you're analyzing only a slice of conversations, you're choosing blindness. Harsh, maybe. Still true.
According to Zendesk's customer service trends work, support teams are dealing with rising ticket complexity and higher expectations for faster, more personalized responses (Zendesk CX Trends). That means small samples age out fast. A sample from last Tuesday can't explain what changed on Thursday after a release, pricing update, or outage.
A good decision rule: if the issue you're investigating affects fewer than 5% of tickets, sampling will usually miss or understate it. That's the hidden trap. Big obvious problems show up anyway. The patterns that matter most to retention often don't.
Layer two is drivers
Scores aren't strategy. They never were.
Bain has been writing about the value and limits of loyalty metrics for years, and the same lesson keeps showing up: a score can signal movement, but it doesn't tell you the operational cause (Bain on Net Promoter System). Same thing with support. A sentiment dip tells you something changed. It doesn't tell you whether customers are stuck on account access, furious about fees, confused by onboarding, or hitting a broken workflow after a product update.
That's why driver-based analysis matters. If you can't group tickets into meaningful themes, then slice by segment, time period, or customer type, your team ends up fixing what feels urgent instead of what actually drives effort, churn risk, or repeat contact. Those aren't the same thing.
Layer three is proof
Leadership trust breaks when insights can't be audited. Full stop.
This is where a lot of black-box AI tools lose the room. They produce a neat chart, maybe even a sharp summary, but nobody can click into the underlying ticket and say, "Yes, that's what happened." If the CFO or product leader asks for evidence and your analyst has to go hunting through exports for 45 minutes, the insight is already half-dead.
There is a case to be made for lightweight score monitoring if you're small, early, and just need directional signal. That's valid. But once insights start shaping staffing, roadmap, or churn conversations, direction isn't enough. You need evidence that survives scrutiny.
A day in the life of this mess
It's 8:30 a.m. and your Head of Support is in a doc with 27 pasted ticket quotes. By 10:00, product wants to know whether "billing complaints" means refund requests, invoice confusion, or failed checkout. At 1:00, the COO asks how widespread the issue really is. Nobody knows without another manual pass.
That single loop can burn half a day for two or three people. Not because they're bad at their jobs. Because the system keeps asking humans to do work a metrics layer should have done already.
So what replaces that? Not another prettier score. A different operating model.
The better approach to analyzing customer support conversations
The best way to analyze customer support conversations is to start with full coverage, structure the raw text into decision-ready fields, group issues into drivers, and keep every metric tied back to the source ticket. That's the shift from "interesting feedback" to evidence you can run a business on.
I use a simple framework for this: Cover, Classify, Cluster, Confirm. Four moves. In that order. If you skip one, the rest gets shaky.
Start with full coverage before interpretation
You can't diagnose what you didn't inspect. That's rule one.
Most teams do the reverse. They start with a few tickets, form a theory, then go look for confirming examples. Human nature. Also a terrible analysis method. When you're analyzing customer support conversations, full coverage comes first because it changes the conversation from "I think" to "we can see."
The benchmark I like is 95% plus coverage of available ticket volume for any serious trend analysis. If you only have a sample, treat the result as exploratory, not decision-grade. That's a clean conditional rule. Sampled insight can guide a question. It shouldn't set a roadmap.
This is also where I'd push back on the common fear that full coverage means months of setup. It doesn't have to. If your data can already come out of Zendesk or a CSV, the obstacle usually isn't infrastructure. It's deciding that support conversations deserve first-class analysis in the first place.
Use structured fields, not vague summaries
Raw text is rich. Raw text is also chaos.
Teams get stuck because they jump from transcripts straight to narrative summaries. Summaries are useful, but they aren't enough on their own. You need structured fields that let you sort, filter, and compare. Sentiment. Effort. Outcome. Churn risk. Tags. Custom business-specific metrics. That's how analyzing customer support conversations becomes repeatable instead of artisanal.
A practical threshold: if two analysts reviewing the same 100 tickets would create more than 15% different labels, your taxonomy is too loose for executive reporting. That's not a knock on the analysts. It means the system needs a better translation layer between messy language and business language.
Before:
- "Customers seem upset about billing"
After:
- 18% of conversations tied to Billing show negative sentiment
- High-effort tickets in Billing are 2.4x more likely to include churn risk
- Refund-related raw tags roll into a canonical billing confusion category
- Enterprise accounts mention this issue 3x more than SMB
That difference is everything.
Build a driver tree your leadership team can understand
Drivers are where analysis gets useful. A driver tree turns hundreds of granular issues into a manageable set of high-level explanations. Billing. Onboarding. Account access. Performance. You can call them whatever fits your business. That's the point.
The Driver Ladder is a good mental model here:
- Raw observation
- Repeated issue
- Canonical category
- Driver
- Business action
If your analysis stops at step two, you're collecting noise. If it gets to step five, you've got something leadership can use. This surprised us more than anything else, honestly. Teams don't usually fail because they lack quotes. They fail because they can't compress those quotes into a structure that travels across departments.
And yes, there is a downside. A driver tree can flatten nuance if you force too much into broad buckets. That's real. But broad buckets with drill-down beat endless one-off tags every time, because they give you both speed and nuance instead of forcing a choice.
Keep human judgment in the loop, but put it in the right place
People hear AI analysis and imagine a black box making unchecked calls. That's the wrong picture.
Human judgment matters most in taxonomy design, exception review, and interpretation. It matters least in reading ticket 8,431 manually to decide whether it sounds frustrated. Same thing with repetitive first-pass tagging. That's exactly where machines should do the heavy lift.
If your team is still hand-tagging every conversation before analysis starts, flip it. Let the system generate granular tags first, then let humans refine the canonical categories and drivers. That's the Hybrid Control Rule: machines surface, humans shape. It works because each side is doing the part it's actually good at.
A lot of people resist this because manual review feels safer. I get it. Safer and more trustworthy are not always the same thing. A slow, inconsistent process can feel careful while still being wrong.
Diagnose your current maturity before you buy anything
Most teams fall into one of four buckets when it comes to analyzing customer support conversations. Figure out your bucket first. Otherwise you'll buy for the wrong problem.
The four-bucket maturity check
Bucket 1 is Reactive Sampling. You read tickets when something feels off. Bucket 2 is Dashboard Watching. You track CSAT, NPS, sentiment, and volume. Bucket 3 is Structured Patterning. You classify conversations and review grouped themes. Bucket 4 is Evidence-Led Decisioning. You can trace any claim back to actual tickets and quotes.
Ask yourself:
- Can we analyze 100% of conversations or only samples?
- Can we explain why a score moved, not just that it moved?
- Can product leaders click from a chart into real tickets?
- Can we segment patterns by cohort, plan, region, or issue type?
- Can we define custom metrics in our own language?
If you answer no to three or more, you're earlier than you think. Which is fine. But don't pretend a better dashboard alone will fix it. It won't.
Turn support analysis into a weekly operating rhythm
The teams that get real value from support conversation analysis don't run giant quarterly deep dives and call it done. They set a weekly rhythm. Small loop. Repeated often.
Try the 30-30-30 review model:
- Spend 30 minutes scanning changes in core metrics and drivers
- Spend 30 minutes drilling into the top shifts with ticket evidence
- Spend 30 minutes assigning one product fix, one support fix, and one follow-up question
That structure works because it forces movement from signal to evidence to action. Not just observation. If your review takes more than 90 minutes every week, the system is probably too manual. If it takes less than 20, you're probably staying too high level.
That's the bridge to the obvious next question. What if the analysis model is right, but your current tools still make it painful to run?
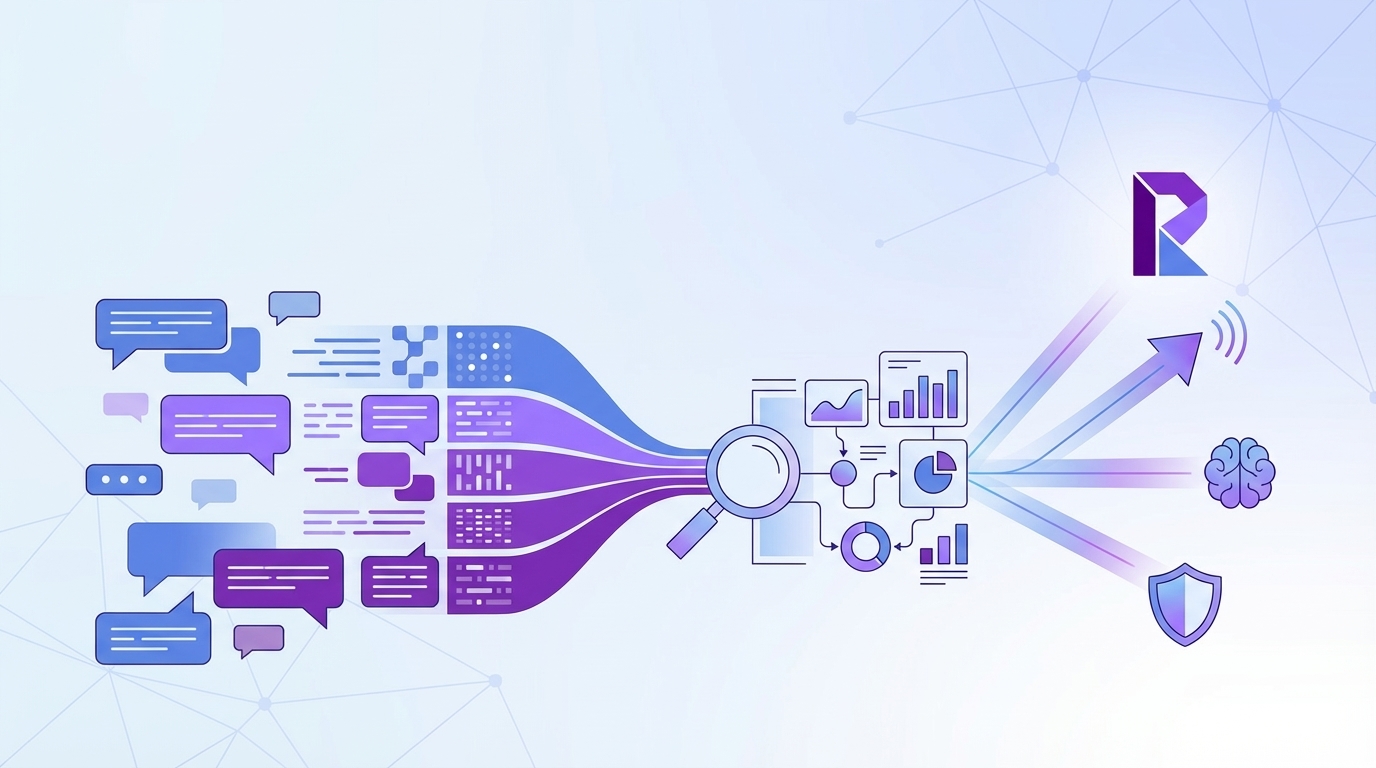
How Revelir AI makes support conversation analysis defensible
Revelir AI turns analyzing customer support conversations into a structured, evidence-backed workflow. It doesn't ask your team to replace the helpdesk. It sits on top of the conversation data you already have and makes it usable for CX, product, and ops decisions.
Full coverage and business-shaped metrics
Revelir AI processes 100% of ingested tickets with no sampling, which matters more than most teams realize. The point isn't just volume. It's removing the blind spots and bias that come from reviewing only a subset. If your current process leaves entire cohorts, weeks, or issue types uninspected, the output is shaky before the meeting even starts.
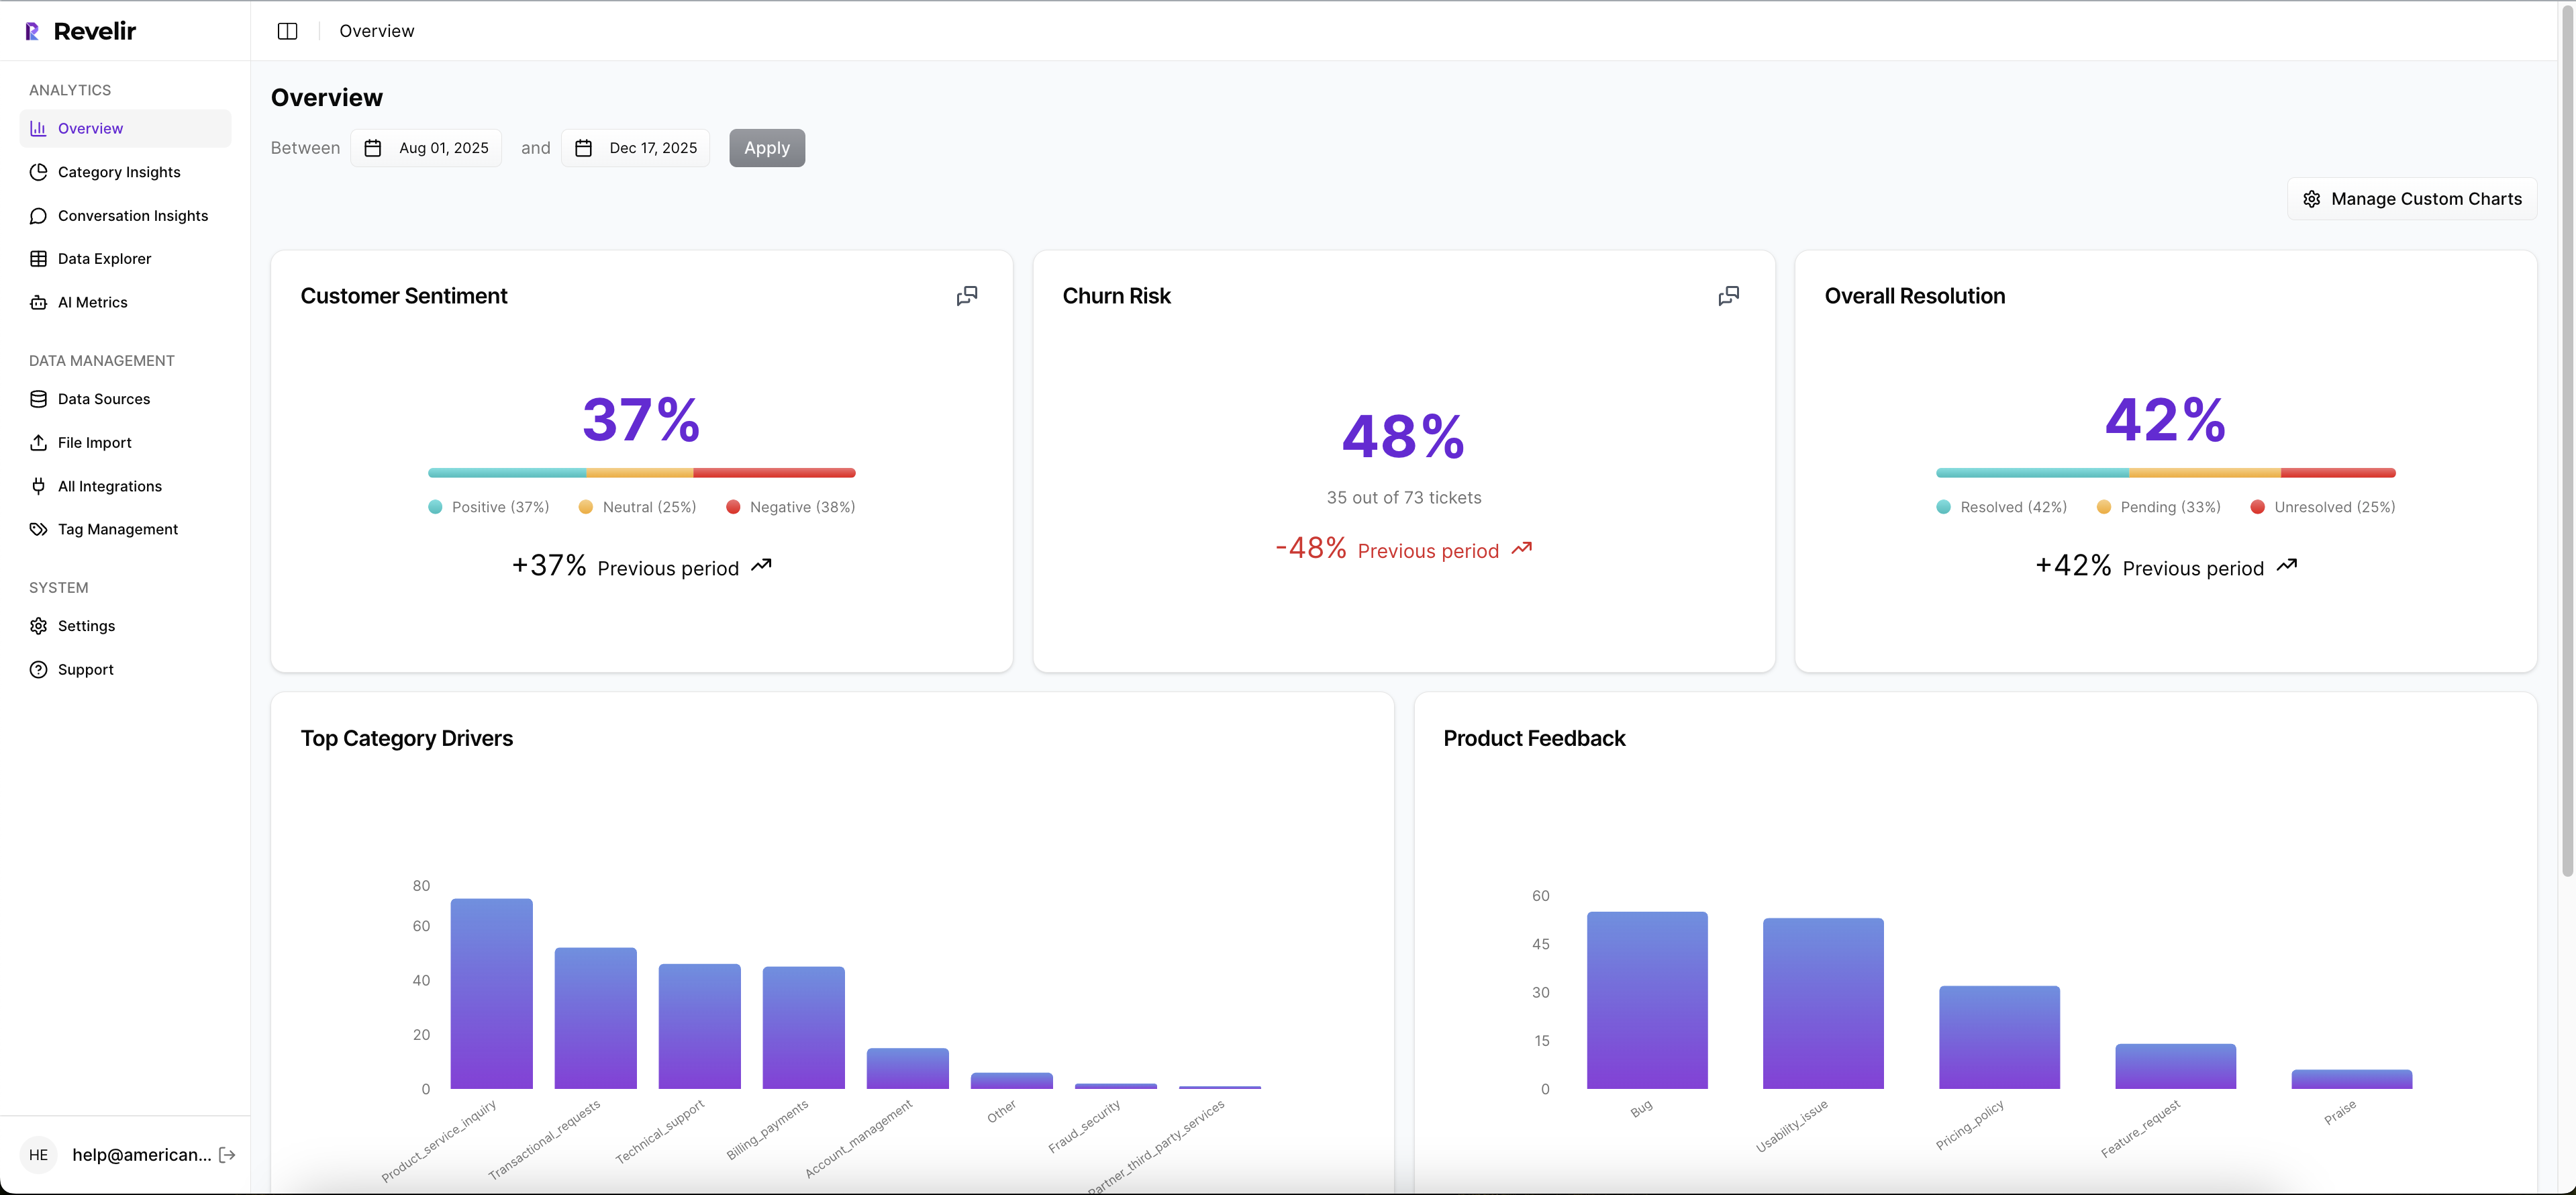
Revelir AI also applies its AI Metrics Engine to structure core signals like sentiment, churn risk, effort, and conversation outcome. Then Custom AI Metrics let your team define the fields that actually fit your business language. Maybe you want to track refund confusion. Maybe implementation friction. Maybe upsell opportunity. That's a huge difference from generic score tools that force every company into the same model.
Drivers, tags, and traceable evidence
The Hybrid Tagging System is where this gets practical. Raw Tags surface granular themes across the ticket set, while Canonical Tags give you normalized categories for reporting. Drivers then roll those patterns up into leadership-friendly themes that answer the question behind the question: why is this happening?

Revelir AI doesn't stop at the aggregate. Evidence-Backed Traceability links every metric back to source conversations and quotes, and Conversation Insights lets your team drill into transcripts, summaries, tags, drivers, and AI metrics ticket by ticket. That's what makes the insight defensible. You're not asking product or leadership to trust a black box. You're showing the receipts.
Analysis without rip and replace
Revelir AI connects through Zendesk Integration or CSV Ingestion, so teams can start with existing support data instead of launching a whole platform migration. Inside the product, Data Explorer gives you that pivot-table-like workspace to filter, group, sort, and inspect tickets across sentiment, churn risk, effort, tags, drivers, and custom metrics. Analyze Data then lets you summarize those metrics by dimensions like Driver, Canonical Tag, or Raw Tag and jump back to the underlying tickets.

If your team wants to keep using existing reporting workflows, API Export can push structured metrics outward after the analysis is done. That's why the value isn't "another dashboard." It's a cleaner path from messy tickets to decisions that hold up under pressure.
If the real test of analyzing customer support conversations is whether an insight survives a skeptical room, this is the part that matters most: can someone click, inspect, and verify?
What good analysis changes next
Analyzing customer support conversations well doesn't just make reports look smarter. It changes who wins the argument in the room. Not the loudest person. The person with evidence.
It's usually that simple. When you move from samples and scores to full coverage, drivers, and traceable tickets, support stops being a place where problems are logged and starts becoming a place where priorities get clarified. That's a different category of value.
Same thing with trust. If your charts can't survive one skeptical question, they were never insights in the first place.
Frequently Asked Questions
How do I analyze support tickets from multiple sources?
You can easily analyze support tickets from different sources by using Revelir AI's CSV Ingestion feature. Simply export tickets from your helpdesk as a CSV file and upload it to Revelir. The system will parse the data and apply its full tagging and metrics pipeline within minutes. This way, you can ensure that all your support conversations, regardless of their origin, are included in your analysis.
What if my team struggles with inconsistent tagging?
If your team is facing issues with inconsistent tagging, consider using Revelir AI's Hybrid Tagging System. This system combines AI-generated Raw Tags with human-aligned Canonical Tags, allowing you to create a more structured taxonomy. You can merge similar tags, create new categories, and refine your tagging process over time. This helps ensure that your reporting is clear and consistent, making it easier to analyze support conversations.
Can I track custom metrics specific to my business?
Yes, you can track custom metrics tailored to your business using Revelir AI's Custom AI Metrics feature. This allows you to define domain-specific classifiers, such as 'Upsell Opportunity' or 'Implementation Friction', and set custom questions and value options. The results are stored as columns and can be used across filters and analyses, giving you insights that are directly relevant to your business needs.
When should I consider moving to full coverage analysis?
You should consider moving to full coverage analysis when your ticket volume exceeds 1,000 tickets per month. At this point, relying on sampling can lead to missing critical patterns and insights. Revelir AI processes 100% of ingested tickets without sampling, which eliminates blind spots and biases. This ensures that your analysis is comprehensive and provides a clearer picture of customer issues, enabling better decision-making.