

Most teams wait for usage to dip, then scramble. By then, you’re already losing the account. Thirty-day ticket signals that predict churn give you a cleaner, earlier read because support conversations surface friction before dashboards do. When you capture that signal with definitions everyone trusts, you protect revenue and stop the rework loop.
Let’s get practical. You’ll define a clear new-user cohort, extract a small set of repeatable features from early tickets, validate them against a 90-day churn label, and turn the best rules into outreach triggers. We’ll keep it simple, auditable, and fast enough to run monthly without burning time.
Key Takeaways:
- Use a strict 0 to 30 day window on support tickets to predict 90-day churn with earlier, clearer signals
- Engineer lightweight features from tickets: time to first ticket, repeated intents, escalation density, sentiment delta, and effort
- Validate rules against a holdout cohort, then ship 1 to 3 high-precision triggers for CSM outreach
- Keep a monitor bucket for medium-confidence accounts to cut noise while you wait for one more signal
- Close the loop: track outcomes, adjust thresholds, and retire weak signals with evidence from real conversations
Why 30-Day Ticket Signals That Predict Churn Beat Lagging Usage Metrics
Thirty-day ticket signals predict three-month churn faster because support conversations reveal friction earlier than product usage trends. Repeated onboarding intents, escalations, negative sentiment, and high effort show up in tickets within days. If you wait for usage to slide, you pay a cost in lost time, missed saves, and strained teams.
The Overlooked 30-Day Window
Early support tickets are often the first proof that onboarding is off track. You see intent density, rising effort, and tone shifts while usage still looks fine. Define your observation window as day 0 to day 30 post-signup at the account level, then track how these patterns correlate with churn at 90 days. It’s missed revenue protection, not a dashboard hobby.
In our experience, the mistake is treating early tickets as “noise” to be handled ad hoc. They are a dataset. When you structure them and run the same checks every month, you get a consistent read on risk. You also avoid the late scramble that leads to rushed offers or discounts that don’t address the real problem.
What Counts As A Ticket Signal That Predicts Churn?
Not all tickets matter equally. Signals include short time to first ticket, multiple tickets under the same onboarding tag, escalation count, negative-to-negative sentiment across replies, and high Customer Effort. Noise looks like a single low-severity billing question resolved in one reply. Pattern density beats anecdotes. That’s how you avoid false alarms.
Two pointers help. First, define “repeated intent” in plain language, for example three tickets in two weeks under the same canonical onboarding tag. Second, combine dimensions when possible. Negative sentiment plus high effort plus escalation carries more weight than any one of those alone. Simple composites often outperform vague scores.
Let’s Pretend: A Quick Story To Set Stakes
Let’s pretend two accounts land on the same day. Account A opens three onboarding tickets in week one. Two get escalated. Tone turns negative by week two. Effort is high. Account B opens one billing ticket that resolves on first reply. You already know who churns at day 90. The cost of missing Account A’s pattern is not just revenue. It’s backlog, fire drills, and brand damage.
If you’ve lived this, you can feel it. The Monday standup, the nervous update to leadership, the “let’s add a discount” suggestion. This is why an early, evidence-backed trigger matters. You want decisions anchored to clear patterns, not the loudest anecdote.
Define The Cohort And Outcome To Make Ticket Signals That Predict Actionable
Actionable ticket signals start with a tight cohort and a clean churn label. Define new users consistently, lock the 30-day observation window, and align on what churn means within 90 days. If you skip this, you’ll argue definitions later and lose trust in the rules.

Cohort Definition: New User And Observation Window
Set eligibility as signup date through day 30. Scope tickets to that window per account. Exclude legacy accounts and partial data periods where you can’t observe the full window. Capture account metadata you’ll need for stratification, like plan tier and region, because signals can vary by segment. Keep the label aligned with churn within 90 days of signup.
That clock matters. Using “days since signup” instead of “calendar month” avoids calendar bias. For multi-data-source setups, pick a single timezone so windows line up. The goal is a stable cohort you can explain on one slide. If a definition makes you pause, simplify it. Complexity rarely improves signal; it often hides leaks.
Outcome Labeling And Data Hygiene
Define churn with an explicit cancellation event or non-renewal within 90 days. Don’t use vague proxies. Align timestamps to one timezone, deduplicate merged or reopened tickets, and freeze labels for each historical run to prevent leakage. Document edge cases like trials that convert. It’s boring work, but it prevents the wrong fight later.
You’ll catch oddities here. Tickets without transcripts. Reopened threads counted twice. These edge cases don’t just skew counts; they erode trust. When someone says the rule “feels wrong,” it’s usually a hygiene problem. Fix the plumbing once. Lock it in.
What About Multi Seat Or Multi Product Accounts?
For accounts with multiple products, scope to the product tied to the first ticket in the 30-day window. For multi-seat accounts, aggregate features at the account level and use the earliest ticket to start the clock. Record seat count and implementation status as covariates. You want a cohort everyone accepts before you test signals.
There’s a trade-off on granularity. If you go too fine, you drown in exceptions. Too coarse, you blur important patterns. When in doubt, pick the simplest choice that holds across segments, then call out exceptions clearly.
Feature Extraction That Turns Ticket Signals That Predict Into Variables
Feature extraction should be simple enough to run monthly and strict enough to be repeatable. You’re turning conversational noise into a few stable, auditable variables. Focus on timing, repetition, escalations, sentiment shift, and effort.
Timing And Volume Features
Start with time to first ticket, tickets per week, inter-arrival time, reopen count, and escalation count. Bucket by week one, week two, week three to weight recency. Flag a rapid first contact, like a ticket in the first 48 hours, as potential onboarding friction. Keep every definition deterministic so rules don’t drift next month.
Recency often matters more than sheer volume. Three onboarding tickets in week three can be a louder risk than the same count in week one. You can start with a simple weight scheme like 1.0, 1.2, 1.5 by week and only adjust after you validate lift. Resist the urge to overfit. Rules win when they’re stable.
Semantic Tags, Canonical Drivers, And Repeated Intents
Use raw tags for discovery and canonical tags for reporting. Create counts for repeated intents under the same canonical tag, for example three “setup” tickets in two weeks. Roll these up under drivers like Billing or Account Access to make the story leadership-ready. This hybrid layer keeps your features expressive without losing clarity.
Messy tag sprawl is a common failure mode. Canonical tags and drivers prevent that. They also make month-over-month comparisons meaningful. You can tell the story in leadership language, then click into raw tag detail when someone asks for examples. Everyone gets what they need.
Sentiment Delta And Customer Effort Metric
Compute sentiment shift within conversations and across the account’s 30-day set. If sentiment drifts negative and stays there, that’s a risk. Use Customer Effort where present to flag high-effort threads. Combine negative sentiment with high effort and escalation flags into a composite. If effort isn’t available, leave it null. Don’t impute.
One caution. Sentiment alone can be noisy. Pair it with driver context or escalations to reduce false positives. If a composite starts to over-fire, review a handful of conversations to see what’s actually going wrong. Then tighten the definition, not the narrative.
Normalize By Usage And Weight Recency
Normalize ticket counts by active days or logins so high adopters aren’t punished for asking questions. Weight later-week events slightly higher if historical data supports it. Start simple. Adjust only after you see clear lift in a holdout set.
If you lack usage data, document that gap. You can still run ticket-based signals, but you should call out where normalization would change confidence. Clarity beats false precision.
For background on common churn modeling approaches, the Braze guide on churn prediction and this overview of customer churn analysis offer helpful framing without getting lost in theory.
Validate That Your Ticket Signals That Predict Actually Do
Validation makes the case. You’re not chasing a perfect model. You’re proving that a small set of clear rules beats your current baseline in a clean holdout, with lift you can defend.
Build A Holdout Cohort And Baselines
Split historical accounts by signup month into development and holdout sets to avoid leakage. Build simple rules in the development set. In the holdout, compare those rules to two baselines: random assignment and a product-only proxy like low logins. You want to show ticket signals add real value.
This step prevents a common mistake. Teams celebrate a rule that looks great on the data it was born from. Then it fails quietly in the wild. A time-based split and a dull baseline comparison keep you honest. If the rule still beats the baseline, you’ve got something.
Compute Lift, Precision, And Recall The Right Way
Define high risk as “rule fires.” Precision is the percent of flagged accounts that churn within 90 days. Recall is the percent of churned accounts the rule caught. Lift is precision divided by your overall churn rate. Start with high-precision rules for CSM action. Then add a medium-confidence monitor to watch.
Publish the confusion matrix. Make the trade-offs visible. You’ll get better alignment when everyone sees the same numbers instead of debating gut feel. And if someone asks whether the rule is “accurate,” redirect to precision, recall, and lift. Those are the metrics that matter for action.
Run Significance Tests And Document Stability
Quantify confidence with proportion tests that compare your rule’s precision against baselines and produce confidence intervals. Check stability across plan tiers and regions. If a signal varies widely, scope it to the segments where it holds. Version your rules so analytics, CSM, and product can replicate results later.
One trick that works: add a short section in your doc for “known failure modes.” It keeps you honest and makes change management easier. When the signal drifts, you already know where to look first.
If you want more context on churn methods and modeling choices, this primer on data-driven churn approaches is a straightforward read.
Operational Thresholds And Playbooks For Ticket Signals That Predict Churn
A signal without a playbook is just another alert. Turn your validated rules into clear, repeatable actions with measured outcomes. Then improve the system monthly.
High Precision Triggers For CSM Outreach
Pick 1 to 3 rules with strong precision. For example, time to first ticket under 48 hours plus two or more onboarding drivers plus negative sentiment or high effort. Calibrate thresholds using your holdout results. Document what the CSM does within 24 hours, who to loop in, and how you’ll measure success beyond outreach volume.
Make the steps concrete. What to send. What to ask. When to escalate to product with examples. If the rule fires outside business hours, what’s the next best time to reach out. The more specific you are, the less variance you’ll see in outcomes.
Medium Confidence Monitor Groups
Create a separate bucket for accounts that show risk patterns but not enough density for outreach. Review weekly. Sample a handful of conversations. Wait for an additional signal before contacting. This reduces noise while you keep vulnerable accounts on your radar. Define a clear promote rule from monitor to outreach.
This is where many teams overreact. They see smoke and sprint. Then they train the org to ignore alerts. A steady review cadence and a promote threshold protect attention and outcomes.
How Do You Keep False Positives Low?
Here’s the short answer. If precision slips, read examples. Tighten canonical mappings, raise the repeated intent threshold, or remove a weak driver. Also check for drift in tagging or ingestion that changed how you compute features. Don’t add more rules until the core ones are clean.
A single list of “exclusions” helps too. For instance, exclude tickets from a known incident window or a billing system outage that affected everyone. That’s not churn risk. That’s a separate problem with its own fix.
Experiments And Closed Loop Learning
Instrument playbooks with outcomes like churn prevented, sentiment improved, or reduced escalations. Where you can, run A or B tests on timing or content. Feed results back to analytics so thresholds evolve. Hold a monthly forum where CSMs bring examples, product reviews driver patterns, and analytics proposes tweaks based on evidence.
If you like practical templates, this overview of churn-risk playbooks triggered by support signals is a useful reference to spark ideas.
After you’ve mapped the new way, you might want to see it working end to end with your own data. Curious how it looks in practice? See how Revelir AI works
How Revelir AI Operationalizes Ticket Signals That Predict Churn
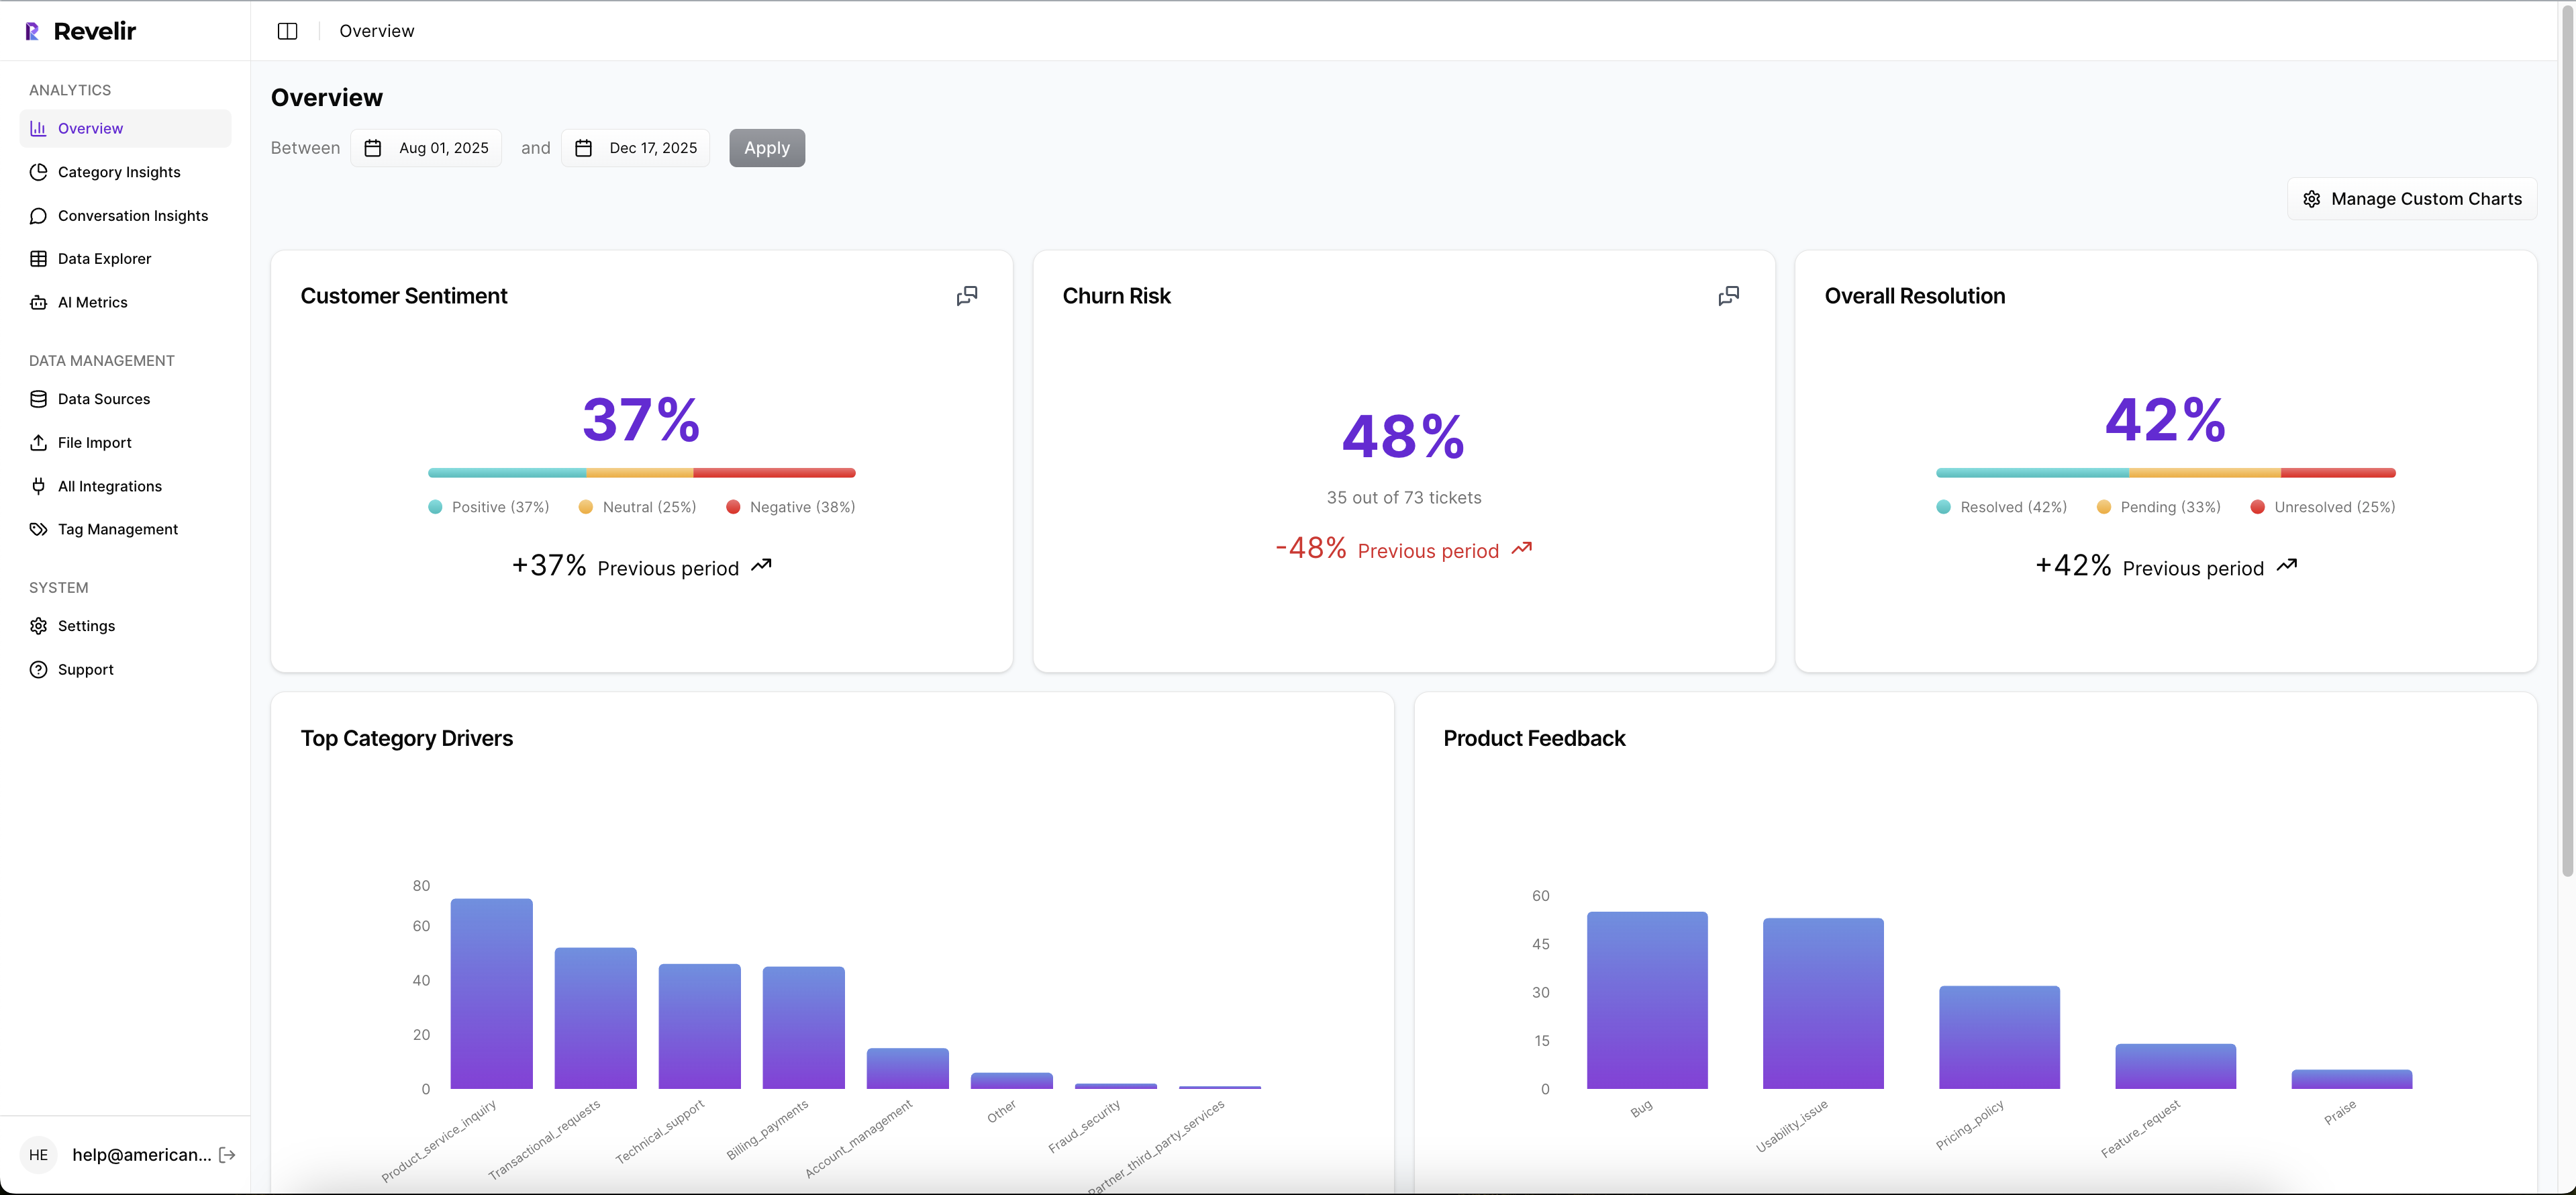
Revelir operationalizes this approach by processing 100 percent of your support conversations and turning them into structured, traceable metrics you can pivot in minutes. You get sentiment, churn risk, effort, raw tags, canonical tags, and drivers as fields you can filter, group, and validate with a click.
Full Coverage Processing And Data Explorer For Feature Extraction
Revelir reviews every conversation, not a sample, and records metrics like Sentiment, Churn Risk, and Customer Effort when present. It also applies raw tags for discovery and lets you maintain canonical tags and drivers for clarity. In Data Explorer, you filter to the new-user cohort and run grouped views by driver or tag to compute counts and repeated intents quickly.

That full-population view matters. You stop arguing about what’s representative and start deciding what to fix. And when someone asks for proof, you click the number and open the exact tickets behind it. No copy-paste hunts. No fragile spreadsheets.
Analyze Data And Canonical Drivers To Build Stable Signals
Use Analyze Data to aggregate sentiment, churn risk, and effort by canonical tag or driver. This is how you compute escalation density under Onboarding or repeated intents under Account Access without manual stitching. Because mappings are canonical, results stay consistent month over month and present cleanly to leadership.
You can move from grouped patterns to action in a single review. Drivers help you focus the roadmap conversation. Canonical tags keep the language stable. If a category shifts, you update the mapping once and your views stay clean.
Conversation Insights For Evidence And Recalibration
When a trigger looks noisy, click through to Conversation Insights, read the transcript, and review the AI-generated summary with assigned tags and metrics. This keeps trust high and helps you spot edge cases where a mapping needs a quick adjustment. It also gives CSMs and product teams the real quotes they need for urgency.
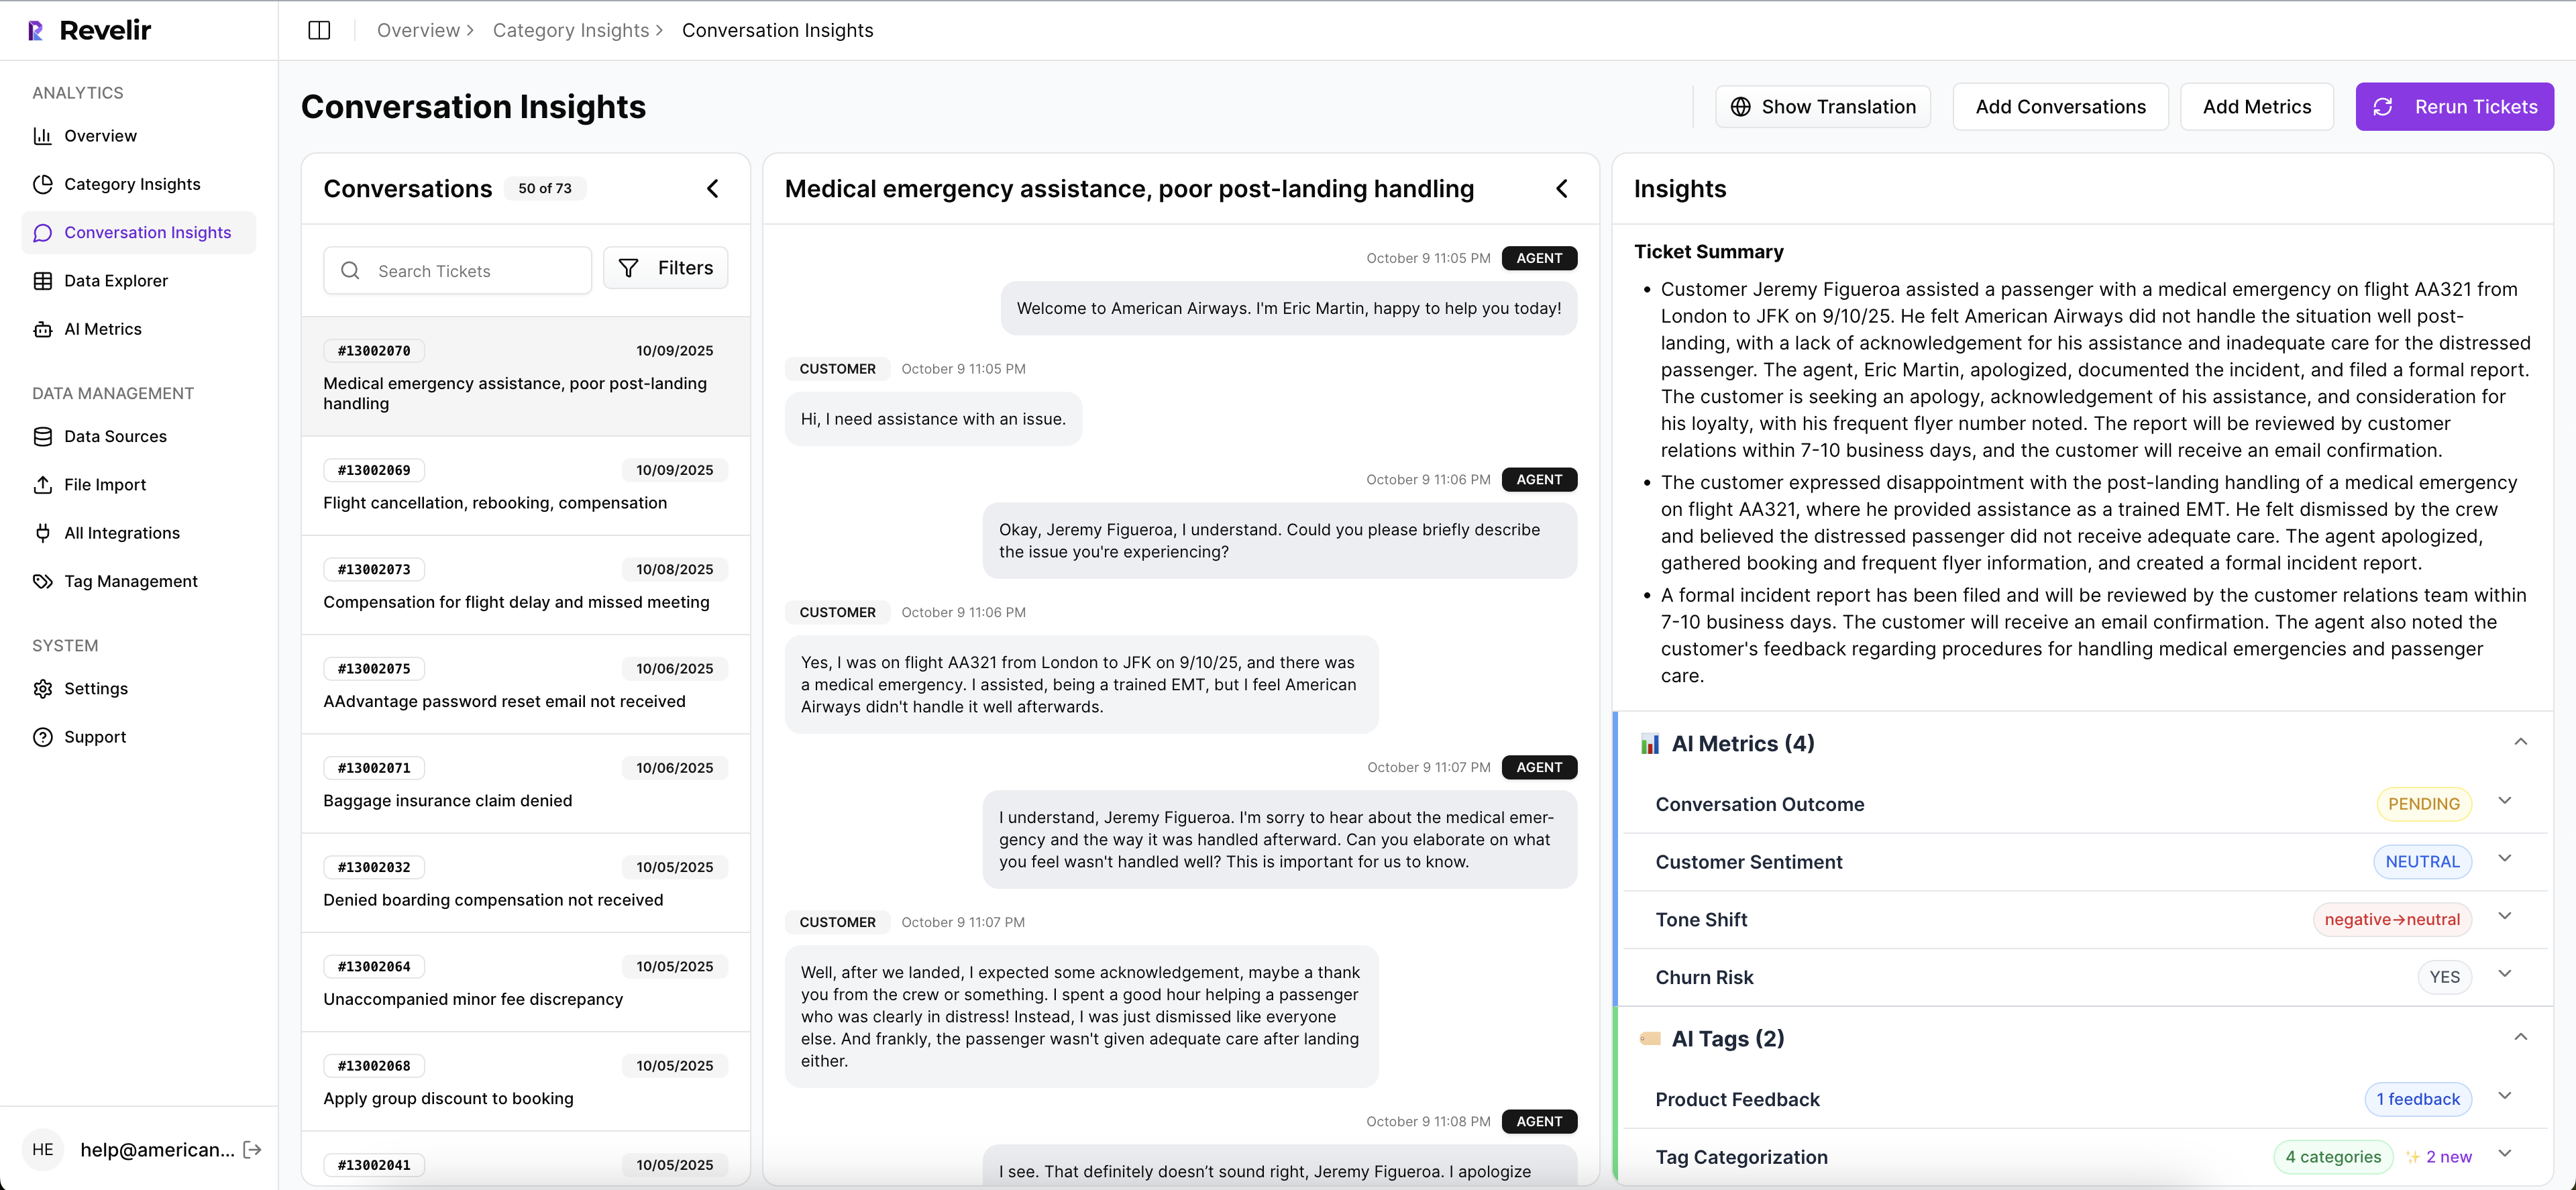
These audits are your guardrail against drift. A five-minute read can explain a precision dip better than a chart. Then you fix it at the source and move on.
Export Metrics To CSM And Product Workflows
Revelir supports analytics in-platform and lets you export structured fields to your downstream systems through API or reporting. That is how CSMs action high-precision triggers, and how product tracks top drivers over time. Close the loop by bringing outcomes back into your views, then adjust thresholds in the next cycle based on evidence.
We’ve seen teams move from sampling and debate to full-coverage, evidence-backed decisions with minimal lift. Minutes instead of days. Clean thresholds you can defend. Fewer missed saves. If you want that change with low friction, Learn More. That is what Revelir delivers.
Before you wrap up, one detail that often gets missed. You want a source that shows both scale and traceability. The Braze primer on churn prediction and Sprinklr’s view on customer churn analysis echo the same theme. Signals earn trust when they are measurable and auditable. Revelir was built with that in mind.
Ready to put these triggers in front of your team tomorrow? Get started with Revelir AI (Webflow)
Conclusion
Early ticket signals are faster and, when defined well, more reliable than waiting for usage to sag. You set a 30-day observation window, extract a handful of stable variables, validate against a hard 90-day churn label, and ship high-precision triggers with clear playbooks. Then you learn. With full coverage and traceable evidence, the risk of guesswork drops. The meetings change. And saves happen while they still count.
Frequently Asked Questions
How do I set up Revelir AI for my support tickets?
To set up Revelir AI, start by connecting your helpdesk system, like Zendesk. This allows Revelir to automatically ingest your support tickets. Once connected, verify that the ticket metadata and conversation text are correctly imported. After that, you can refine your tagging system by creating canonical tags that reflect your business language. Finally, enable core AI metrics such as sentiment and churn risk to start analyzing your data effectively.
What if I want to track specific customer segments?
You can track specific customer segments in Revelir AI by using filters in the Data Explorer. Start by applying filters based on customer attributes, such as plan type or account status. This allows you to isolate tickets related to those segments. Additionally, you can analyze metrics like churn risk and sentiment to understand how different segments are performing, helping you tailor your outreach and support strategies.
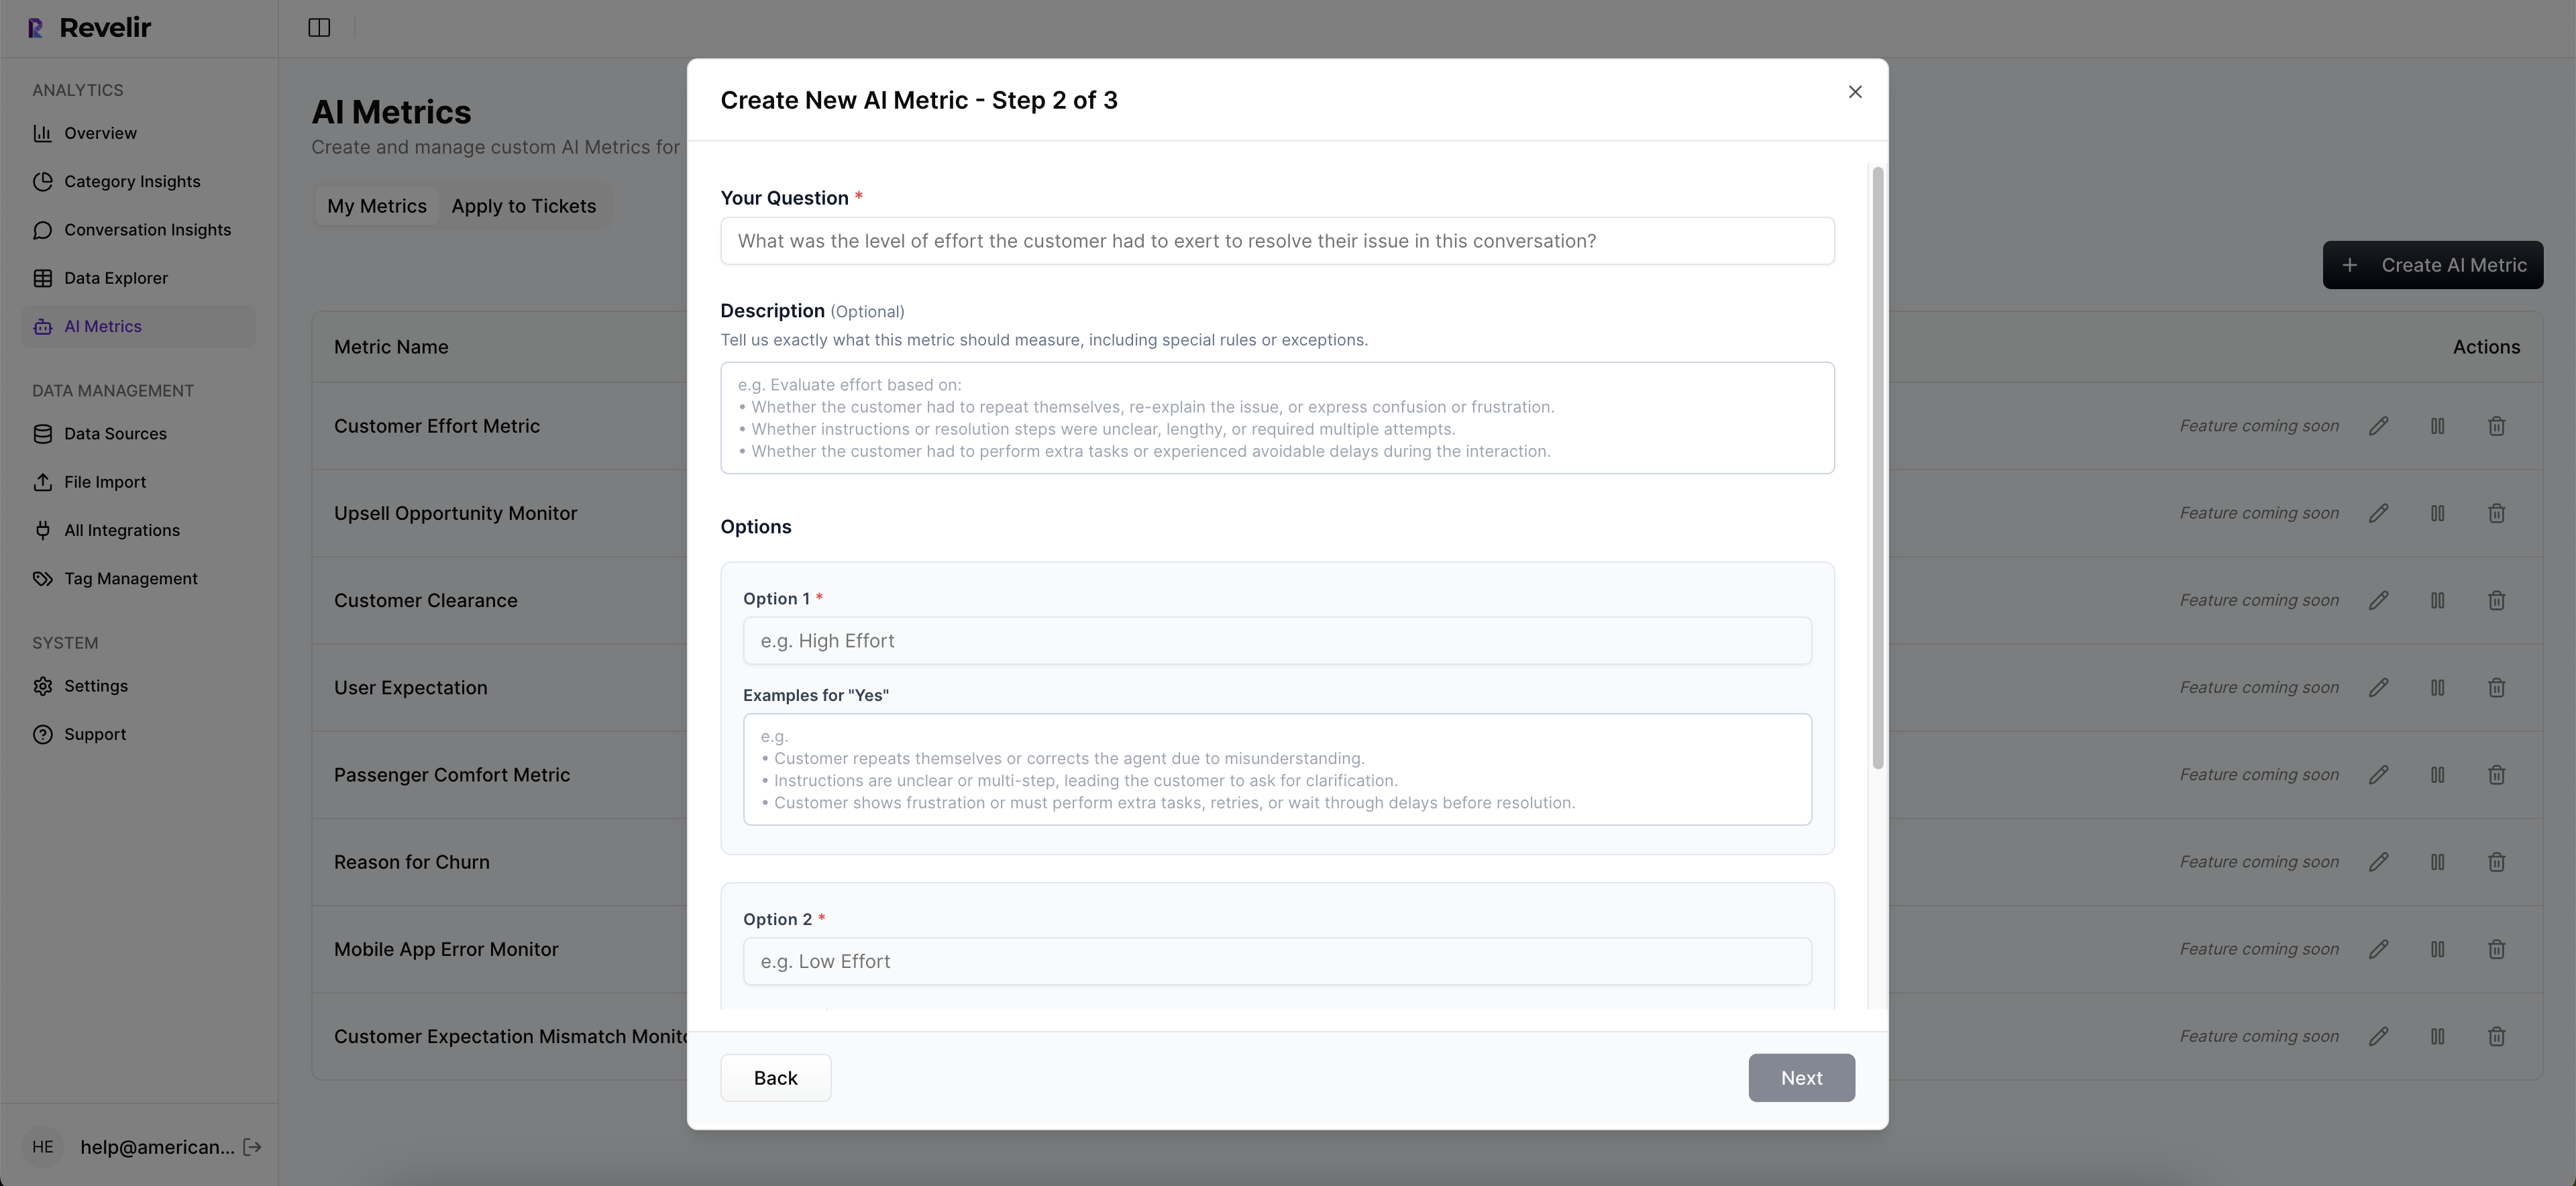
Can I create custom metrics in Revelir AI?
Yes, you can create custom metrics in Revelir AI to match your specific business needs. During the setup process, define what metrics are important to you, such as 'Upsell Opportunity' or 'Reason for Churn.' Once defined, Revelir will apply these metrics consistently across your conversations, allowing you to gain deeper insights tailored to your operational goals.
When should I validate insights from Revelir AI?
You should validate insights from Revelir AI regularly, especially after significant changes in your support processes or product updates. Use the Conversation Insights feature to drill down into specific tickets that generated key metrics. This helps ensure that the AI-generated insights align with real customer experiences and that your metrics remain trustworthy and actionable.
Why does Revelir AI emphasize 100% conversation coverage?
Revelir AI emphasizes 100% conversation coverage because it ensures that no critical signals are missed. By analyzing every support ticket, you can detect patterns and issues that might be overlooked with sampling methods. This comprehensive approach allows you to make informed decisions based on complete data, leading to more effective customer experience strategies and better retention outcomes.