

Most teams look at sentiment charts and hope the fix is obvious. It’s usually not. Scores whisper “something’s off” but don’t say what to ship next. That’s why meetings stall. Nobody’s checking the drivers or the quotes behind the number. Same thing with score-only dashboards, clean visuals, including research, thin direction.
Here’s the thing. You move work when you can say, “Negative sentiment spiked in Billing among new customers. Here are three quotes showing the exact friction.” That’s a plan, not a posture. The path there is a pipeline: structure the text, group it into drivers, and attach evidence you can show in the room without hedging.
Ready to get started? Learn More.
Key Takeaways:
- Treat sentiment as the smoke alarm; drivers and quotes are the diagnosis and plan
- Build a minimal taxonomy (raw tags → canonical tags → drivers) to make text pivotable
- Keep transcripts intact and link every aggregate to the exact tickets behind it
- Quantify the cost of sampling and noisy labels to build urgency for change
- Validate weekly with a small human review to maintain trust without slowing down
- Use grouped analysis by driver to prioritize fixes and measure impact
Why Sentiment Labels Alone Stall Action
Sentiment labels highlight change, but they rarely tell you what to fix next. The win is connecting those labels to drivers and the underlying conversations that make the problem real. When you click the count and show quotes, debate slows and decisions accelerate.
The Gap Between Scores And Fixes
Sentiment shifts are a smoke alarm, not a diagnosis. A red bar doesn’t explain whether onboarding confusion or a brittle refund flow is the culprit. Without grouped insight, you’re stuck in hand, wave mode, proposing generic content or broad training that may not move the metric.
The fix is simple but specific: pivot sentiment by a meaningful dimension and point at evidence. “New customer negative sentiment under Onboarding” is a direction; “setup step 3 requires manual verification, here are the quotes” is a plan. You need that second sentence. Otherwise engineering ships guesses, and support volume stays high.
What gets teams in trouble is assuming the label is the insight. It isn’t. Labels tell you where to look. Drivers and quotes tell you what to do. If you build your workflow to jump from score to driver to transcript, you stop arguing about anecdotes and start sequencing fixes.
What Is A Driver And Why It Matters
Drivers roll granular tags into themes leadership understands, Billing, Onboarding, Performance, Account Access. They’re the bridge from messy language to clean reporting. When negative sentiment clusters under a driver, you can size it, assign owners, and track progress without changing the taxonomy every week.
Think about leadership updates. Nobody wants to parse 200 raw tags. They want three drivers and the deltas. Drivers make that possible without losing nuance, because you can always drill down to the raw tags and transcripts that feed them. That’s how you keep both clarity and credibility.
It’s usually the missing layer. Teams try to go straight from scores to fixes. Without drivers, they chase symptoms, not causes. With drivers, stories get shorter, decisions get faster, and the same few categories anchor the narrative month over month.
Why Does Evidence Win The Room?
Because someone will ask, “Can you show me a ticket?” Always. If you can click the count and pull up three representative transcripts, the air changes. People stop debating methodology and focus on tradeoffs. Evidence reduces friction. It builds shared reality.
Transparent, traceable AI is part of that trust. When each metric links back to the exact conversation and quote, your findings are auditable. That aligns with guidance on explainability from sources like the transparent AI reporting literature. You don’t need perfect accuracy. You need visible reasoning and examples that make sense to a human.
Make this your default: every aggregate must be one click from the conversations behind it. Do that, including research, and you won’t have to defend your charts. You’ll spend time on the prioritization that actually changes outcomes.
Your Real Bottleneck Is Structure, Not More Data
The real bottleneck isn’t a lack of tickets; it’s the absence of structure. Support text starts unstructured, so dashboards can’t explain “why” without a tagging and metrics layer. You need raw tags for discovery, canonical tags for clarity, and drivers for leadership communication.

What Traditional Dashboards Miss
Dashboards are great, once the data is structured. Unstructured support text isn’t. That’s why sentiment sits in isolation and dies in meetings. The machine can render a perfect chart, but if you can’t pivot by drivers or show quotes, nobody trusts the story enough to act on it.
The structure you need isn’t complicated. Raw tags capture granular signals and surface emerging themes. Canonical tags normalize the chaos into categories that match your company’s language. Drivers roll those categories into a strategic lens. Now your sentiment trend can be explained in a way leadership understands and can fund.
Aspect-level extraction research shows value in moving from vague sentiment to actionable categories, which supports the case for this layering approach (see the SIGIR work on aspect extraction for e-commerce reviews). The lesson holds in support: move from score → aspect/driver → quote, or you’ll spin.
Designing Structure That Survives Reality
Two design choices matter more than people admit. First, preserve the conversation structure. Keep message boundaries, speakers, timestamps, and metadata like channel and plan tier. Don’t collapse threads into a single blob if you want reliable insights and per, turn reasoning later. That’s where “what happened” lives.
Second, start with a minimum viable taxonomy. A dozen to two dozen canonical tags is plenty at first. Map AI-generated raw tags into those canonicals, and attach canonicals to drivers. Expand only when confusion appears. It keeps reports clean and prevents the tag sprawl that makes everyone skeptical.
This is where teams over-engineer and stall. Don’t. Get the bones right. Message structure intact. A lean set of canonicals. Clear drivers. Then iterate as reality teaches you, the taxonomy can evolve without breaking every chart.
The Hidden Costs Of Acting On Noisy Labels
Noisy, untraceable labels look fast but cost you later. Sampling hides early signals. Misprioritized work creates frustrating rework. And trust breaks the moment you can’t trace a number to the tickets. The costs stack across quarters if you let them.
The Sampling Trap You Can Measure
Let’s pretend you handle 1,000 tickets a month. Sampling 10% at three minutes each is five hours for a partial view. Reviewing all tickets by hand would cost 50 hours, time you don’t have. Meanwhile, subtle onboarding friction and early churn cues slip past the sample. They always do.
This isn’t hypothetical. It’s operational math, like the cost models described in peer-reviewed operations research. Sampling delays detection, which inflates escalations, which drains capacity, which worsens sentiment, a loop budgets can’t absorb. The partial view is more expensive than it looks.
You don’t need heroics to fix it. You need coverage. Analyze 100% of conversations automatically, then pivot by driver. You’ll catch early signs and avoid the downstream pile, ups that chew through headcount and patience.
Misprioritized Work And Frustrating Rework
When labels are noisy and untethered to evidence, teams ship generic fixes. More help docs. Broad training. A bandaid for a deeper wound. Engineering spends cycles on low, impact work, support volume stays high, and three sprints later you revisit the same issue with less goodwill.
Drivers change that. “Negative sentiment is concentrated under Billing > fee confusion among new accounts” is actionable. Now you can size the problem credibly, show representative quotes, and schedule a targeted change. The work lands, and sentiment moves. No guesswork, less rework.
It’s usually not a massive miss. It’s a thousand paper cuts. Clean drivers and linked quotes stop the bleeding. They reduce the cycle of “ship, hope, repeat” that burns teams out.
Where Does Trust Break In The Room?
It breaks the second someone asks, “Where did this number come from?” and you can’t click into tickets. If your charts are untethered from transcripts, stakeholders hesitate. Finance asks for proof. Product asks for examples. Confidence evaporates.
The fix is straightforward: every aggregate must link to the conversations that created it. Show the list. Open a transcript. Pull a quote. The traceable pattern mirrors best practices in explainable systems described in multi-stage LLM pipeline research. You don’t need to turn everyone into an analyst. You just need to make auditing obvious.
Do this consistently and the culture changes. Meetings shift from challenging the data to challenging the plan. That’s progress.
Make The Pain Vivid So Teams Move
People act when they feel the problem, not when they see another chart. Evidence makes the pain vivid, fast. Use grouped views to find the pattern, then surface transcripts and quotes that put everyone in the customer’s shoes.
When Your Biggest Customer Hits A Wall
Picture a major account stuck in an account access loop. Multiple messages. Escalating tone. Missed deadlines. If your system flags the driver and links to those quotes instantly, Customer Success and Product can align in minutes. The handoff becomes, “Here’s the pattern. Here are the examples. Here’s the fix.”
Without that, you’re debating anecdotes and arguing about representativeness. The risk creeps into renewal conversations before anyone mobilizes. Early risk signals hide in the text; surfacing them quickly is the point. That’s what keeps revenue steady and teams sane.
Small note: you don’t need 20 examples. Two or three crisp quotes do the job. Move fast, not performatively.
The Leadership Meeting That Stalls Out (And How To Prevent It)
You present a downward sentiment trend. Someone asks, “What’s causing it?” If you can show drivers with representative tickets, momentum holds. If not, next steps get punted to “more analysis,” and the quarter keeps slipping.
The antidote is a simple workflow: group sentiment by driver or canonical tag, then click into a few tickets to validate the pattern. If it holds, you’ve got the story and the plan. If it doesn’t, you’ve learned fast and avoided a wild, goose chase. Frontline teams buy in when the examples match what a human would say.
Want to see this flow in a real product? If you’re curious, See How Revelir AI Works (https://https://tryrevelir.com).
A Practical Pipeline That Turns Labels Into Drivers And Evidence
The pipeline is straightforward: preserve structure on ingest, convert text into layered tags and metrics, and make evidence traceable. Validate lightly, often. You’ll move from “scores” to “decisions” in days, not months.
Ingest And Normalize Conversations (The Foundation)
Start by defining the fields you’ll collect: ticket and message IDs, speaker, timestamps, channel, plan tier, and any custom metadata you care about. Preserve transcript structure as an ordered list of messages, don’t flatten threads into a single blob unless you want to lose meaning at the turn level.
Support two ingestion paths. Use a direct helpdesk integration for ongoing sync so your analysis stays fresh. Use CSV uploads for pilots and backfills when you’re testing or importing historical data. Keep imports idempotent to avoid duplicates and ensure re-runs don’t scramble what you’ve already processed.
With structured ingest, you unlock per, turn reasoning and later reconciliation into conversation, level metrics. That’s a mouthful. Practically, it means you can both analyze the whole and zoom into the parts without losing context.
Build The Tagging And Taxonomy Layer (From Discovery To Clarity)
Use AI to assign granular raw tags per conversation, fine, grained signals like billing_fee_confusion or account_lockout. Keep prompts simple and business, agnostic initially. Limit tag count per ticket and set confidence thresholds to reduce noise. Raw tags are for discovery, not board slides.
Then map raw tags into a small set of canonical tags aligned to your company’s language, and attach each canonical to a driver. Start manual. Capture mapping rules. Let the system learn associations over time. Review merges and reassignments regularly to avoid tag proliferation and keep reports clean.
The result is a stable lens: raw tags for emergence, canonical tags for consistency, drivers for leadership communication. Now your sentiment labels connect to categories people recognize and fixes they can own.
Make Metrics, Evidence, And Trust Operational (End-To-End)
Attach sentiment at the conversation level, and when it matters, compute per, message sentiment and reconcile via simple rules (e.g., recency, weighted majority). Store both so analysts can audit edge cases and improve prompts over time. This multi, level approach aligns with guidance on structured inputs and aggregation in multi-stage LLM pipelines.
Make evidence traceability non, negotiable: every aggregate should be one click from the exact tickets, transcripts, AI summaries, and tags that produced it. Extract two to three canonical quotes per top driver for leadership packs, and keep ticket IDs visible for auditability. Layer in a light, weekly human review of a small sample from top drivers, adjust mappings or thresholds, and track drift and anomalies over time.
Trust isn’t an afterthought here. It’s designed in. Small, consistent validation beats big, sporadic “quality sweeps” every time.
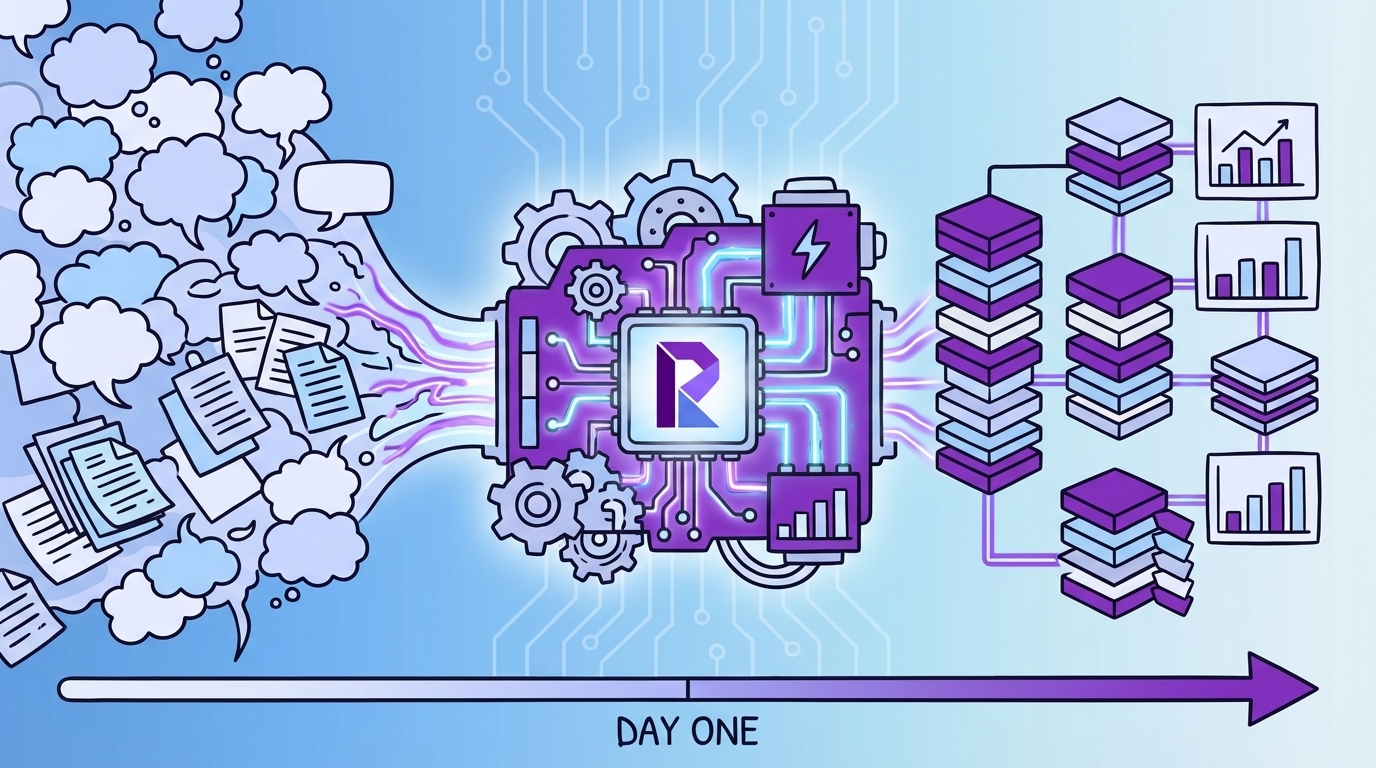
How Revelir AI Makes This Operational On Day One
Revelir AI turns this playbook into a working system on day one. It analyzes 100% of your support conversations, structures them into metrics and layered tags, and keeps every chart linked to the exact tickets behind it. You get coverage, clarity, and credibility, without building the plumbing yourself.
Full-Coverage Processing And Grouped Analysis
Revelir AI processes 100% of uploaded or ingested tickets, no sampling, so you avoid bias and late detection. Every conversation is enriched with AI metrics like sentiment, churn risk, and (when available) customer effort. From there, the Data Explorer lets you filter and pivot by drivers, canonical tags, or segments in seconds.

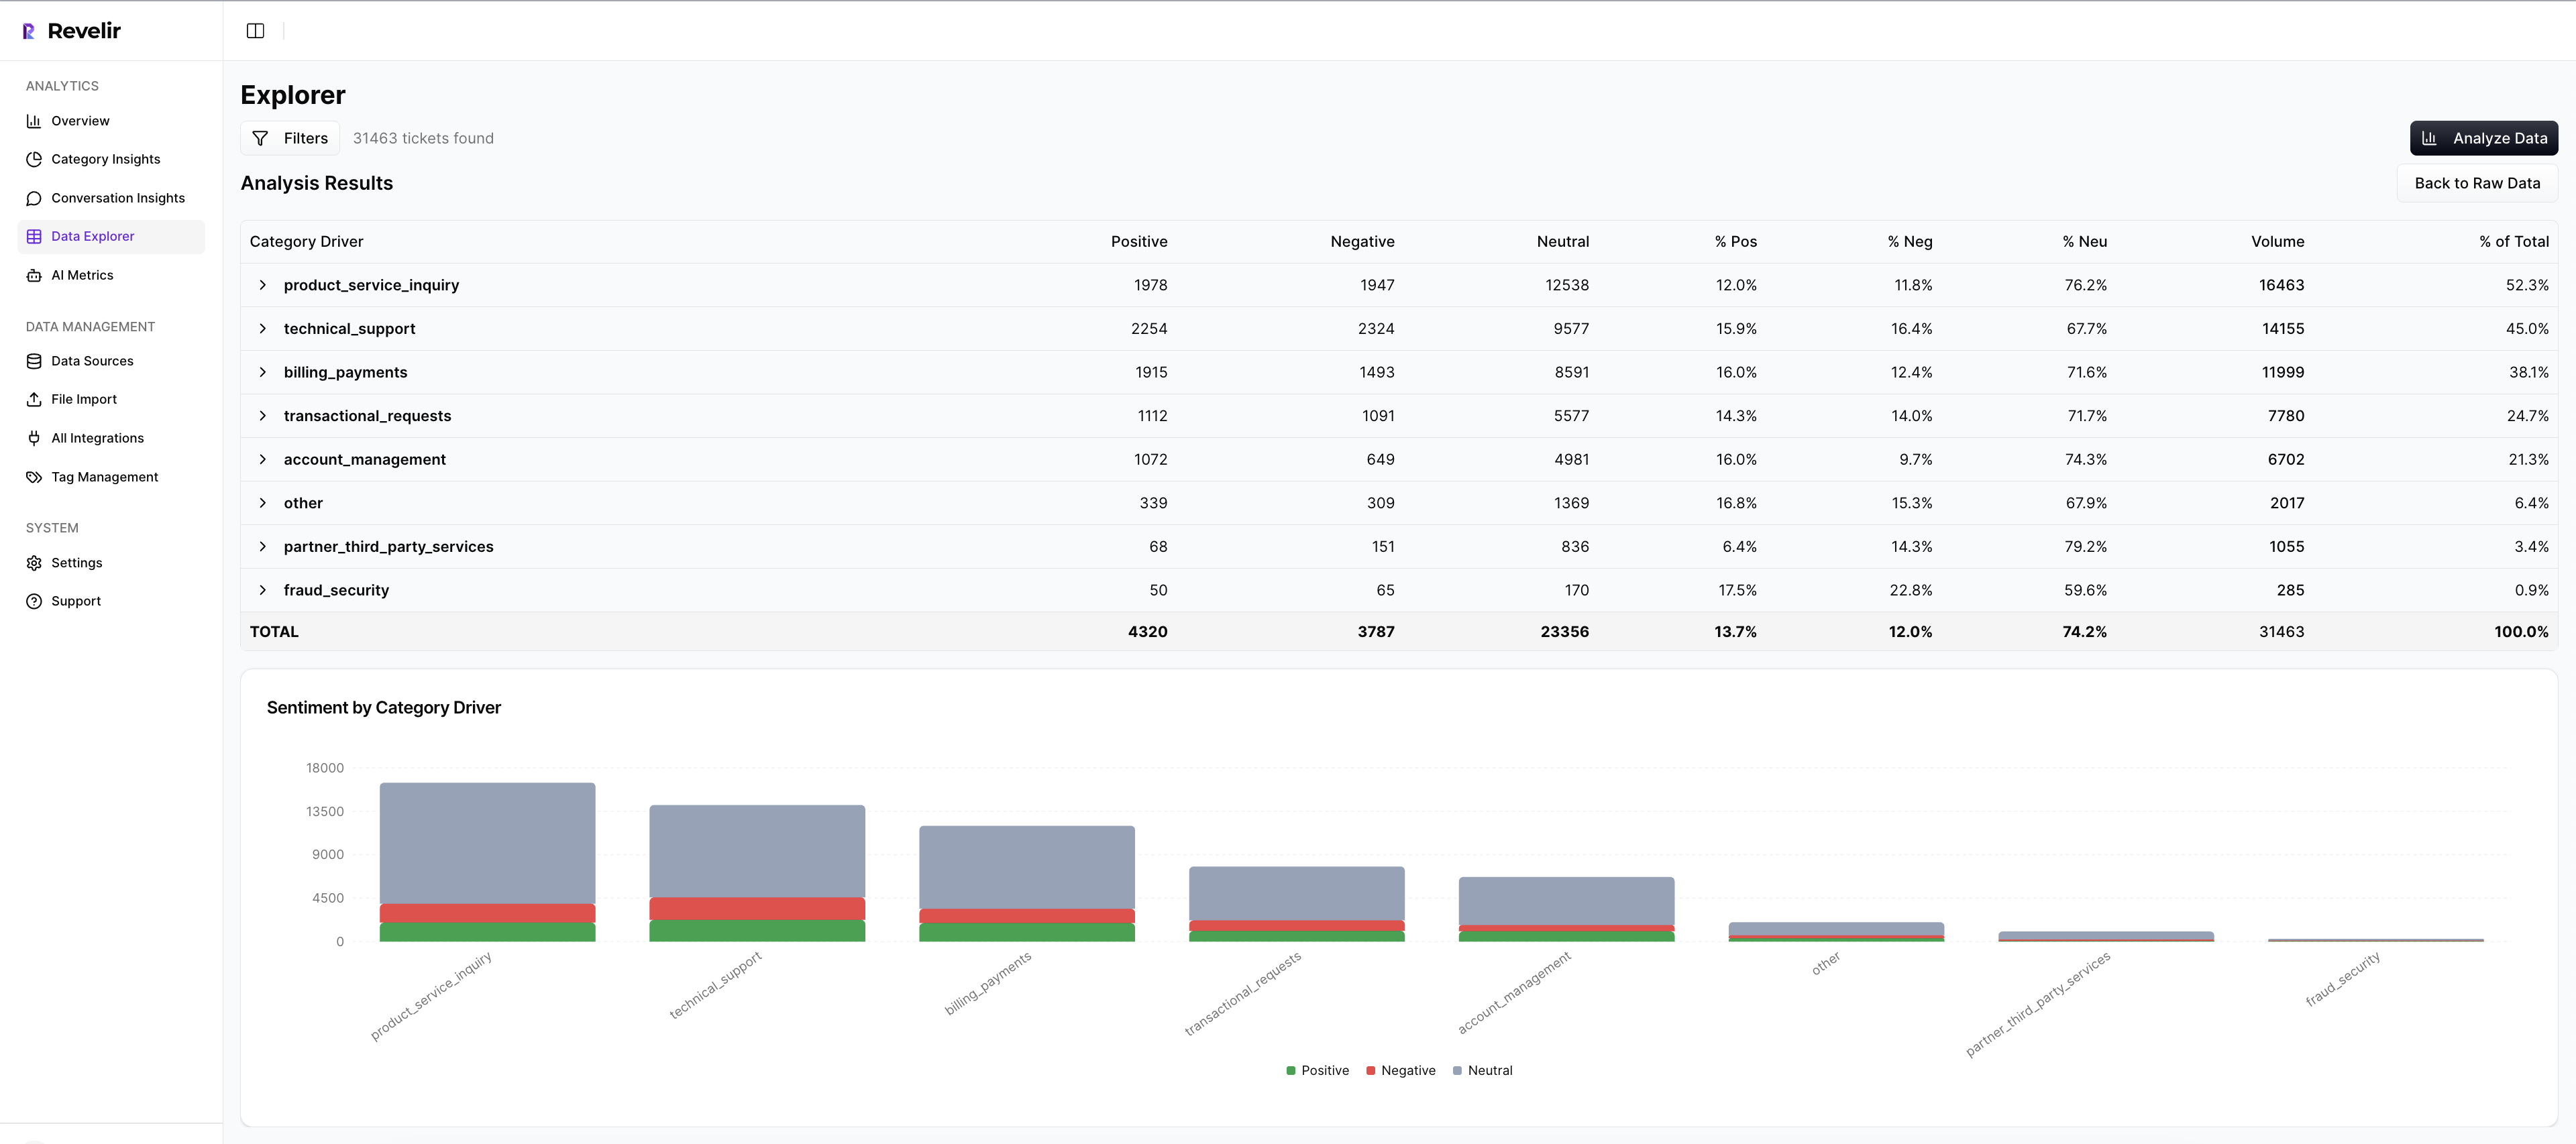
Analyze Data summarizes results by your chosen dimension, showing distributions and counts, then it keeps the path to evidence open. You can move seamlessly from “What’s driving negative sentiment?” to the exact tickets that prove it. This directly addresses the measurable costs of partial views and the delays they create.
Hybrid Tagging, Drivers, And Evidence Traceability
Revelir AI generates raw tags automatically for discovery, then rolls them up into canonical tags that match your business language. Canonicals attach to drivers so leadership can see the big picture without losing the source detail. Over time, mappings improve as the system learns, which keeps reports consistent and tidy.

Crucially, Revelir AI preserves traceability everywhere. Click any aggregate value, “36 negative sentiment tickets under Billing”, and jump into Conversation Insights with full transcripts, AI summaries, tags, and metrics. That’s how you end the “show me an example” challenge in seconds and keep momentum in the room.
If you want to move from labels to drivers and quotes using your own data, you can start quickly. Curious what it looks like live? Learn More.
Conclusion
Sentiment tells you something changed. Drivers and evidence tell you what to do about it. When you preserve conversation structure, keep a lean taxonomy, and make every chart one click from the conversations behind it, you stop debating samples and start shipping fixes that move the numbers.
That’s the shift: from score, watching to evidence, backed decisions your teams trust.
Frequently Asked Questions
How do I analyze negative sentiment in customer tickets?
To analyze negative sentiment in customer tickets using Revelir AI, follow these steps: 1) Open the **Data Explorer**. 2) Apply a filter for **Sentiment = Negative**. 3) Click on **Analyze Data** and select **Sentiment** as the metric to analyze. 4) Group the results by **Driver** or **Canonical Tag** to see which categories are driving negative sentiment. This will help you identify specific issues, such as billing or onboarding problems, that need addressing. You can then click into the results to review individual conversations for context and evidence.
What if I need to prioritize fixes based on customer feedback?
If you need to prioritize fixes based on customer feedback, use Revelir AI's **Analyze Data** feature. Start by filtering your dataset for the last 30 days to capture recent trends. Then, run an analysis by selecting metrics like **Sentiment**, **Churn Risk**, or **Customer Effort**. Group the results by **Canonical Tag** to identify which issues are most prevalent. This approach allows you to see not only the volume of tickets but also the severity of the issues, helping you prioritize the most impactful fixes first.
Can I track customer effort in support tickets?
Yes, you can track customer effort in support tickets using Revelir AI. When your dataset includes enough conversational cues, Revelir assigns a **Customer Effort Metric (CEM)**, labeling conversations as either **High Effort** or **Low Effort**. To analyze this, open **Data Explorer**, apply a filter for **Customer Effort = High**, and then run an analysis grouped by **Driver**. This will help you identify workflows that create friction for customers, allowing you to address specific pain points effectively.
When should I validate insights from the analysis?
You should validate insights from your analysis regularly, ideally after running any significant report or when you notice trends in your data. Use the **Conversation Insights** feature in Revelir AI to drill down into specific tickets that contribute to your findings. This allows you to confirm that the patterns you see in the metrics match the actual conversations. Regular validation helps maintain trust in the data and ensures that your team is addressing the right issues based on real customer feedback.
Why does my analysis show empty values for customer effort?
If your analysis shows empty values for customer effort, it may be due to insufficient conversational cues in the dataset. Revelir AI requires a certain amount of back-and-forth messaging to accurately assign a Customer Effort Metric (CEM). If the dataset lacks this interaction or if effort was not enabled, you’ll see empty values or all-zero counts in the **Analyze Data** results. To address this, ensure that your dataset includes comprehensive conversations that reflect customer interactions.