

Most teams already know the problem. You have thousands of tickets, but the numbers you can defend stop at volume and CSAT. When someone asks why a spike happened or which fixes matter most, you end up reading a handful of conversations and hoping the sample holds. It usually doesn’t.
This 30‑day plan flips that. You’ll ingest data, define a simple taxonomy, enable AI metrics that match your language, validate with drilldowns, and publish views leadership can trust. The finish line is clear: evidence‑backed metrics from every ticket, with a click path back to quotes. No more meetings that stall at “show me where this came from.”
Key Takeaways:
- Stop sampling. Process 100 percent of conversations, then link every metric to drillable tickets.
- Treat scores as signals. Add drivers, canonical tags, and traceability to get to the real fix.
- Quantify the waste today. Missed signals become escalations, then backlog, then burnout.
- Make validation part of the show. Click counts, open transcripts, end debate fast.
- Ship in 30 days. Week 1 baseline, weeks 2–3 taxonomy and metrics, week 4 repeatable views.
- Keep it lightweight. Fewer categories, clearer drivers, saved views you can reuse every month.
Stop Guessing From Samples: Turn Every Ticket Into Evidence You Can Defend
Sampling cannot guarantee you’ll catch the real signal, and it invites doubt the moment someone asks for proof. Full‑population analysis paired with traceability ends the debate. When every chart clicks through to the exact tickets and quotes, you replace arguments with decisions.

Sampling Creates Blind Spots You Can’t Defend
A ten percent sample feels “good enough” until a rare but costly pattern hides in the other ninety. You don’t miss it because you’re careless. You miss it because nobody’s checking the full set. Then a loud anecdote hijacks the room while the real driver goes ignored. With 100 percent coverage, you pivot by cohort, driver, or product area without arguing about representativeness. The evidence is visible, not abstract.
Traceability Changes the Meeting Dynamic
Leaders ask the same question every time: where did this come from? If you can’t open the source ticket, confidence slips. Tie metrics to quotes in context. Show “negative sentiment by driver,” then click the count to reveal transcripts and AI summaries. The conversation shifts from “Is the metric wrong?” to “What’s the fix?” That is the win.
Stop chasing anecdotes. Start validating with real tickets in minutes. See how Revelir AI works
The Real Bottleneck: Turn Every Ticket Into Structured Metrics, Not Just Scores
Scores tell you something moved, but not why or what to do next. Structure the text first, then measure. Raw tags surface patterns, canonical tags make them reportable, and drivers roll it up to language leadership understands. Add traceability so anyone can audit the path from number to quote.

Scores Point to a Problem, Drivers Tell You Why
CSAT and NPS are useful directional signals. They’re not instructions. Without drivers and categories, a red number leads to guesswork and rework. Translate conversations into sentiment, churn risk, and effort. Then ask the why: which canonical tags and drivers explain this change across segments? That is how you move from “the score is down” to “onboarding friction in enterprise is causing high effort right now.”
From Raw Tags to Canonical Tags You Can Present
Raw tags are discovery. They catch emerging issues humans would miss. They’re also noisy. Map them into a short list of canonical tags that match your business language. Keep it small and clear so updates are easy to explain. Over time, the mapping improves, patterns stabilize, and reporting gets cleaner. You stop wasting cycles on taxonomy debates and start fixing the right flows.
The Hidden Cost of Sampling: Lost Signals, Escalations, Slow Fixes
The math is unforgiving. Even a small miss can snowball into churn and overtime. Full coverage removes that risk, shortens the path to action, and cuts the cost of arguing about metrics. Peer‑reviewed work emphasizes measurement clarity and auditability for a reason, and the same rules apply to CX data.
Quantify the Waste You Live With Today
Let’s pretend you handle 1,000 tickets a month. A ten percent manual sample at three minutes each is five hours for a partial view that can still miss churn risk. To review all 1,000 at that pace would take 50 hours. That gap is where you lose early signals, invite escalations, and burn team energy on rework. Research on measurement quality stresses reliability and traceability as foundations for action, a point echoed in F1000Research and the Implementation Science Measures from the University of Washington. Without trustworthy structure, you pay the cost twice.
Evidence or It Didn’t Happen, With Real Consequences
“Billing is a problem” without linked examples is a meeting stall. Finance pauses. Product punts. You miss the window where a small fix avoids a large churn wave. Tie every claim to the quotes that created it. It’s usually three representative tickets that get everyone aligned. One shows the pattern. One shows the impact. One shows the edge case you’ll address next.
How Do You Prove It in the Room?
Walk in ready to validate, live. Do this every time:
- Start with a one‑pager: volume, severity, impact, and top drivers.
- Open “negative sentiment by driver” and click the highest category.
- Review 3 to 5 transcripts in seconds to confirm the pattern.
- Capture the specific fix and expected impact window.
- Save the view for the next review cycle.
Full‑coverage insights in minutes. That’s what teams need when decisions are on the line. Learn More
What It Feels Like To Argue Without Evidence In The Room
The late‑night rewrite happens when you have a chart, not the proof behind it. Trust erodes fast. Replace scramble with a repeatable path from number to quote. Keep links to drilldowns, and reuse the same logic month after month so nobody wonders if you cherry‑picked.
The 11 PM Rewrite and the Next‑Day Doubt
You ship slides. Someone asks for the tickets behind the spike. You scramble, paste screenshots, and hope it holds. It is exhausting. The next day, a fresh objection lands because the evidence wasn’t built into the flow. Save the view that generated the chart. Keep three quotes bookmarked. When the question comes, click, open, confirm. Doubt fades.
Why Leadership Cares About Traceability
Traceability reduces risk. It narrows the fix, avoids rework, and protects the plan when priorities get tight. Finance wants confidence, product wants clarity, ops wants fewer escalations. When every chart leads to transcripts, everyone sees the same truth. That alignment shortens the path from problem to deployed change. If you skip this, you risk fixing the wrong thing and wasting a sprint.
For rigor on measurement and verification, see the SAGE 2024 study on measurement validity and this NIH review on measurement quality.
30-Day Plan To Turn Every Ticket Into Traceable Metrics
You can reach a trustworthy threshold in 30 days. Week 1 gets you coverage and a baseline. Weeks 2 and 3 define the taxonomy and core metrics you can defend. Week 4 ships repeatable views and a monthly cadence. Keep scope tight, validate often, and avoid over‑engineering.
Week 0–1: Connect and Baseline Fast
Connect your helpdesk or upload a CSV. Verify ticket counts, time ranges, and core fields. Enable sentiment, churn risk, and effort across 100 percent of conversations. Create a saved view by date range and segment so you can confirm coverage at a glance. The goal this week is truth before polish. Prove the pipeline runs. Lock a baseline snapshot so you can compare impact later.
Now put the basics in place:
- Confirm ingestion and counts match your source system.
- Enable core AI metrics across the full dataset.
- Save “last 30 days by segment” and “negative sentiment by driver” as standard views.
Week 2–3: Canonical Tags, Drivers, and Metrics You Can Defend
Review raw tags to spot noisy variants. Define a small set of canonical tags that match your language. Assign drivers leadership recognizes, like Billing, Onboarding, Account Access, or Performance. Keep the list short. Then validate. Open Conversation Insights on the top categories and read a handful of tickets. If the model output matches what a human would say, you’re ready to report.
Focus your refinement:
- Map messy raw tags into 8 to 12 canonical categories.
- Add drivers that roll up across categories for leadership storytelling.
- Enable one or two custom metrics only where needed, then validate with transcripts.
Week 4 and Beyond: Views, One‑Pagers, SLAs, and Governance
Publish a one‑pager for leadership that links every claim to tickets. Ship saved views for top questions: negative sentiment by driver, churn risk by segment, effort by workflow. Define alert thresholds for spikes and aging. Set a monthly taxonomy review and a quarterly metric audit. Same thing with accuracy conversations: you don’t need perfect, you need patterns that hold up every time you open the dashboard. Consistency beats churned slides.
How Revelir AI Helps You Turn Every Ticket Into Evidence-Backed Metrics
Revelir AI processes 100 percent of conversations, turns free text into structured metrics, and keeps the evidence one click away. That removes sampling risk, shortens validation in meetings, and cuts rework caused by fixing the wrong thing. You get coverage, structure, and traceability in a single flow you can run daily.
Full‑Coverage Processing with Drillable Evidence
Revelir AI reviews every conversation automatically, no sampling and no manual tagging up front. Each aggregate is clickable down to tickets and quotes, so you can validate in seconds while the room is watching. That directly addresses the earlier cost curve, where missed signals become escalations and burnout. When a count says “19 churn‑risk tickets,” you click, read, and confirm. Debate ends.
AI Metrics and Canonical Taxonomy That Match Your Language
Out of the box, Revelir AI computes sentiment, churn risk, and effort across all tickets. Raw tags help you discover patterns. Canonical tags make them reportable. Drivers roll it up for leadership. Revelir remembers your mappings, so future tickets roll up cleanly. The result is consistent reporting that connects score movement to root causes without the waste of manual categorization or fragile spreadsheets.
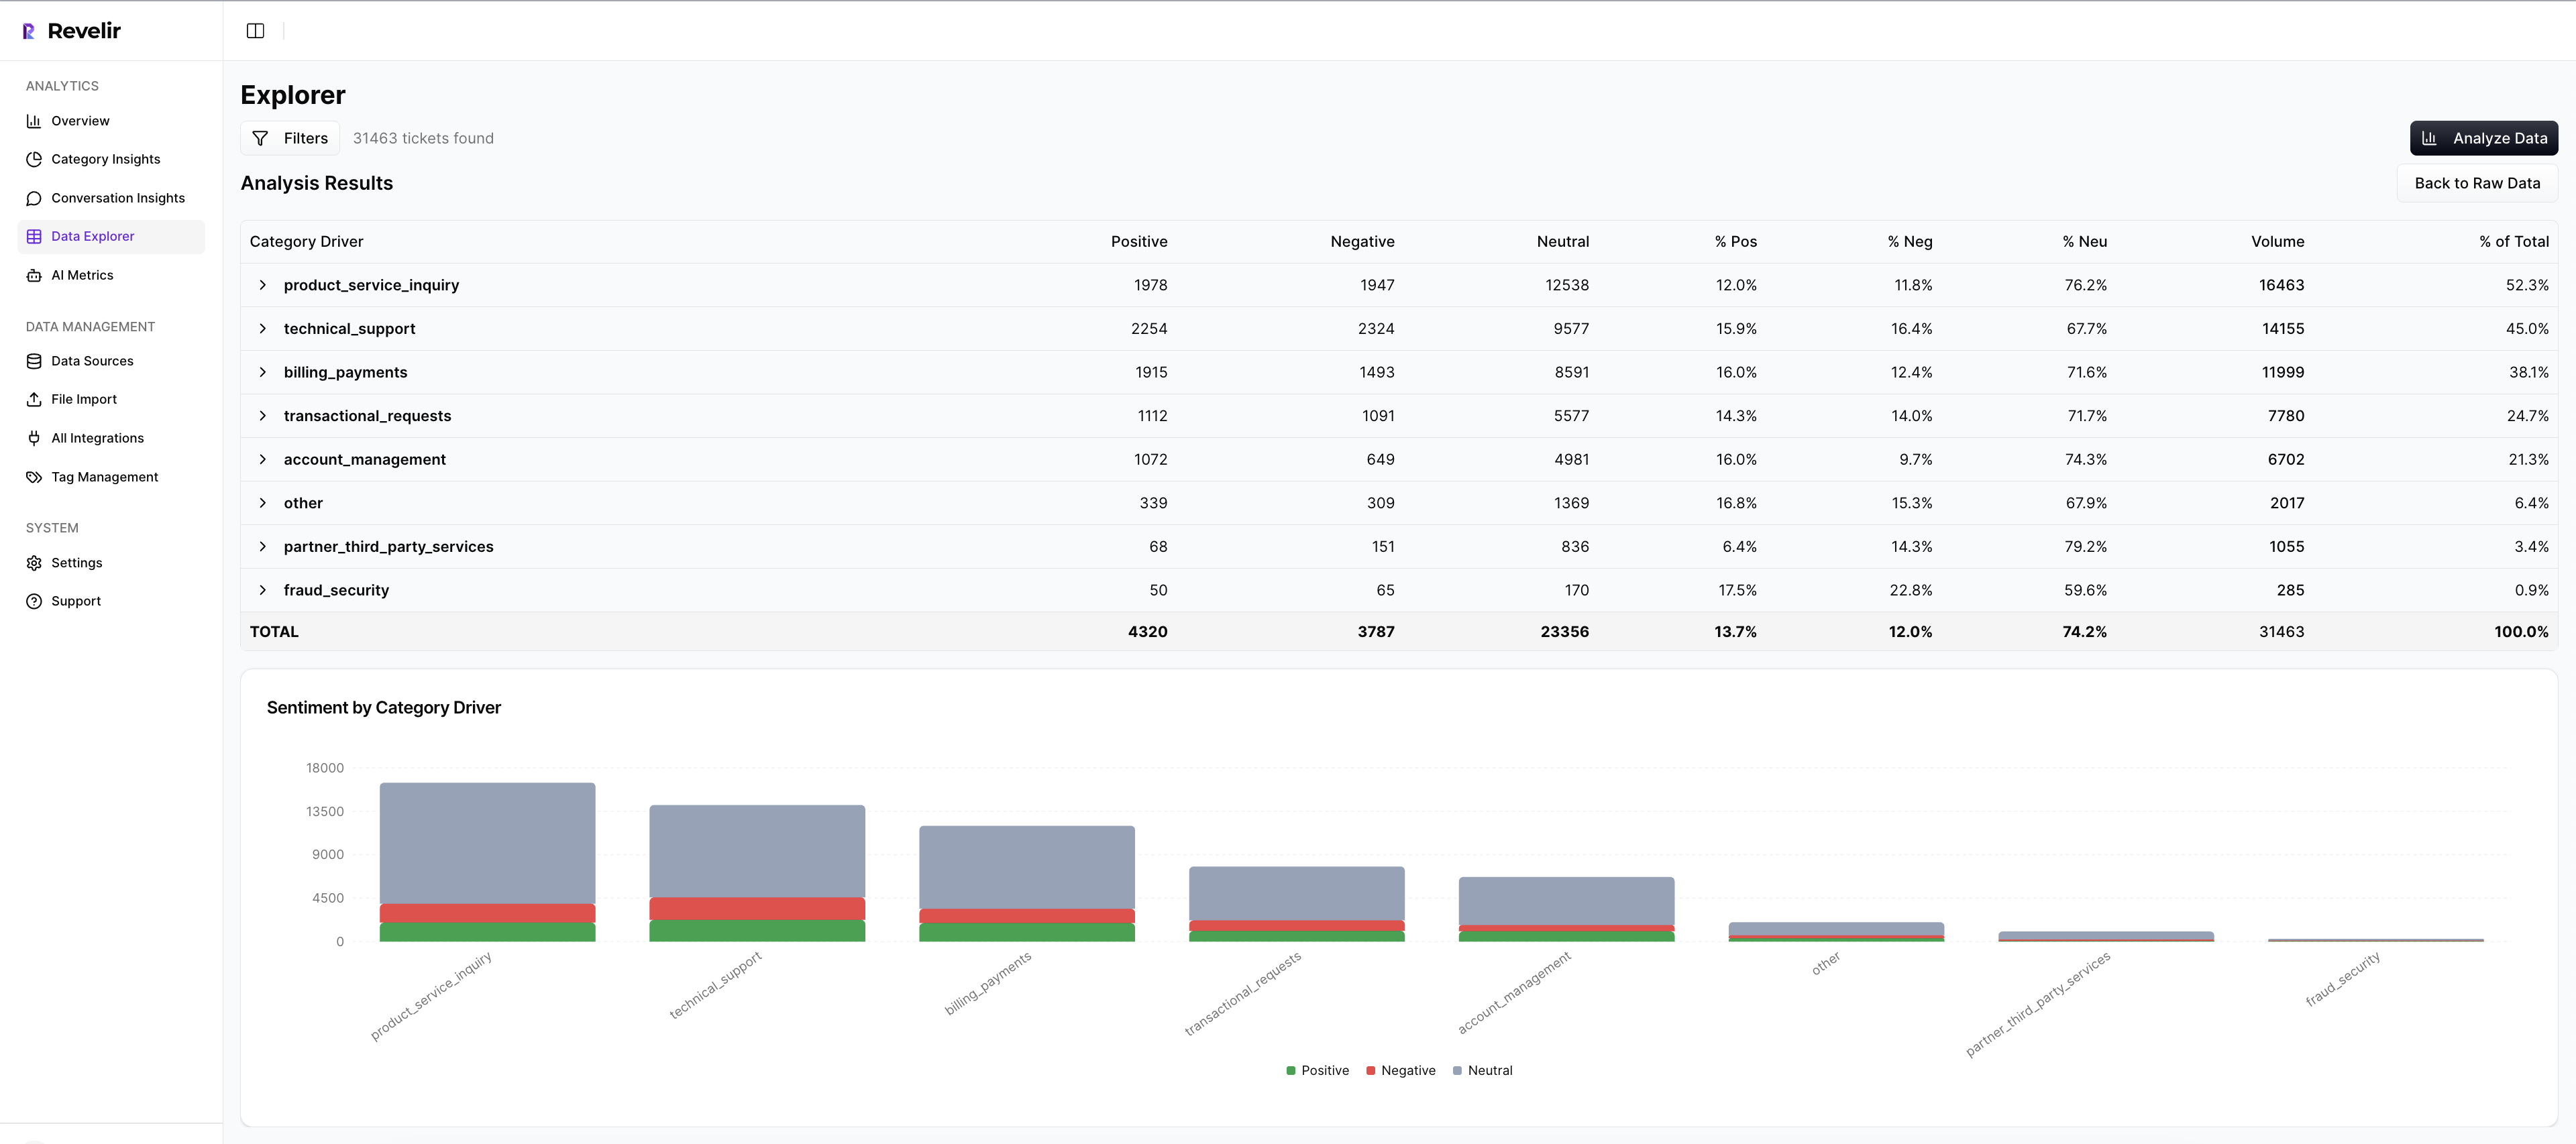
Data Explorer and Analyze Data for Fast, Defensible Reporting
Work where answers live. In Data Explorer, you filter by segment, canonical tag, or driver, then run Analyze Data to group metrics by the dimensions leaders care about. Click counts to open Conversation Insights and verify examples. Compared to manual samples that can cost hours and still fail scrutiny, this compresses time from question to confident answer and reduces the risk of shipping the wrong fix.

Stop chasing approvals for data pulls. Start validating patterns with one click in Data Explorer. Get started with Revelir AI (Webflow)
Conclusion
If you rely on samples and score watching, you risk missing the signal and paying for it later. Structure the text, not just the numbers. Build drivers and canonical tags that leaders recognize. Keep traceability visible so proof is never out of reach. In 30 days, you can replace debate with evidence and move fixes from meeting notes to shipped changes.
Frequently Asked Questions
How do I set up Revelir AI with my existing helpdesk?
To set up Revelir AI with your existing helpdesk, start by connecting your helpdesk API, like Zendesk. This allows Revelir to automatically ingest your historical tickets and ongoing updates. Once connected, you can verify that all ticket metadata, including timestamps and conversation text, is correctly imported. After that, you can explore insights in the Data Explorer to see how Revelir processes your data into structured metrics like sentiment and churn risk.
What if I want to analyze specific ticket trends?
You can analyze specific ticket trends using Revelir's Data Explorer. First, apply relevant filters based on date range, sentiment, or churn risk. Then, use the 'Analyze Data' feature to group your results by categories or drivers. This will provide you with a clear overview of trends, such as which issues are causing negative sentiment among customers. You can also drill down into individual tickets to validate the insights and ensure they align with your observations.
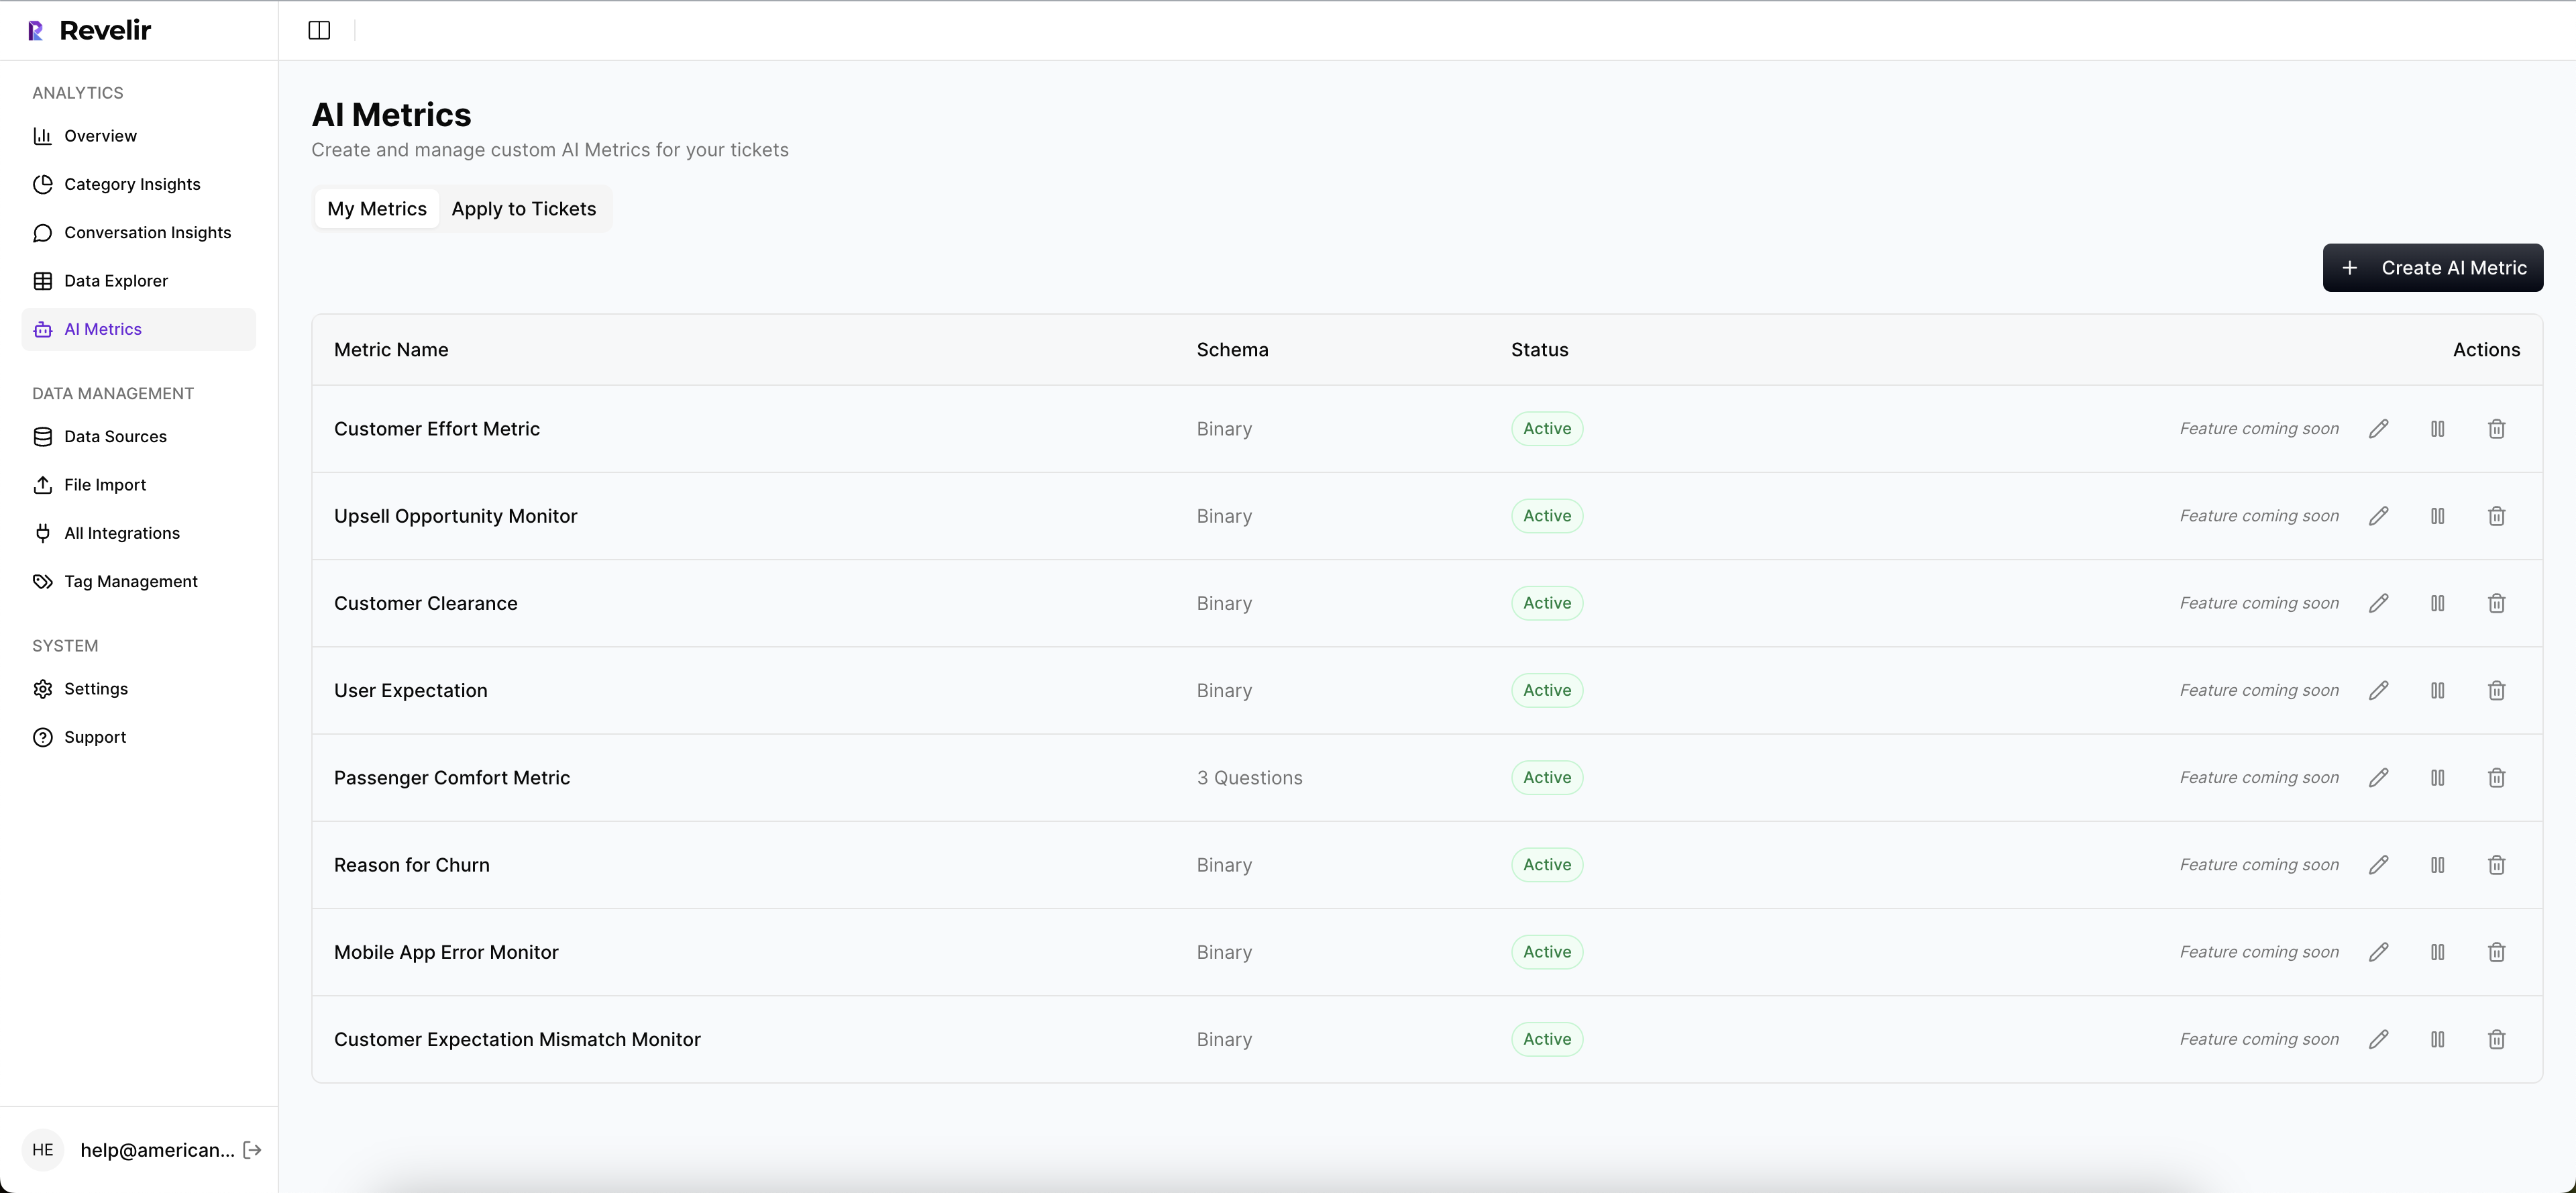
Can I customize the metrics in Revelir AI?
Yes, you can customize metrics in Revelir AI to match your business needs. You can define custom AI metrics that reflect specific aspects of your customer interactions, such as 'Customer Effort' or 'Reason for Churn.' This flexibility allows you to tailor the insights to your organization's language and priorities, ensuring that the metrics you analyze are relevant and actionable for your team.
When should I validate insights with Conversation Insights?
You should validate insights with Conversation Insights whenever you identify a significant trend or metric in your analysis. For instance, if you notice a spike in churn risk linked to a specific driver, click into the Conversation Insights to review the underlying tickets. This step ensures that the metrics are accurate and that you understand the context behind them, which is crucial for making informed decisions about product improvements or customer outreach.
Why does Revelir AI focus on 100% conversation coverage?
Revelir AI focuses on 100% conversation coverage to eliminate bias and ensure you capture all critical signals from customer interactions. By processing every ticket, Revelir helps you avoid the pitfalls of sampling, which can lead to missed insights and inaccurate conclusions. This comprehensive approach provides you with reliable, evidence-backed metrics that you can trust when making decisions about customer experience and product development.