

Retention doesn’t move because you ran a survey or shipped a dashboard. It moves when you fix real product friction fast. The signal is in your support tickets—frustration cues, churn mentions, drivers—not in monthly score tiles that beg for another meeting. If you can see every conversation and tie each insight to a quote, your priorities stop being a debate.
We’ve run this play with teams worried about renewals, rework, and noisy escalations. It’s usually the same pattern. Tickets spike, CS brings anecdotes, PMs push back, engineering shrugs at a vague bug. Weeks pass. Nothing ships. The fix isn’t more reporting. It’s a tight, six-week sprint that starts with churn-risk tickets and ends with a shipped change you can measure.
Key Takeaways:
- Use 100% ticket coverage and evidence-backed quotes to build a fix list leadership accepts
- Group by drivers and canonical tags, then layer sentiment, churn risk, and effort to rank work
- Set SLAs for CS → PM → Engineering handoffs to cut rework and stalled escalations
- Define acceptance and observability up front so QA can verify against real transcripts
- Attribute impact post-sprint by comparing churn-risk density and effort in target drivers
- Keep reporting stable with canonical tags and drivers while trends shift underneath
Retention Moves When You Fix Product Friction Fast
Retention improves fastest when you turn support conversations into a short, prioritized list of fixes and ship them. Scores show direction, but drivers and quotes show what to do next. A single, well-scoped change tied to clear evidence often cools escalations within a sprint.

The signal lives in tickets, not in scores
Scores tell you a mood. Tickets tell you why. When you analyze 100% of conversations, you see churn risk flags, frustration cues, and unsolicited product feedback that never shows up in CSAT. Honestly, we were surprised how often the “real” driver was hiding in a small, specific workflow.
Stop sampling. Start from conversation evidence and keep the traceability intact. That means every chart links to real quotes you can show in the room. You don’t argue with a customer saying, “I tried three times; your verify code never arrived.” You fix the verification flow and watch churn-risk tickets drop.
Why most teams stall between CS and Engineering
The handoff breaks where trust erodes. CS brings anecdotes. PMs ask for proof. Engineering sees vague bug reports at the end of a sprint and punts. Nobody’s checking the transcripts together. Same thing with NPS dips—everyone nods, nobody knows what to fix.
Replace that loop with verifiable slices: churn-risk tickets, grouped by driver, with 3–5 quotes attached. Now PM can scope a change with acceptance that mirrors those examples. Engineering gets clean repro steps and a narrow target. You’ll still argue trade-offs, but the evidence short-circuits opinion battles.
What is a ticket-to-remediation sprint?
It’s a six-week cadence that starts with churn-risk tickets and ends with shipped product changes plus measured retention impact. Week by week, you convert drivers into backlog, set SLAs for handoffs, define acceptance and observability, and attribute outcomes back to the originating tickets.
It’s not more reporting. It’s a production workflow. By week two, you’ve got engineer-ready specs. By week four, you ship behind a feature flag. By week six, you compare pre/post churn-risk density in the target drivers. Not perfect, but real movement beats months of meetings.
Ready to cut the debate and ship fixes faster? See it in practice—See How Revelir AI Works.
Turn Ticket Evidence Into An Engineer-Ready Backlog
An engineer-ready backlog starts with structured evidence: drivers, canonical tags, and AI metrics layered over 100% of tickets. Prioritize by volume and severity, but also by churn risk density and effort. Add representative quotes to each item so acceptance mirrors reality.

What traditional triage misses
Severity isn’t only crashes. It’s how many customers are at risk and how hard it is for them to get unstuck. Let’s pretend two drivers have the same ticket volume. One shows high churn risk among enterprise accounts and “High Effort” flags. The other doesn’t. You know which one ships first.
Traditional triage also misses unsolicited product feedback. Those lines in the transcript where a customer asks for a simpler step or mentions a missing field—gold. When you capture that at scale, your backlog balances volume with revenue risk. Engineers respect that math because it ties to outcomes.
How drivers and canonical tags change prioritization
Raw tags are discovery. Canonical tags plus drivers are clarity. Map the noisy themes into stable categories like Billing or Onboarding, then run grouped analyses to rank fix candidates. You move from “people are mad about billing” to “Billing → Fee Confusion drives 40% of negative sentiment among new customers.”
This is leadership language. It’s also engineering-ready because you maintain a click-through path to the source tickets. PMs keep the taxonomy clean, so patterns stay stable even as new raw tags show up. The result, one planning session yields a focused, defensible backlog that’s easy to execute.
Who owns what in a six week cadence?
Ownership is the antidote to drift. CS curates evidence and flags churn risk. PM turns drivers into scoped backlog with acceptance. Engineering commits to a delivery plan with QA gates. Everyone agrees to SLAs for handoffs. Publish a one-page runbook so nothing lingers.
You will trade speed for certainty at times, but you’ll keep momentum. If you need a role map, the government’s accessibility play gives a decent template for clarity on who does what in agile work—see the Agile Roles Section 508 Task Matrix. Keep it simple and visible.
The Hidden Costs Of Slow Escalation And Fuzzy Handoffs
Slow escalations and fuzzy handoffs burn engineering time, inflate backlog, and increase churn risk. Each bounce between CS, PM, and Engineering adds context loss. Quantify the rework and you’ll see the real cost: features you didn’t ship and renewals you didn’t save.
Engineering hours lost to rework
Let’s pretend two high-risk tickets bounce between CS and PM for a week. Engineers pick them up with missing repro steps, ship the wrong fix, then roll back. You just burned two engineer days that could have delivered a real improvement. It happens more than anyone admits.
Scale that across a quarter and you’ve lost weeks of output. The fix isn’t heroic engineering, it’s clean evidence and acceptance before the work starts. Tie acceptance to specific transcripts. Include environment and logs. QA validates against those same quotes. Rework drops because everyone’s solving the same problem.
The backlog you could have shipped
Opportunity cost stings. Track unresolved high-risk tickets per sprint, then tally engineer hours spent on escalations versus delivery. If you claw back even three days of churn-related thrash per sprint, you recover a full feature’s worth of output each month. Not bad for fixing the handoff.
Use a sprint cadence to lock scope and cut the churn. If you need a refresher on the mechanics, the Atlassian primer on sprints is a clean baseline. Simple rules—short cycles, clear goals—reduce the flailing that kills velocity.
How much churn risk sits unresolved right now?
Start with a simple view. Filter tickets where Churn Risk = Yes, group by driver, then sort by volume and Customer Effort. Add customer segment or MRR if you have it. Now you know which fixes buy the most retention per week of engineering time.
If you prefer a model for ticket-led sprinting, there’s a helpful outline of a Ticketing Sprint Model you can adapt. The important part isn’t the template. It’s complete data and visible evidence. Without those, you risk shipping the wrong fix twice.
Still wrestling with sampling and manual reviews? Stop the bleed and move to full coverage—Learn More.
When Risky Tickets Linger, Trust Erodes Across The Org
Risky tickets that linger tell a story: the system isn’t listening. Sales loses confidence, CS fields repeat complaints, PM looks defensive, Engineering tunes out noise. Early visibility turns panic into a plan you can execute and measure.
When your biggest account threatens to leave
Picture it. A renewal is six weeks away. Tickets show repeated performance complaints with clear churn cues. Without a remediation sprint, you send more check-ins and credits. Nothing changes in the product. The customer leaves. If we’re being honest, you saw it coming but couldn’t prove the fix.
A single, well-scoped change behind a feature flag could have de-escalated the risk. You ground acceptance in transcripts, ship, then compare churn-risk density pre/post. Even if they still escalate, your team shows progress with evidence. That keeps leadership with you while you finish the job.
The 3am incident no one saw coming
A technical driver spikes in tickets, but sampling hides the trend. An incident hits and the first question is “Why didn’t we see this?” With full coverage and driver mapping, you would’ve seen the pattern days earlier—along with the quotes describing the failure. Early visibility isn’t a guarantee, but it buys time.
Why should leadership care right now? Because this is controllable. A six-week sprint turns messy text into a measurable retention plan. Fewer churn-risk tickets in the target drivers, lower effort, steadier sentiment. Boards respect that kind of movement, even when not every metric turns green.
A Six Week Ticket-To-Remediation Playbook
A six-week playbook aligns CS, PM, and Engineering around evidence, speed, and verification. You start with churn-risk tickets, ship guarded fixes by week four, and measure impact in week six. Keep scope tight, acceptance concrete, and observability in place.
Step 1: Set objectives from evidence and build a prioritized backlog
Open your analysis workspace. Filter Churn Risk = Yes, add Sentiment and Effort, and group by driver and canonical tag. Pull 3–5 representative quotes for each top driver. Convert those clusters into backlog items with clear problem statements tied to revenue risk.
Commit to a measurable target: reduce churn-risk density for the top driver by a set percentage. If you don’t have perfect baselines, that’s fine. Anchor on real tickets and adjust as you learn. The point is to tie the objective back to evidence, not vibes.
Step 2: Apply a triage and prioritization matrix with SLAs
Rank by volume, severity, and MRR impact. Define SLAs for CS → PM → Engineering handoffs—say, 48 hours to draft acceptance, 24 hours to finalize an engineer-ready bug report. Include a one-page handoff template with transcripts, repro steps, environment, and suggested scope. Fewer meetings. Faster, cleaner starts.
Need crisp acceptance? Borrow from modular delivery practices in the public sector. The TechFAR Handbook has solid guidance on scoping and outcomes. Keep it lightweight, but explicit enough that QA can verify against real examples.
Steps 3–4: Make fixes engineer-ready, then attribute impact
Write acceptance that ties to ticket-level KPIs. Define a feature flag rollout plan, sample sizes, and rollback rules. Add basic observability—logs or events that capture the target behavior. QA validates against transcripts, not just a happy path. Keep scope tight. Ship something guarded by week four to start learning.
Close the loop in week six. Run a pre/post analysis on the target drivers. Compare churn-risk density, ticket volume, and effort. Segment by cohort or plan. Document wins and misses. Update canonical tag and driver mappings to reflect new patterns. When in doubt on release discipline, revisit Sprint release practices to keep “done” clear.
How Revelir AI Powers The Ticket-To-Remediation Sprint
Revelir turns 100% of your support conversations into evidence-backed metrics you can trust, prioritize, and prove. Full-coverage processing catches early churn signals, while every chart links back to the exact tickets and quotes that created it. That traceability is what keeps stakeholders aligned when priorities get tense.
Evidence-backed coverage, prioritization, and proof in one place
Revelir processes all your tickets—no sampling—and applies AI metrics like Sentiment, Churn Risk, and Customer Effort to each conversation. Those signals, plus raw tags, canonical tags, and drivers, give you a structured dataset you can pivot in minutes. We were skeptical about “one more dashboard” too. The difference here is the path back to the transcript is always one click away.

In Data Explorer, you slice by driver, segment, or plan tier. Then you use Analyze Data to quantify severity and churn-risk density. Attach those grouped views to backlog items and acceptance criteria. After you ship, rerun the exact analysis to verify impact. It’s the same workflow for prioritization and proof, without extra plumbing or manual exports.
When patterns shift, canonical tags and drivers keep reporting stable. PMs maintain the mapping so future tickets roll up cleanly. Conversation Insights lets CS, PM, or QA open any slice and read the real exchange, with AI summaries for speed. If you need your finance stack to see the numbers, you can export metrics via API and join them with MRR in your BI tools. No rip-and-replace—Revelir stays the evidence layer.
In practical terms, Revelir helps you:
- Process 100% of conversations and score them for sentiment, churn risk, and effort with traceable evidence
- Build engineer-ready backlogs by grouping tickets under canonical tags and drivers with representative quotes
- Measure pre/post impact by re-running the same grouped analyses against the same drivers
Ready to turn tickets into shipped fixes and measured retention? Stop chasing anecdotes. Start shipping with proof—Get Started With Revelir AI (Webflow).
Conclusion
You don’t need bigger dashboards. You need a repeatable way to turn the words customers actually say into fixes that reduce churn. The ticket-to-remediation sprint does exactly that: evidence in, acceptance and observability set, guarded release by week four, measurable impact by week six.
Most teams fail because they sample, stall, and ship late. You don’t have to. Start with churn-risk tickets, rank by drivers and effort, and make acceptance mirror real quotes. Then keep the loop tight. Fix. Verify. Repeat. Retention moves when your product gets better where it hurts most.
Frequently Asked Questions
How do I analyze churn risk using Revelir AI?
To analyze churn risk with Revelir AI, start by accessing the Data Explorer. 1) Filter your dataset by 'Churn Risk = Yes' to isolate tickets indicating potential churn. 2) Use the 'Analyze Data' feature to select 'Churn Risk' as your metric and group by drivers or canonical tags. This will help you identify which issues are contributing to churn. 3) Review the results to see patterns and click into specific tickets for detailed insights. This process enables you to pinpoint the primary drivers of churn and take proactive measures to address them.
What if I need to prioritize fixes from support tickets?
If you need to prioritize fixes, Revelir AI can help streamline this process. 1) In the Data Explorer, filter tickets by sentiment and churn risk to focus on high-severity issues. 2) Use the 'Analyze Data' feature to group by sentiment or effort metrics, which will highlight the most pressing problems. 3) Review the grouped results to determine which issues have the highest volume and severity, allowing you to create a prioritized fix list. This structured approach ensures that you address the most impactful issues first.
How do I validate insights from support tickets?
To validate insights from your support tickets, follow these steps: 1) After running an analysis in the Data Explorer, click on any metric count to access Conversation Insights. This will show you the underlying tickets that contributed to the metric. 2) Review the full transcripts and AI-generated summaries to ensure that the insights align with the actual conversations. 3) Make adjustments to your tagging or metrics if necessary, based on what you observe. This validation process helps maintain trust in the data and ensures actionable insights.
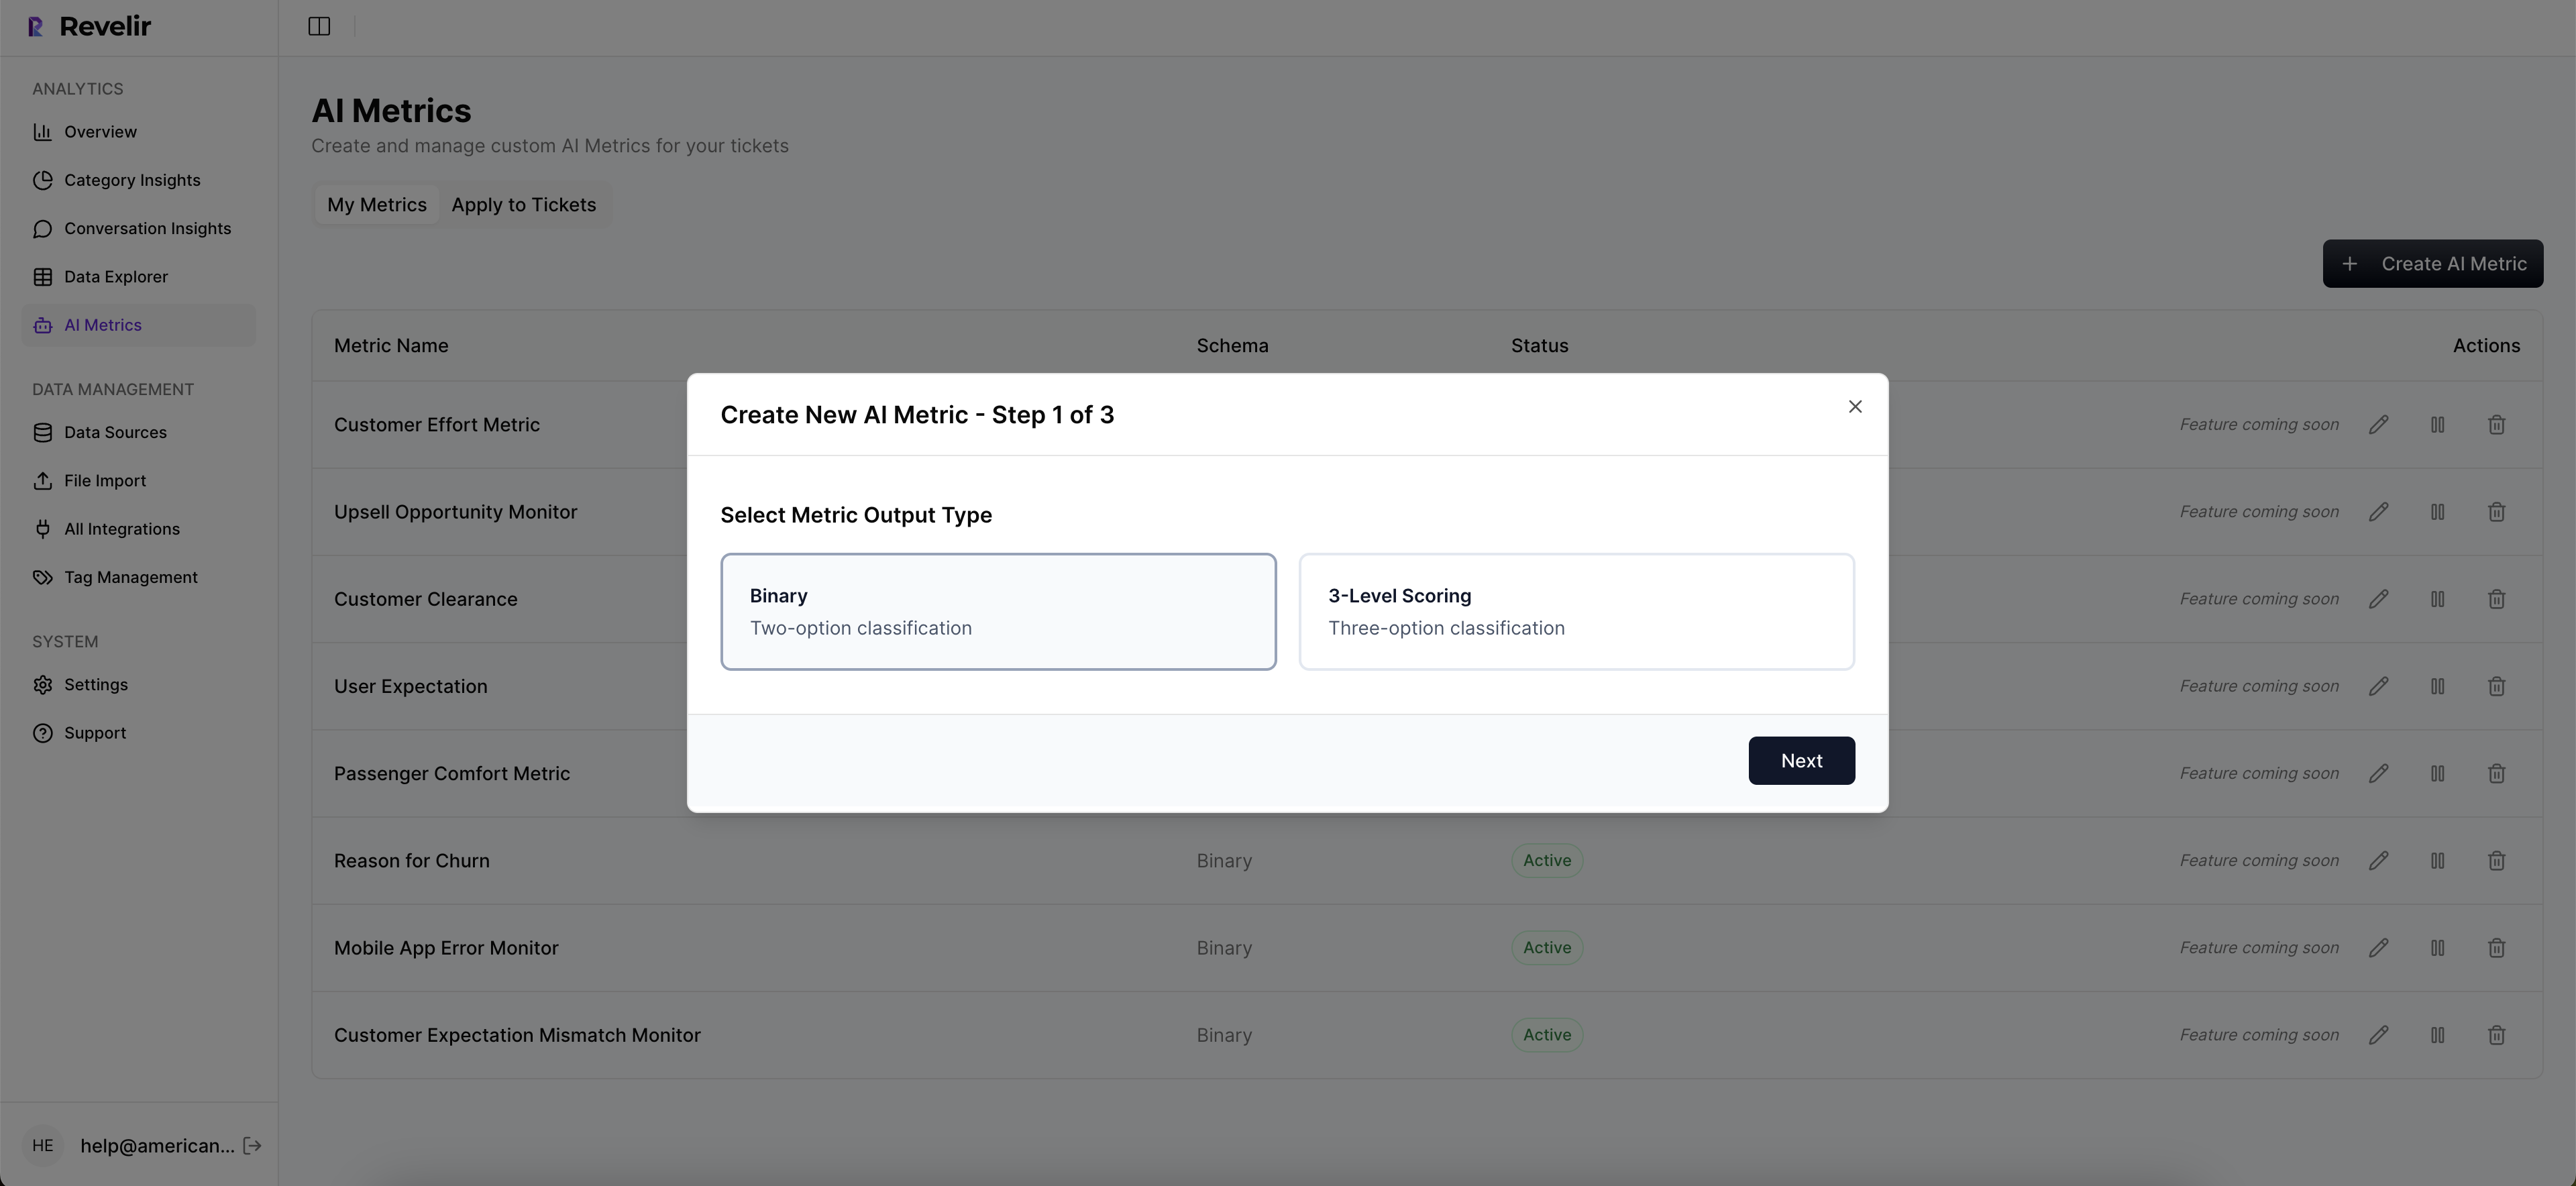
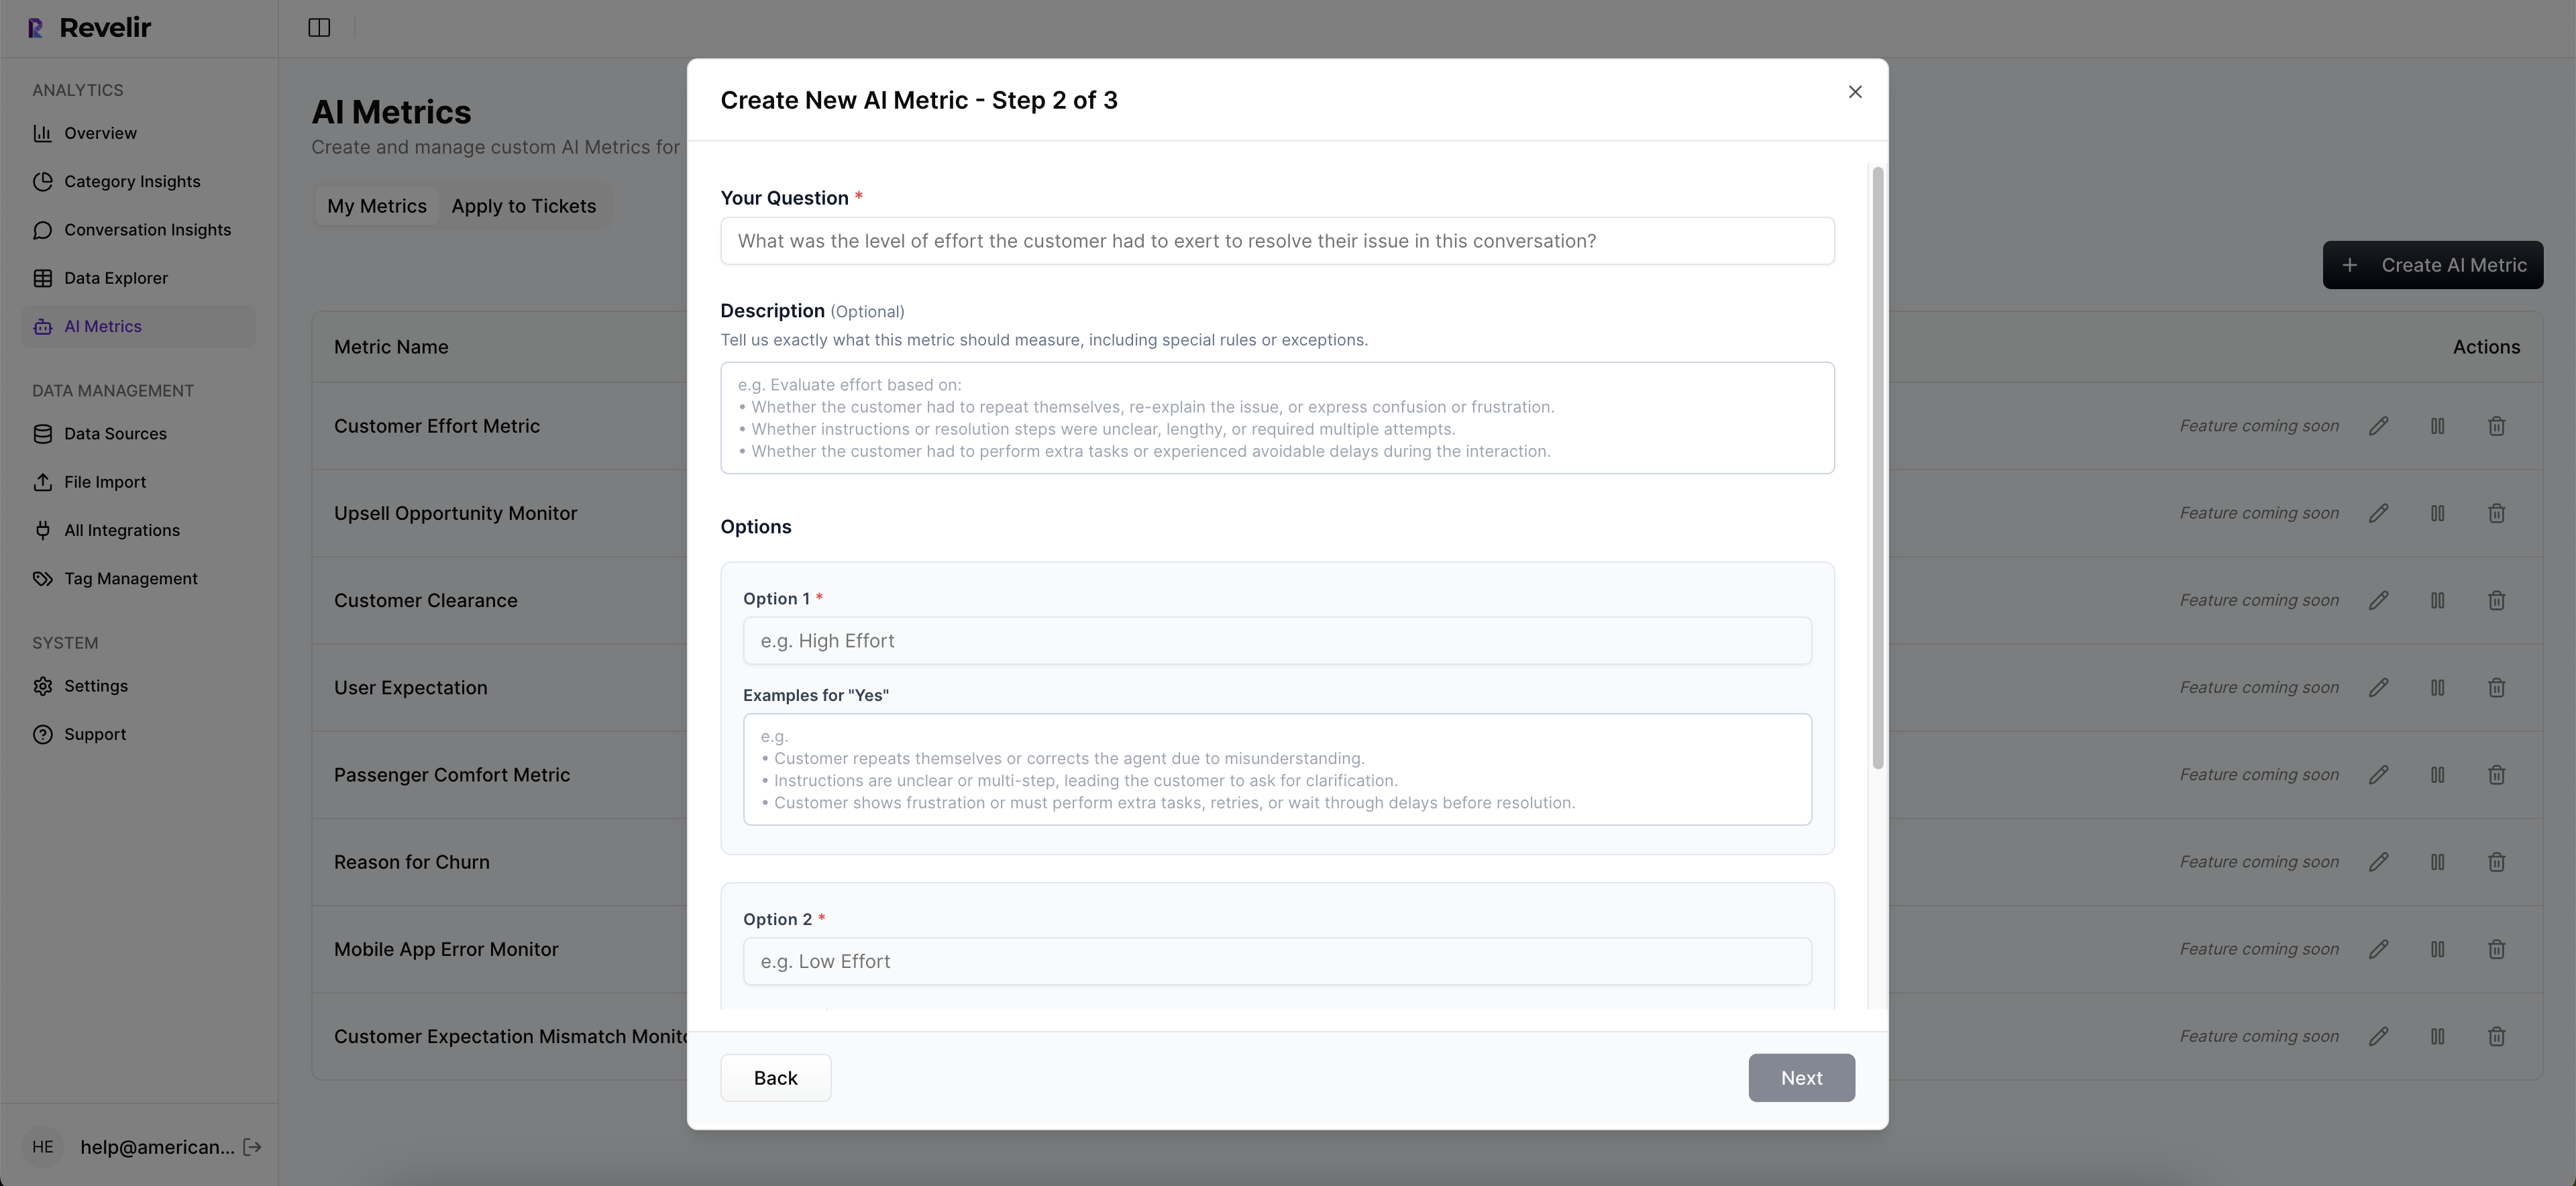
Can I customize metrics in Revelir AI?
Yes, you can customize metrics in Revelir AI to better align with your business needs. 1) Define your own AI Metrics that reflect specific aspects of your customer interactions, such as 'Upsell Opportunity' or 'Reason for Churn'. 2) Specify the canonical tags and raw tags that will roll up into these custom metrics. 3) As you gather more data, you can refine these metrics to ensure they remain relevant and useful. This flexibility allows you to tailor the insights to your operational context.
When should I run an analysis in Data Explorer?
You should run an analysis in Data Explorer whenever you need to understand customer sentiment or identify operational issues. 1) It's particularly useful after a significant change in product or policy, as you can quickly assess the impact on customer experience. 2) Regularly analyze data to catch emerging trends or spikes in negative sentiment, which can indicate underlying issues. 3) Use the analysis to prepare for leadership discussions by providing evidence-backed insights that support your recommendations.