

Most teams think their support data is “handled” because they track CSAT and review a handful of tickets. They’re wrong. The real signals, the ones that change roadmaps, live inside transcripts you’re not systematically measuring. When you only skim, you argue anecdotes. When you measure 100% with traceable evidence, you decide faster and defend those decisions upstairs.
Here’s the thing. Sampling and score-watching feel efficient until a small, preventable issue turns into a churn driver. It’s usually not a tooling gap; it’s a structure gap. You don’t need another dashboard. You need a feedback loop that turns every conversation into evidence you can pivot, audit, and fund.
Key Takeaways:
- Stop sampling tickets; 100% coverage with traceability is the standard
- Anchor your loop to a specific decision, then design tags, drivers, and metrics around it
- Quantify pain by severity × volume × churn risk to rank what gets fixed first
- Replace anecdotal decks with evidence briefs: quotes, counts, segments, acceptance criteria
- Use full-coverage AI metrics and drill-downs to move from trend to transcript in two clicks
- Prove impact with pre/post comparisons so the roadmap debate ends with data
Why Ticket Sampling Misleads Your Roadmap
Sampling misleads roadmaps because it introduces bias, delay, and distrust. A 10% read of 1,000 tickets at three minutes each costs five hours and can miss the critical pattern hiding in the skipped 90%. Teams then debate representativeness instead of deciding. Enterprises that tie insights to quotes move faster in the room.
The Signals That Surveys Miss Live Inside Conversations
Surveys and top-line CSAT tell you mood, not root cause. They’re snapshots, useful, but shallow. Inside transcripts you’ll find frustration cues (“I’ve tried three times already”), explicit churn mentions (“we’re considering moving”), and unsolicited product feedback (“this flow is missing X”). Those specifics point to fixes you can ship, not just scores you can explain.
When you only watch scores, you tend to ship symptomatic remedies, more help articles, broader apology emails, because there’s no “why” underneath the number. Mining conversations changes the conversation. You can say, “New customers stumble on step three of onboarding” and attach three representative quotes. Suddenly, the fix is concrete, scoped, and fundable. Evidence or it didn’t happen.
The Bias And Delay Of Sampling
Sampling invites bias because you over-represent the loudest or most recent issues. It also creates delay, manual reads chew up time, and you’re still blind to quieter but systemic patterns (like subtle onboarding friction). Let’s pretend you review 100 tickets, miss one small churn driver, and then watch that issue generate 50 extra tickets weekly. The cost isn’t just support time; it’s escalations and credibility.
Executives sense this. That’s why they ask for the quote, the count, the segment. Without traceability back to the exact conversation, prioritization feels like a hunch, especially when you’re competing with roadmap commitments. Full coverage with clear links from charts to transcripts short-circuits the debate and accelerates yes.
Want to move faster with proof, not hunches? See how this looks end to end: See How Revelir AI Works.
The Real Bottleneck Is Unstructured Conversations
The real bottleneck is unstructured conversation text that doesn’t roll up into trustworthy, decision-ready metrics. Dashboards visualize what you feed them; they don’t convert messy transcripts into drivers, tags, and metrics. Teams that structure tickets into a consistent taxonomy pivot faster and argue less. A clear taxonomy beats another graph.
Anchor The Loop To A Specific Decision
Start by naming the decision you keep getting wrong. Reduce churn in new customers? Hit enterprise SLAs? Improve onboarding completion? Then map conversation outcomes to those OKRs. If the decision is churn reduction, you need churn risk density by driver, plus segment and lifecycle. If it’s onboarding, you need negative sentiment density in first-30-day cohorts.
Anchoring the loop clarifies what to measure and what to ignore. Your taxonomy, filters, and rituals snap into focus because they serve a single decision. We’ve seen teams go from “too many tags, not enough clarity” to “four drivers, five canonical tags per driver, weekly review” in a week. That’s the shift, clarity first, then scale.
Tagging, Drivers, And Hygiene Over More Dashboards
Dashboards don’t structure text. Tags and drivers do. Use canonical tags, human-readable categories leadership recognizes, and group them under drivers like Billing, Onboarding, and Performance. Add minimum hygiene fields, segment, plan, product area, lifecycle stage, so pivots are instant, not bespoke every time.
This isn’t theoretical. Product loops run on the same pattern dev teams use to close the build, measure, learn gap. Shorten the distance from signal to decision by designing your data model around the questions you need to answer. For a primer on how tight loops improve outcomes, see Data-Driven Feedback Loops in DevOps.
The Hidden Costs Of Anecdote-Driven Prioritization
Anecdote-driven prioritization erodes time, trust, and money. The hours look small, ten here, twelve there, but the rework compounds. When the fix misses the mark, you pay in escalations, morale, and credibility. Quantify the pain or it keeps winning by default.
The Math You Don’t Want To See But Need To Face
Let’s pretend your team handles 2,000 tickets per month. Sampling 10% at three minutes each costs 10 hours for a partial view. Miss one theme that drives 50 extra tickets weekly at six minutes per ticket and you’ve quietly burned 300 minutes per week, 20 hours per month, just in handling, not counting escalations or remediation.
Now layer in coordination costs. A single misguided fix can create a week of churn across product, CX, and engineering as teams restage work and rebuild confidence. Suddenly the “cheap” sampling plan looks expensive. The kicker: you still lack the evidence to win the next debate.
How Rework And Escalations Compound Across Teams
When prioritization is anecdotal, product ships the wrong fix, support volume creeps up, and execs ask for a narrative redo. Engineering loses trust in inputs, CX loses time to pull new examples, and finance loses patience. It’s the subtle tax you see as late nights and worried faces during QBRs, avoidable, but only if the data holds up.
This grind drains focus. Nobody’s checking “Was this worth it?” because everyone’s busy putting out fires from last quarter’s bets. Same thing with post-release checks, without baselines and traceability, you can’t prove impact, so the cost of rework hides in the shadows.
Rank By Severity × Volume × Risk
A single severe ticket feels important. A systematic view is better. Score each theme on severity and churn risk density, then multiply by volume over a fixed period. This turns noise into a ranked list with defensible math. If “Billing Fee Confusion” scores high severity, high risk, and sits at notable volume, it earns a top slot.
Quick sanity check: spot-validate with transcripts to ensure the math matches reality. It’s not perfect; it’s decisive. Teams that use a simple severity–volume–risk model build momentum and avoid rabbit holes. For a practical lens on prioritization tradeoffs, see the quality engineering perspective in PNSQC research on cost of defects.
Still juggling sampling and rework? There’s an easier path. Get Started With Revelir AI.
The Meeting Moment When Confidence Collapses
Confidence collapses when insights can’t be traced back to real conversations. Stakeholders ask for receipts because they’ve been burned by handpicked anecdotes. If you can click from a trend into the exact transcripts, the debate fades. If not, the room stalls.
When Your Top Account Asks For Receipts
You’re in the room. A VP asks why this bug should jump the roadmap. If your evidence is a stitched doc and two cherry-picked tickets, confidence drops. If you click from a driver trend straight into three representative transcripts, quotes highlighted, segments visible, the conversation shifts. Skeptics become sponsors because they can see the proof.
This is the ritual to protect: show the aggregate, then show the evidence. Evidence-backed metrics save time because they end detours early. You don’t argue about whether a theme is “real.” You read it, you count it, you decide.
Who Owns The Loop To Keep Trust High
Ownership beats heroics. CX validates patterns and curates quotes. Product defines acceptance criteria (what “fixed” looks like) and ties issues to scope. Ops keeps the taxonomy clean and the fields consistent. With shared ownership, meetings get shorter and decisions get cleaner.
And when incidents spike at 3 a.m., it happens, you’re not guessing which early signals you missed. Full coverage catches those whispers before they become headlines. For practical patterns on making feedback loops stick, see these customer feedback loop examples.
A Practical Ticket-Driven Feedback Loop You Can Run This Week
A practical loop ingests conversations, structures them into tags and drivers, quantifies severity and risk, and produces evidence briefs engineering can ship against. Keep it small, repeatable, and auditable. Start simple, then refine as you learn.
Ingest And Structure With Minimum Hygiene
Connect your helpdesk or upload a CSV with must-have fields: ticket ID, created date, segment, plan, product area, and transcript. Enable baseline metrics like sentiment, churn risk, and effort. Add columns in your analysis workspace so filters are ready on day one. Clean data in, faster pivots out.
Begin with broad filters, then refine. Negative sentiment last 30 days, grouped by driver, is usually enough to surface the top three themes. Validate by drilling into a handful of transcripts. If the examples match the pattern, proceed. If not, adjust the taxonomy or review windows and re-run.
Design Canonical Tags And Drivers Leaders Trust
Run a short taxonomy sprint. Merge noisy raw tags into clear canonical categories leaders recognize, then align each category to a driver like Billing, Onboarding, or Performance. Document mapping rules in a one-pager so everyone plays the same language game.
This is where engineering buy-in happens. Developers say yes faster when the problem is framed in their context, scope, reproducibility, acceptance criteria, and the evidence is easy to audit. If you want a great companion lens, skim Martin Fowler on Developer Effectiveness to see why clarity and flow matter more than adding more work-in-progress.
Triage And Brief With Evidence
Build saved views for the last 30 days. Group by canonical tag or driver. Review percent negative sentiment, high effort, churn risk density, and total volume. Multiply volume by severity and a risk multiplier to rank. Then validate by opening a few tickets per top theme to confirm the story “makes sense.”
Now package the decision. Create a one-page evidence brief: problem statement, scope window, top segments, volume and severity metrics, three quotes with links, reproduction notes, acceptance criteria, owner. Attach the saved analysis and filtered ticket view. That brief replaces back-and-forth and accelerates acceptance without extra meetings. If you like a research lens on loop discipline, see feedback loops in software research.
How Revelir AI Powers The Evidence Loop End To End
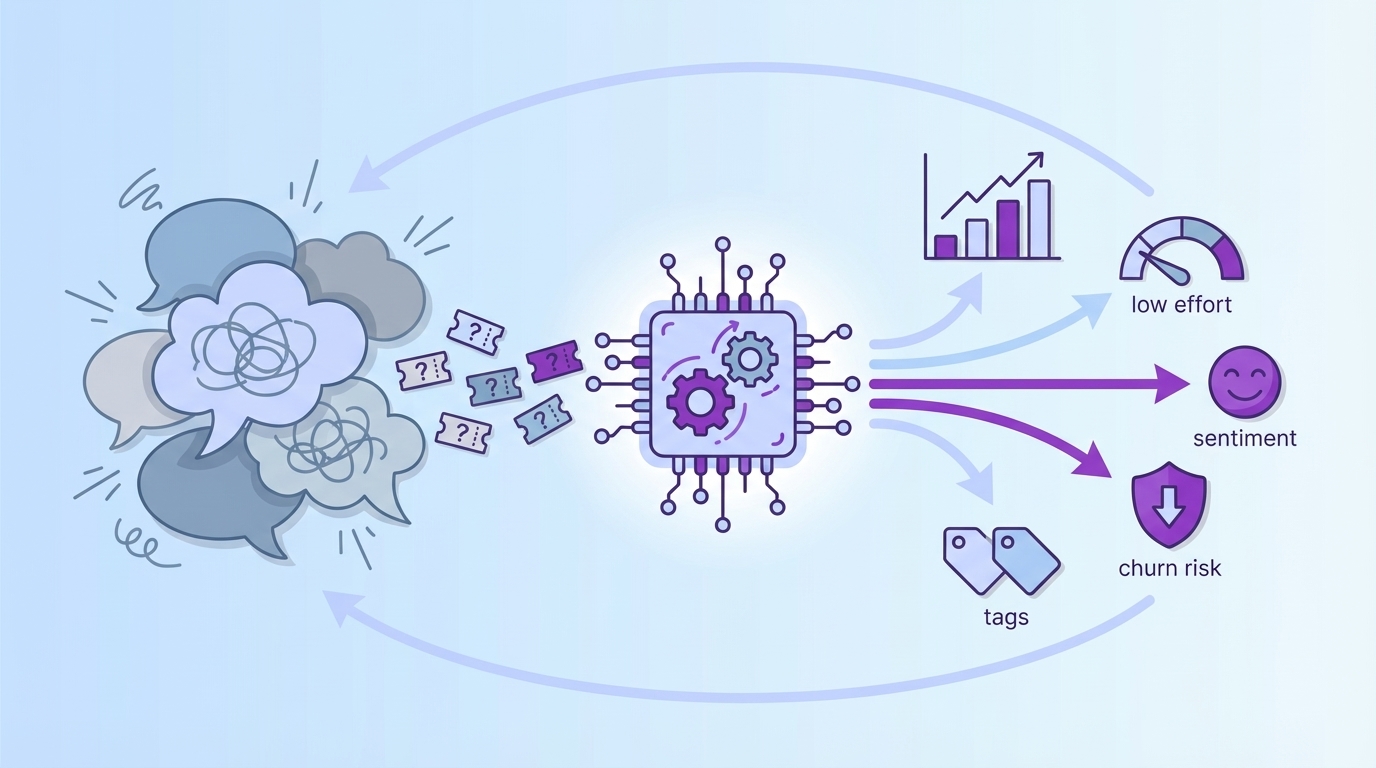
Revelir AI turns messy conversations into structured, evidence-backed metrics you can trust. It processes 100% of tickets, attaches sentiment, churn risk, effort, tags, and drivers, and links every chart straight to exact transcripts. That’s the difference between “we think” and “here’s what happened, and where.”
Full Coverage, Metrics, And Traceability Across The Stack
Revelir AI processes 100% of conversations, no sampling, so you stop missing subtle but costly signals. Each ticket is auto-tagged with raw tags and rolled into canonical categories and drivers, then enriched with metrics like Sentiment, Churn Risk, and Customer Effort. Crucially, every aggregate links back to the exact conversations and quotes that produced it.


This traceability changes the meeting dynamic. When someone asks, “Show me where this came from,” you click a number and open the transcripts behind it. Executives can audit the path from trend to transcript in seconds, which shortens debate and speeds decisions when trade-offs are hard. The result is fewer escalations, less rework, and faster yeses.
Fast Triage, Custom Metrics, And Impact Measurement
Day to day, you work in Data Explorer to slice by date, segment, driver, or canonical tag and run Analyze Data to group metrics side by side, volume, negative sentiment, effort, churn risk. You get a ranked list you can validate immediately by clicking into Conversation Insights, then move directly into product intake with confidence.

Need to speak your company’s language? Define custom AI metrics aligned to your taxonomy, and Revelir AI remembers your mappings so the structure stays consistent as new tickets arrive. When you ship a change, save a pre-release baseline and compare post-release volume, sentiment, effort, and churn risk. Sample a few transcripts to confirm the pattern makes sense, then share a crisp delta and representative quotes. If you want a broader business take on loop design, this overview on business feedback loops is a helpful complement.
Revelir AI gives you full-coverage processing, evidence-backed traceability, and a workspace built for fast triage and validation. It plugs into your existing reporting via export, so you don’t rebuild the plumbing, your dashboards finally have structured inputs they can trust. Ready to close the loop with evidence, not anecdotes? Learn More.
Conclusion
You don’t need more dashboards. You need receipts. Stop sampling. Structure every conversation into drivers, tags, and metrics. Rank by severity, volume, and churn risk. Then show the quotes that prove the case. That’s how roadmaps get funded, escalations go down, and teams sleep better. Evidence beats anecdotes, every time.
Frequently Asked Questions
How do I connect Revelir AI to my helpdesk?
To connect Revelir AI to your helpdesk, start by selecting the integration option in the Revelir dashboard. If you're using Zendesk, simply follow the prompts to connect your account. This will allow Revelir to automatically ingest historical tickets and ongoing updates. If you're using a different helpdesk, you can also upload a CSV file containing your support conversations. Once connected, Revelir will process all imported tickets and provide structured insights based on the conversations.
What if I want to analyze customer sentiment over time?
You can analyze customer sentiment over time using the Data Explorer feature in Revelir AI. Start by filtering your dataset by date range and selecting the sentiment metric. Then, run an analysis grouped by the relevant category driver. This will allow you to see how sentiment trends fluctuate across different periods. You can also drill down into specific segments to validate patterns with real conversation examples, ensuring that your insights are grounded in actual customer feedback.
Can I customize the metrics in Revelir AI?
Yes, you can customize metrics in Revelir AI to align with your business needs. You can define custom AI metrics that reflect specific aspects of your customer interactions, such as 'Upsell Opportunity' or 'Reason for Churn.' To set this up, navigate to the metrics configuration section in the Revelir dashboard and specify the canonical tags and raw tags that correspond to your custom metrics. This flexibility allows you to tailor the insights you receive to better inform your product and customer experience strategies.
When should I validate insights with Conversation Insights?
You should validate insights with Conversation Insights whenever you notice significant trends or anomalies in your data. For instance, if you identify a spike in churn risk or negative sentiment in a specific category, it’s essential to click into Conversation Insights to review the underlying tickets. This allows you to confirm that the AI-generated metrics align with the actual customer conversations, ensuring that your decisions are based on accurate and trustworthy evidence.
Why does Revelir AI emphasize 100% conversation coverage?
Revelir AI emphasizes 100% conversation coverage to eliminate bias and ensure that no critical signals are missed. By analyzing every ticket rather than sampling a subset, you gain comprehensive insights into customer sentiment, churn risk, and operational issues. This approach allows teams to make informed decisions quickly, as all metrics are traceable back to specific conversations. It helps avoid the pitfalls of relying on anecdotal evidence or incomplete data, leading to more effective product and customer experience improvements.