Most teams think support metrics fail because people don’t “get” the numbers. That’s not it. The pushback usually shows up when a chart can’t be traced to real conversations. The room loses trust. Then you lose time. And the work slows down while everyone hunts for proof.
Let’s keep it simple. If you can click any number and land on the exact tickets, you keep momentum. If you can’t, you get stuck in representativeness debates and late‑night CSVs. We’ve learned this the hard way. The fix isn’t more dashboards. It’s an audit path that never breaks.
Key Takeaways:
- Treat traceability as a pipeline, not a slide deck add‑on
- Write metric contracts with owners, definitions, error budgets, and drillbacks
- Process 100% of conversations to remove sampling bias and delays
- Design one‑click drillbacks from every aggregate to filtered tickets
- Add pre‑deploy tests and drift checks to stop quiet data regressions
- Keep representative samples and quotes attached to every chart
- Assign a clear owner who decides when to roll back or accept variances
Why Your Support Metrics Lose the Room
Support metrics lose the room when they’re not auditable at the moment of challenge. Leaders don’t reject math; they reject black boxes they can’t verify in 30 seconds. The fix is an always‑on path from every number to the exact tickets and quotes. Think one click, not a scavenger hunt.

The Real Reason Charts Get Challenged
Leaders rarely argue the arithmetic. They question the chain of custody. If an aggregate can’t be traced to specific conversations, the first “show me an example” stalls the meeting and invites doubt. We’ve seen it: the math is fine, the trust isn’t. And trust wins.
The antidote is boring and powerful: verifiable evidence. When your analysis workspace can group by driver, segment, or tag and land on filtered tickets instantly, skepticism shrinks on contact. You read two quotes, confirm the labeling makes sense, and move. If this path takes minutes, you’ve already lost momentum. Keep it under thirty seconds.
What Most Teams Miss About Auditability
Auditability isn’t sprinkling hand‑picked quotes into a slide. It’s an operational design choice. Write metric contracts. Define owners. Bake a drillback path into every chart. Add tests that catch drift before your next leadership review. This is less glamorous than a new dashboard. It’s also what actually prevents rework.
You don’t need a complicated observability stack to start. A simple, consistent audit trail beats a fancy one you can’t keep current. If you want patterns for larger systems, observability pipelines describe how to route, enrich, and inspect data at scale in language non‑data leaders can follow. Datadog’s overview is a useful mental model for this kind of routing and control: Observability Pipelines.
Want to skip the theory and see a working audit path? See how Revelir AI works.
Traceability, Not More Dashboards, Is the Reliability Layer
The reliability layer isn’t another reporting view. It’s traceability: full coverage processing, clear definitions, and one‑click drillbacks. When you can pivot any metric and immediately open the tickets behind it, teams stop debating representativeness and start deciding next steps with confidence.

Why Coverage Beats Sampling When Stakes Are High
Sampling feels fast. It isn’t. It adds bias, delay, and arguments at the worst time. Full coverage eliminates “maybe we missed it” as a reason to stall. You can slice by plan tier, driver, or cohort without worrying whether the segment is under‑represented. Confidence rises with coverage.
We’re not saying read every ticket by hand. We’re saying process every conversation so the aggregates reflect reality, not a guess. When someone asks, “How many enterprise customers said this?” you can answer in one click and show quotes. That’s how decisions move. For teams building the muscle of monitoring and validation over pipelines, a short explainer on proactive data pipeline monitoring helps set expectations for drift and recovery: Data Pipeline Monitoring.
How Direct Drillbacks Stabilize Cross‑Functional Trust
Direct drillbacks do two things at once: they validate the pattern and provide examples for storytelling. A CX lead can show “negative sentiment by driver,” click “Billing,” and open the exact list of conversations on the spot. Product gets context, finance sees evidence, and alignment holds.
If this sounds basic, good. Basic wins. The trick is making it reflexive. Every metric should have a default drillback path—ideally to a saved view—so nobody has to scramble. Over time, this consistency quiets the “where did this number come from?” reflex. Stakeholders learn to trust the path as much as the chart.
The Hidden Costs of Unverifiable Metrics
Unverifiable metrics create a compounding time sink. You spend hours validating partial samples, only to re‑validate them when someone new joins the meeting. Meanwhile, customers wait while internal teams debate definitions, cohorts, and mappings. Those hidden hours add up fast.
The Compounding Time Sink You Can Measure
Let’s pretend your team handles 1,000 tickets a month and samples 10%. At three minutes per ticket, that’s five hours for a partial view. Two analysts, weekly reviews, a quarter goes by—you’ve burned 40–60 hours proving a slice you still don’t fully trust.
That time doesn’t disappear. It shows up as delayed fixes, frustrated leaders, and weekends eaten by ad‑hoc reviews. Worse, it sets a precedent: the next time someone doubts a number, you repeat the cycle. A basic monitoring rhythm prevents much of this. Even in data engineering, teams watch distribution shifts as a core practice. Databricks outlines lightweight checks and alerting patterns you can mirror for support metrics: Monitoring DLT Pipeline Performance and Best Practices.
When Drift Meets Dispute, Delivery Slips
Drift is sneaky. A mapping change between raw tags and canonical categories. A new cohort definition in BI that doesn’t exist in the helpdesk. Small shifts accumulate until the chart and the quotes tell different stories. Leaders sense the wobble and hit pause. Work stops.
That pause often costs a sprint or two. More expensive than the tests you postponed. A short regression suite—schema checks, distribution bounds, and drillback validation—catches many issues before they hit the deck. Without it, disputes last longer than fixes. And the backlog grows while you debate.
Still validating manually across tools? It doesn’t have to be this brittle. Learn More.
When Metrics Get Ambushed In The Meeting
Metrics get ambushed when the audit path isn’t ready for prime time. The first “show me an example” becomes a three‑minute gauntlet of silence while you dig. The room gets nervous. After that, every update is uphill. A working drillback kills the ambush.
The Three Minute Gauntlet No One Enjoys
We’ve lived this. You present a clean trend, someone asks for two examples, and your heart sinks because the drillback isn’t saved. Those quiet minutes hurt more than you think. They create doubt you’ll pay for in the next review.
Flip it. Click the count. Open tickets. Read two quotes. Then ask, “Do we agree on the driver?” The conversation stays on impact and prioritization. If you want a mental model for how signals flow cleanly from source to presentation, a quick overview of telemetry pipelines is useful context here: What Is A Telemetry Pipeline: The Complete Guide.
Who Owns the Truth When Numbers and Quotes Diverge?
Ownership can’t be fuzzy. Assign metric owners who approve contract changes, maintain tag mappings, and sign off on regression results before deploys. When numbers and quotes diverge, that owner decides whether to roll back or accept the change within the error budget.
This sounds formal. It’s really about speed. With clear ownership, investigations take hours, not days. You avoid committee thrash, announce the decision, and move. Without it, you end up in circular arguments about “what the number really means.” That’s a tax you don’t need.
A Traceable Support Metrics Audit Pipeline Your Team Can Run
A traceable audit pipeline combines contracts, representative samples, automated tests, and drift management. It’s light enough to run weekly and strong enough to hold up in a board meeting. The point isn’t process theater. It’s faster decisions with fewer do‑overs.
Metric Contracts And SLAs That Hold Up Under Scrutiny
Write a one‑page contract per metric. Keep it practical: definition, owner, source of record, refresh schedule, error budget, and the default drillback path. Note the standard group‑by dimensions you’ll use in leadership updates. Keep these in version control. Treat changes like code.
This shifts debates from “what does this mean?” to “did we follow the contract?” You can also add a small SLA: time to investigate drift, time to roll back, time to communicate. Short beats perfect. The habit matters more than the template.
A simple pipeline monitor helps catch issues early. For a primer on alerting and health checks you can adapt, see this walkthrough: Data Pipeline Monitoring.
Representative Samples And Quotes Attached To Every Aggregate
Attach representative samples to each chart by rule, not by taste. Example: top three high‑volume segments and two edge cases. Link each to a pre‑filtered ticket list. Keep two quotes ready that illustrate the driver. You’re not cherry‑picking—you’re speeding up the audit.
This defuses disputes in seconds. Someone asks, “What does this look like for enterprise?” You click. Read two examples. Done. The room stays with you and spends time where it matters: estimating impact, choosing owners, and sequencing work.
Automated Tests You Run Before And After Deployment
Add a small test suite to your deploy routine. Schema checks for required fields. Distribution checks for ranges and class balance. Regression checks to flag when a historical segment flips beyond your error budget. Provenance checks to confirm each aggregate resolves to the right ticket IDs.
None of this is exotic. It’s a handful of assertions that keep you from surprising the business. Run them before deploys and on a schedule after. If something trips, the owner triages, posts a brief, and either rolls back or accepts the new baseline. No drama.
How Revelir AI Makes Support Metrics Verifiable End To End
Revelir AI makes verification the default, not an afterthought. It processes 100% of your support conversations, structures them into metrics you can slice in seconds, and links every chart back to the exact tickets. That’s the audit path. It works in the room.
Evidence‑Backed Drillbacks With Conversation Insights
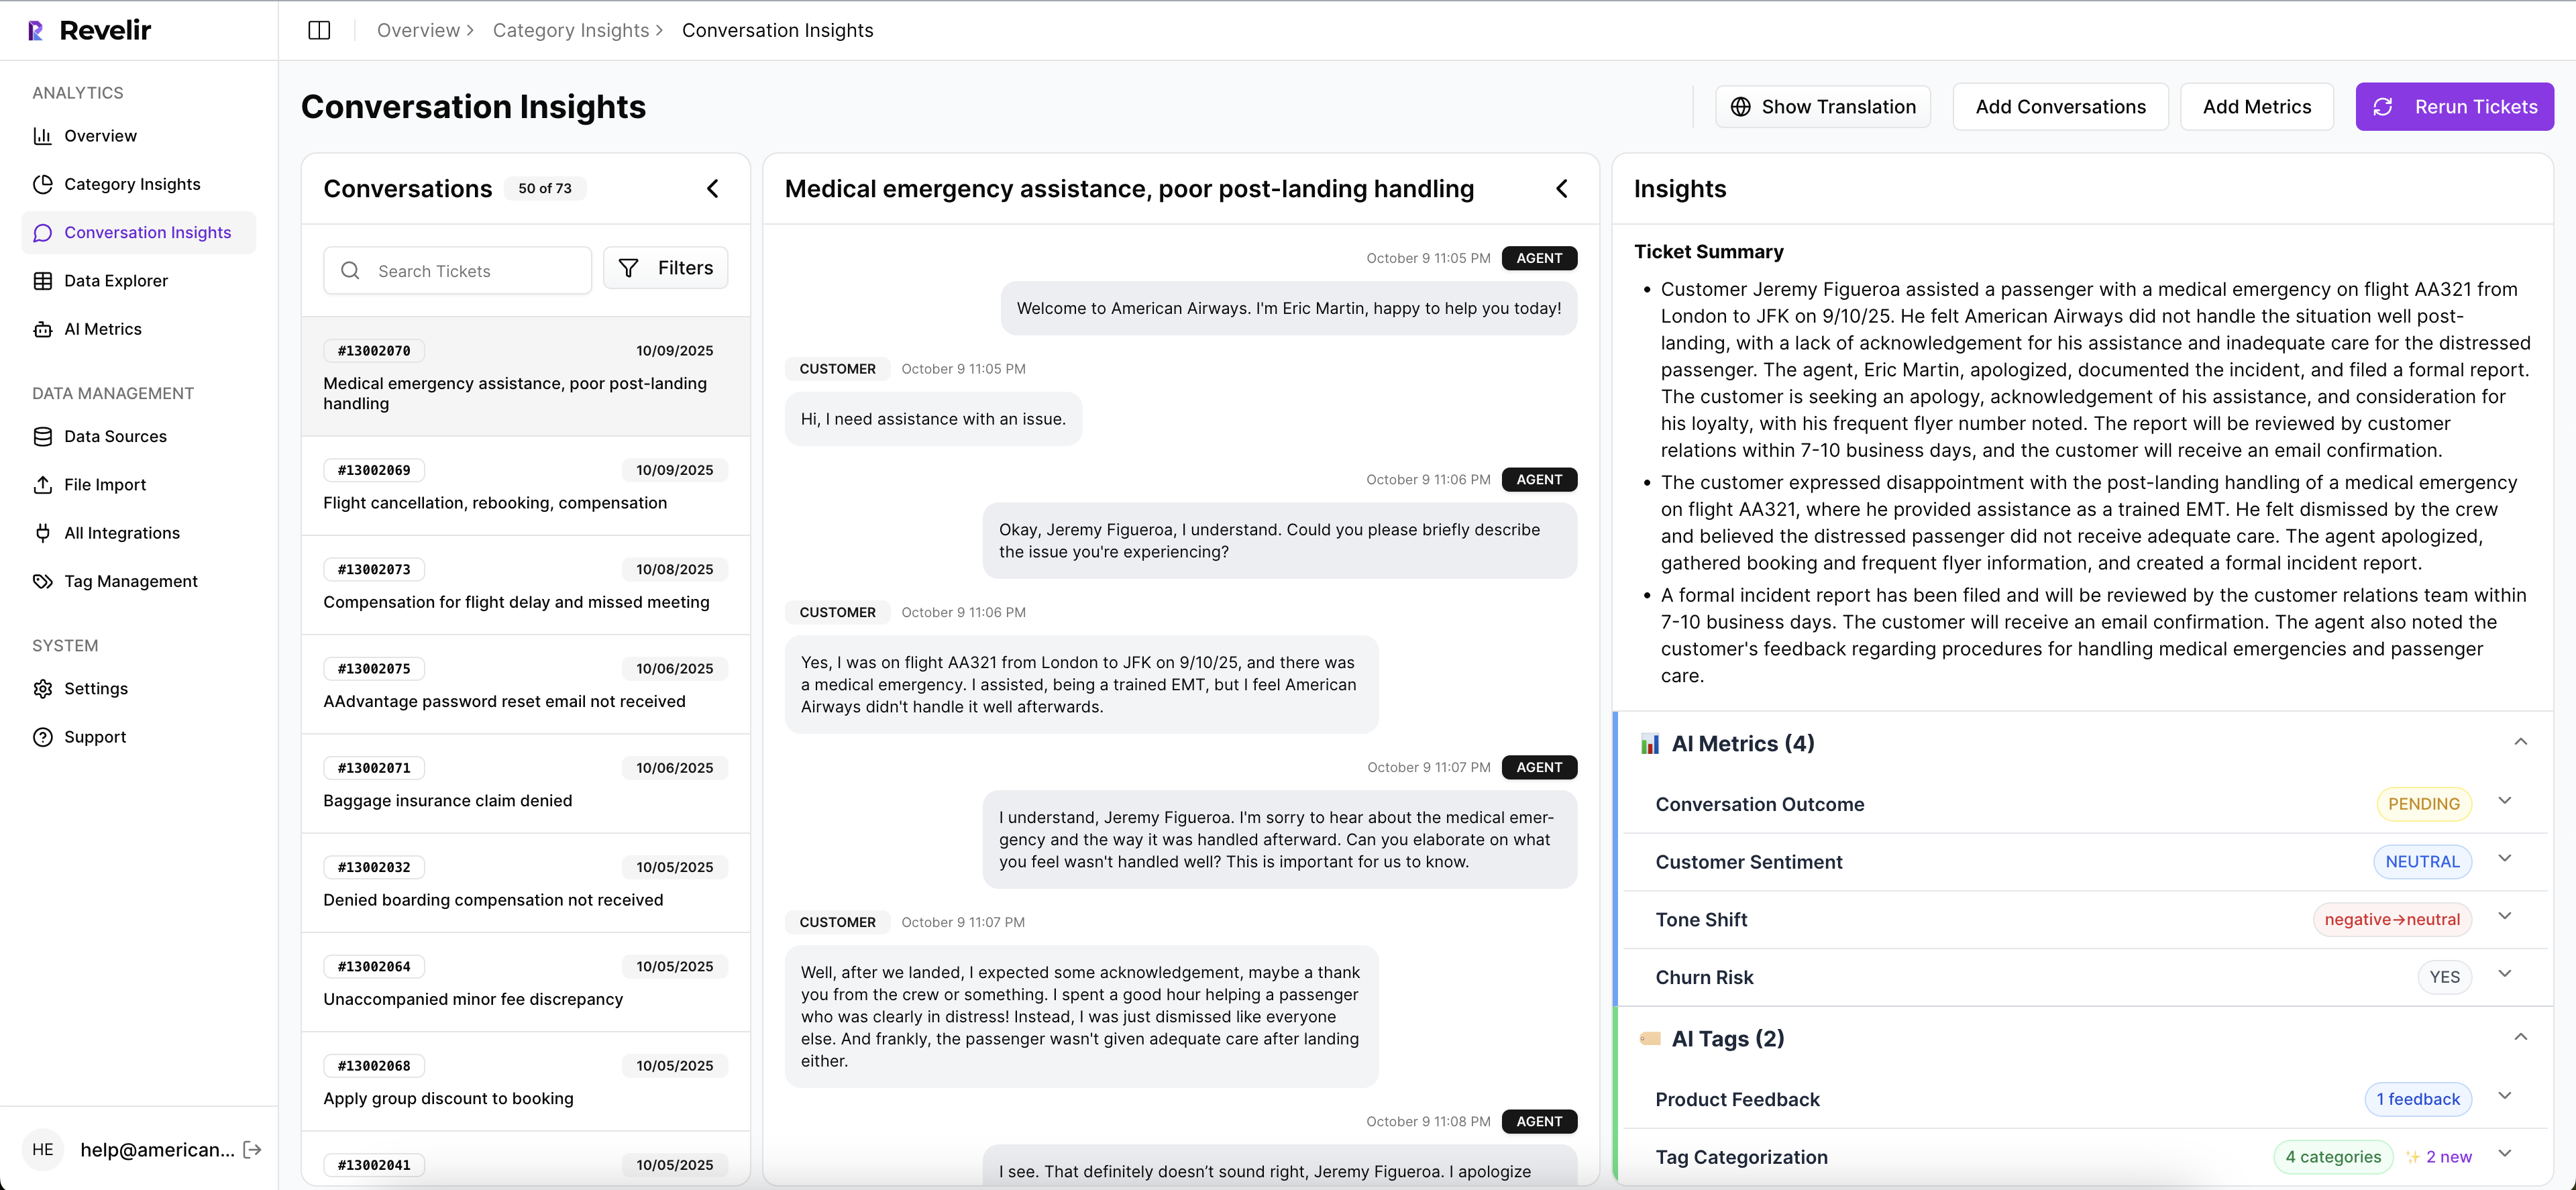
Every count in grouped analysis opens the exact conversations behind it. You see transcripts, AI summaries, tags, and metrics right there. No exports. No screenshots. Just the evidence.

This matters when someone asks “show me the source.” You click, read two quotes, and get back to decisions. The traceability is built‑in, so you don’t need a separate system to defend your findings. It’s fast, which keeps the room engaged. Benefit: faster agreement with fewer detours back to data gathering.
Full‑Coverage Processing, No Sampling Disputes
Revelir AI processes 100% of ingested tickets—no sampling, no subset analysis. Sentiment, churn risk, and effort are computed across the full population, along with any custom AI Metrics you enable. Early signals surface instead of hiding in the unreviewed 90%.

Full coverage removes the “maybe we missed it” argument. It also shrinks the need for ad‑hoc audits during spikes, because your baseline is complete and trusted. Benefit: reliable aggregates that leadership can act on without stalling.
Data Explorer For Repeatable, Representative Slices
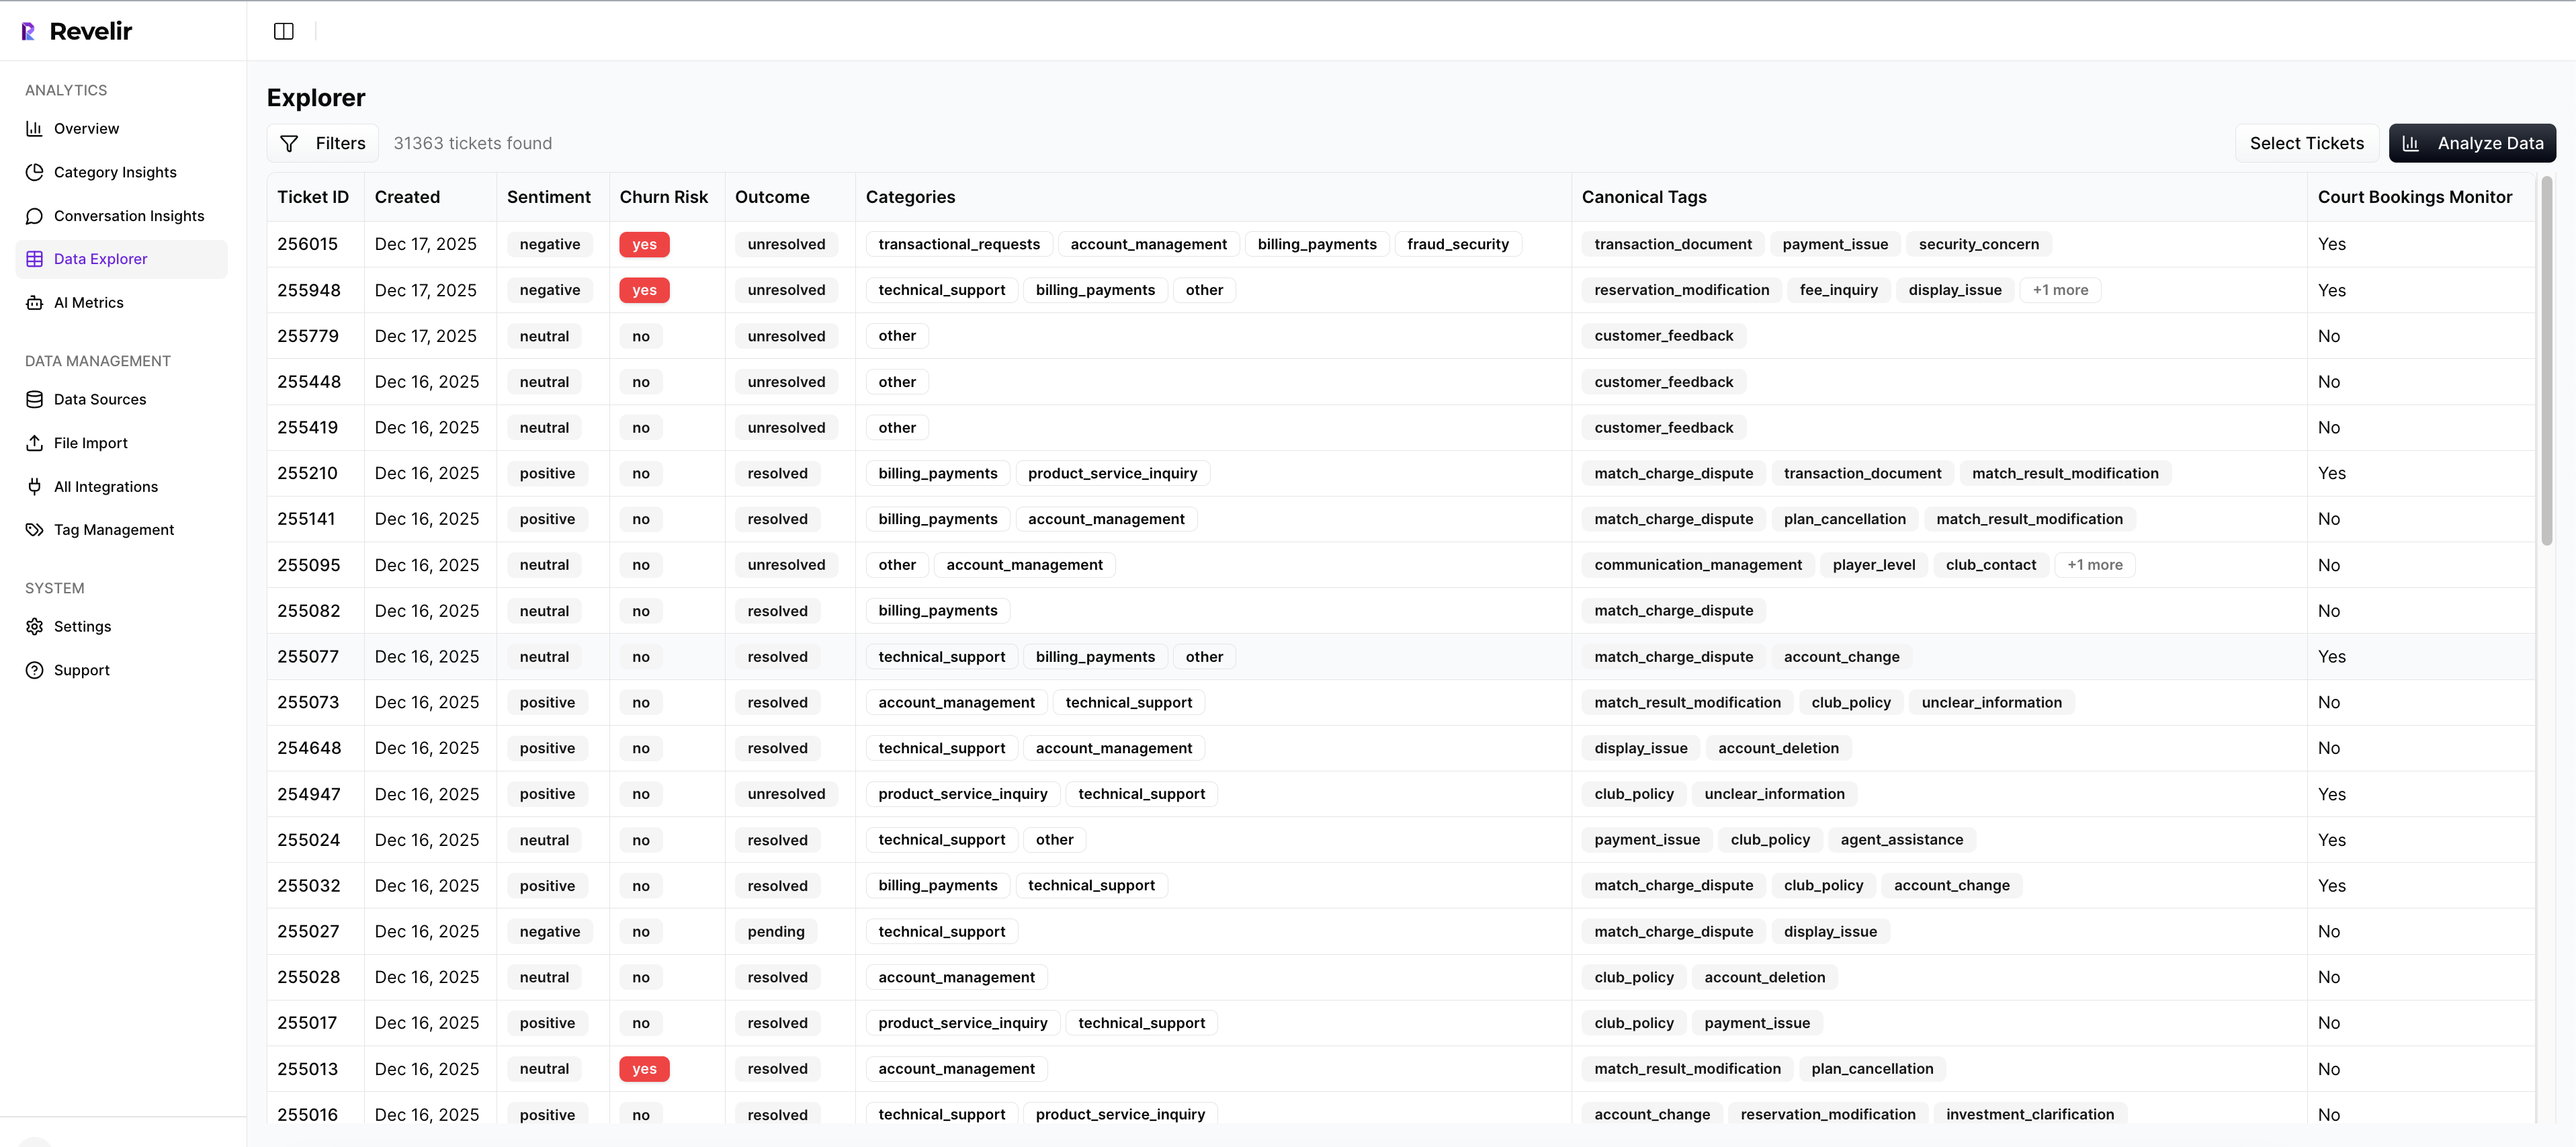
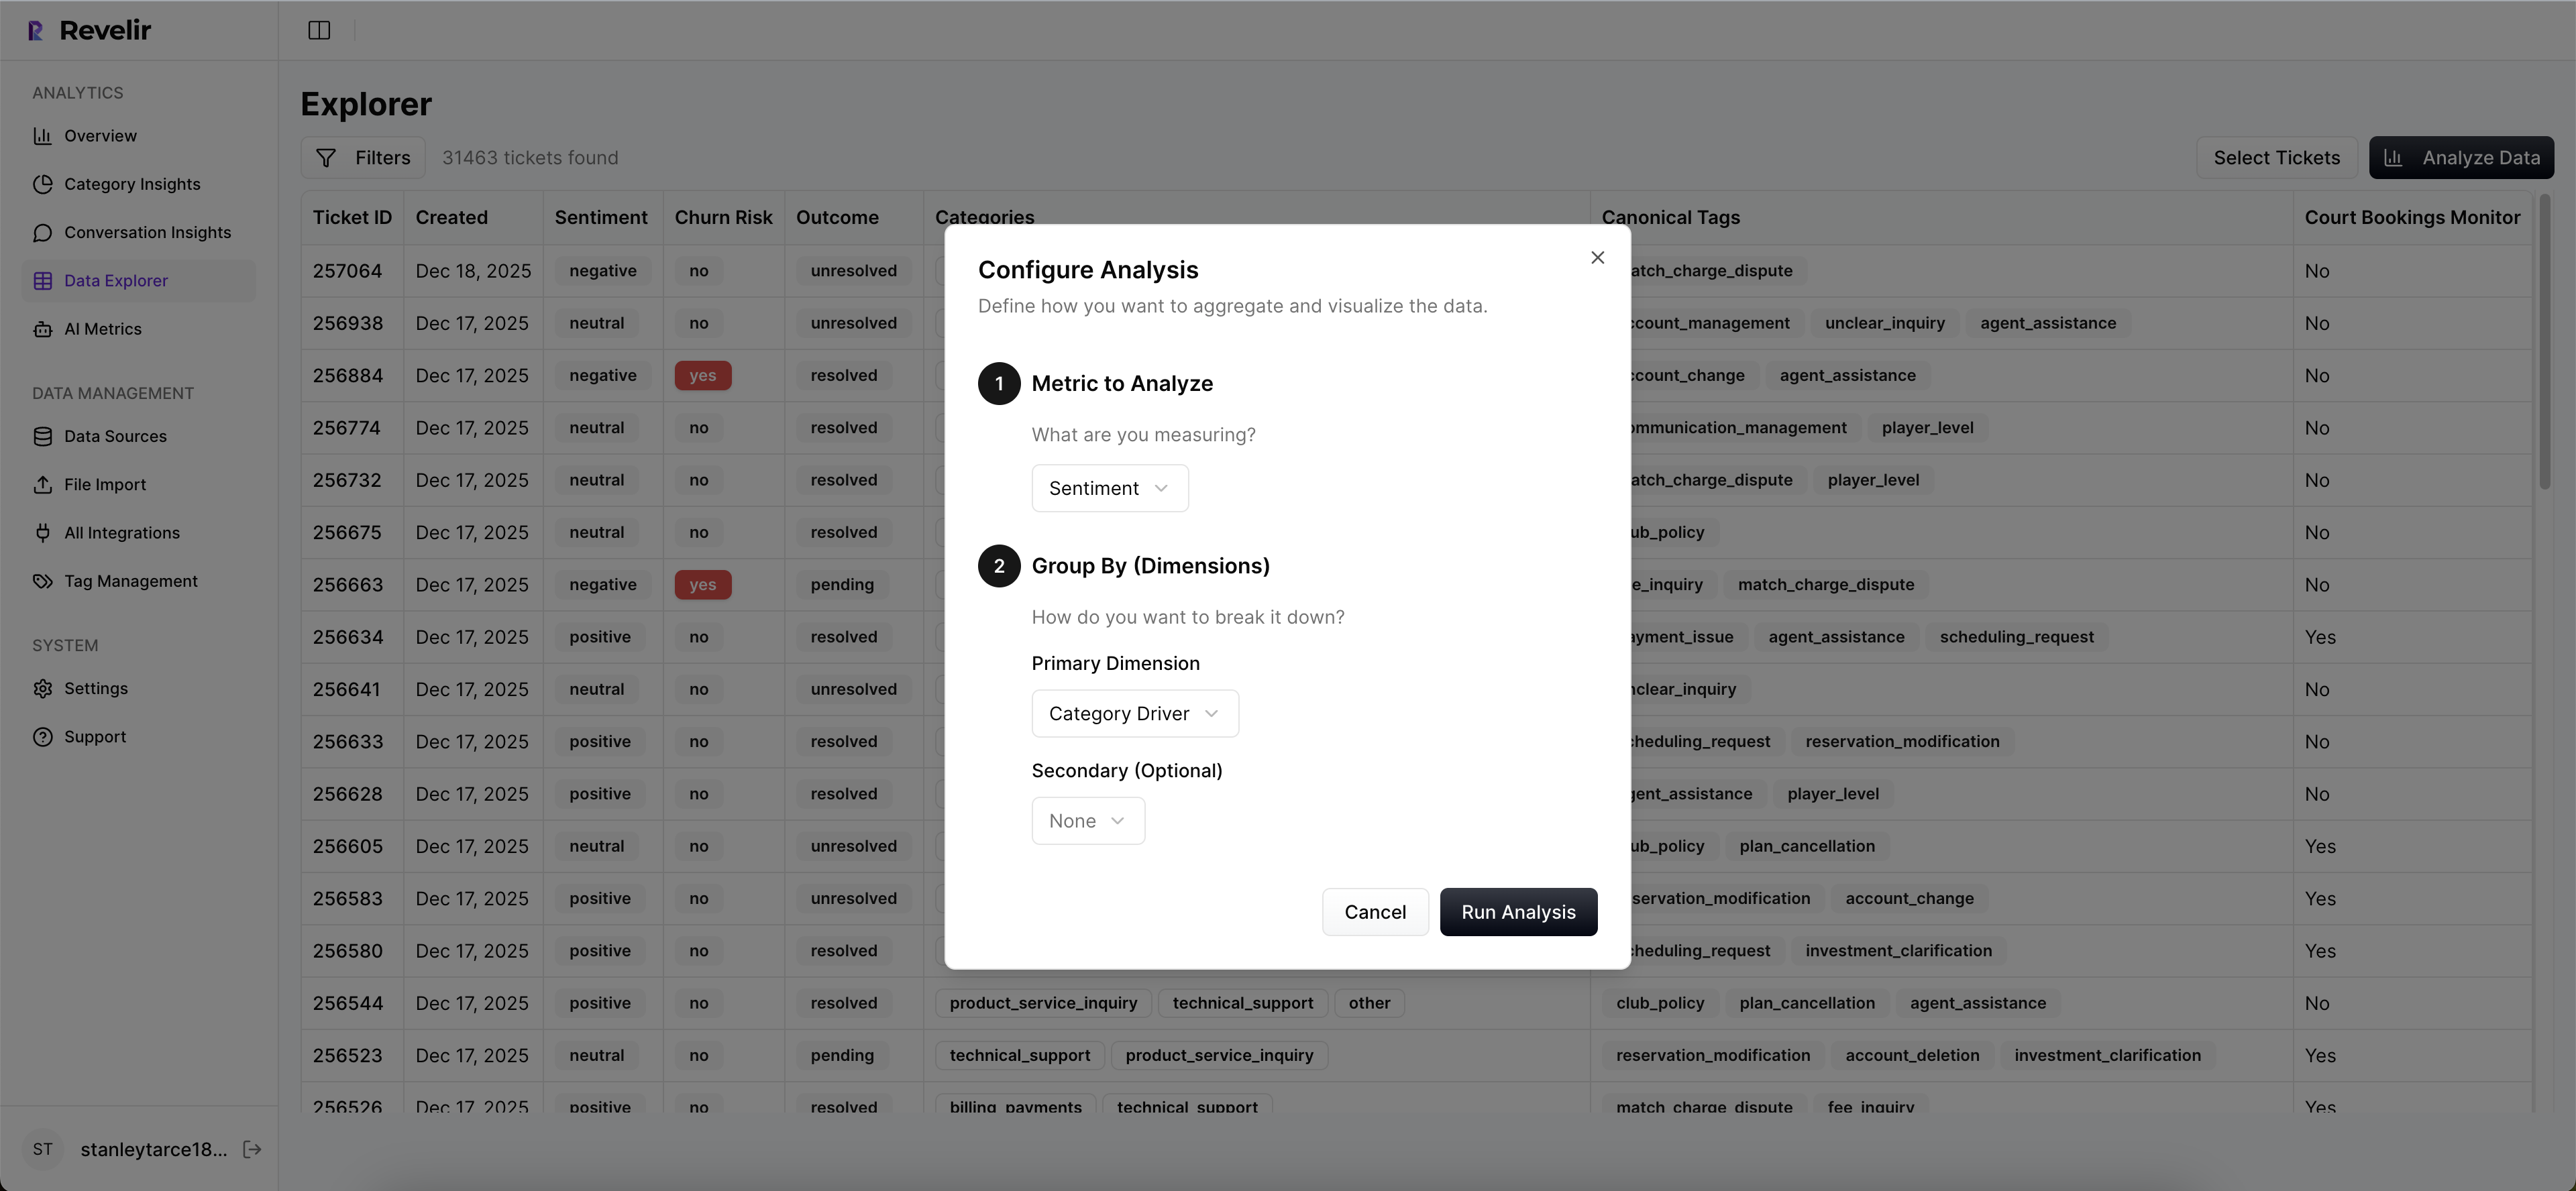
Data Explorer is where you actually work. Filter by sentiment, churn risk, effort, drivers, canonical tags, or custom AI Metrics. Group results, save views for recurring reviews, and click any number to jump into ticket lists for validation. Top‑down patterns meet bottom‑up evidence in one workflow.

When you need to keep BI in sync, export metrics via API so downstream dashboards match the definitions and drillbacks in Revelir AI. Contracts stay enforceable because definitions, values, and audit paths are consistent across tools. Benefit: fewer definition debates and less frustrating rework.
Ready to standardize your audit path and keep the room with you? Get started with Revelir AI (Webflow).
Conclusion
If we’re being honest, most support metric fights aren’t about accuracy. They’re about trust. When every number ties to the exact tickets behind it—and you can prove it in one click—debate shifts from “is this real?” to “what do we do next?”
Build the reliability layer: contracts, full coverage, drillbacks, tests, drift checks. Or let Revelir AI handle the heavy lifting so your team can make decisions faster, with fewer detours. Either way, the rule holds. Evidence wins.
Frequently Asked Questions
How do I start using Revelir AI for my support tickets?
To get started with Revelir AI, first connect your helpdesk system, like Zendesk, to automatically ingest your support tickets. If you prefer, you can also upload a CSV file of your past tickets. Once the tickets are in, Revelir will process them, applying AI metrics such as sentiment and churn risk, and tagging them for easy analysis. You can then access the Data Explorer to filter and analyze the data, helping you uncover actionable insights quickly.
What if I want to customize the metrics in Revelir AI?
You can easily customize the metrics in Revelir AI to match your business needs. Start by defining your own custom AI metrics that reflect specific questions relevant to your operations, such as 'Upsell Opportunity' or 'Reason for Churn.' Once set up, these metrics will be applied consistently across your dataset, allowing you to gain insights that are tailored to your business context. This flexibility helps ensure that the insights you generate are directly actionable.
Can I validate the insights generated by Revelir AI?
Yes, validating insights in Revelir AI is straightforward. After running your analysis in the Data Explorer, you can click on any metric to drill down into the Conversation Insights. This feature allows you to view the full transcripts of the conversations that contributed to the metrics, ensuring that you can verify the context and accuracy of the insights. This traceability builds trust in the data and helps you make informed decisions.
When should I use the Analyze Data feature?
Use the Analyze Data feature in Revelir AI when you want to quickly answer specific questions about your support tickets. For instance, if you're curious about what's driving negative sentiment or which issues are affecting high-value customers, this tool allows you to group and filter your data effectively. By selecting metrics like sentiment or churn risk and applying relevant filters, you can generate insights that are actionable and relevant to your current operational challenges.
Why does Revelir AI emphasize 100% coverage of support conversations?
Revelir AI emphasizes 100% coverage of support conversations to eliminate sampling bias and ensure that no critical signals are missed. By processing every ticket, Revelir provides a complete view of customer sentiment, churn risk, and other important metrics. This comprehensive approach allows teams to make decisions based on the full dataset, rather than relying on partial insights that could lead to misinformed actions. It’s about building a reliable foundation for customer experience improvements.

