

Volume-only backlogs feel decisive. They are not. A support-issue ROI model turns noisy ticket counts into dollars so you can rank fixes by business impact, not gut feel. We will map signals like sentiment, churn risk, and effort to ARR exposure, fold in support and engineering costs, and ship a score you can defend in the room.
If you are tired of anecdote wars, this is your path out. A support-issue ROI model answers the question leadership actually asks: what is the cost if we do nothing, and what is the payoff if we fix it now. It is usually simpler than it sounds once you line up the right inputs and agree on the rules.
Key Takeaways:
- Replace volume-first lists with a support-issue ROI model tied to dollars, not guesses
- Use three predictive signals, sentiment, churn risk, and effort, to estimate ARR at risk by cohort
- Dollarize both sides, support cost today and engineering cost to fix, before you score anything
- Prioritize by ROI score and confidence, then validate with a one-sprint experiment
- Insist on 100% coverage and traceable quotes to stop debates about representativeness
- Operationalize the loop in your analytics workspace so product, CX, and engineering share one backlog
Volume Is Loud, ROI Is Quiet: Build A Support-Issue ROI Model That Ends Anecdote Wars
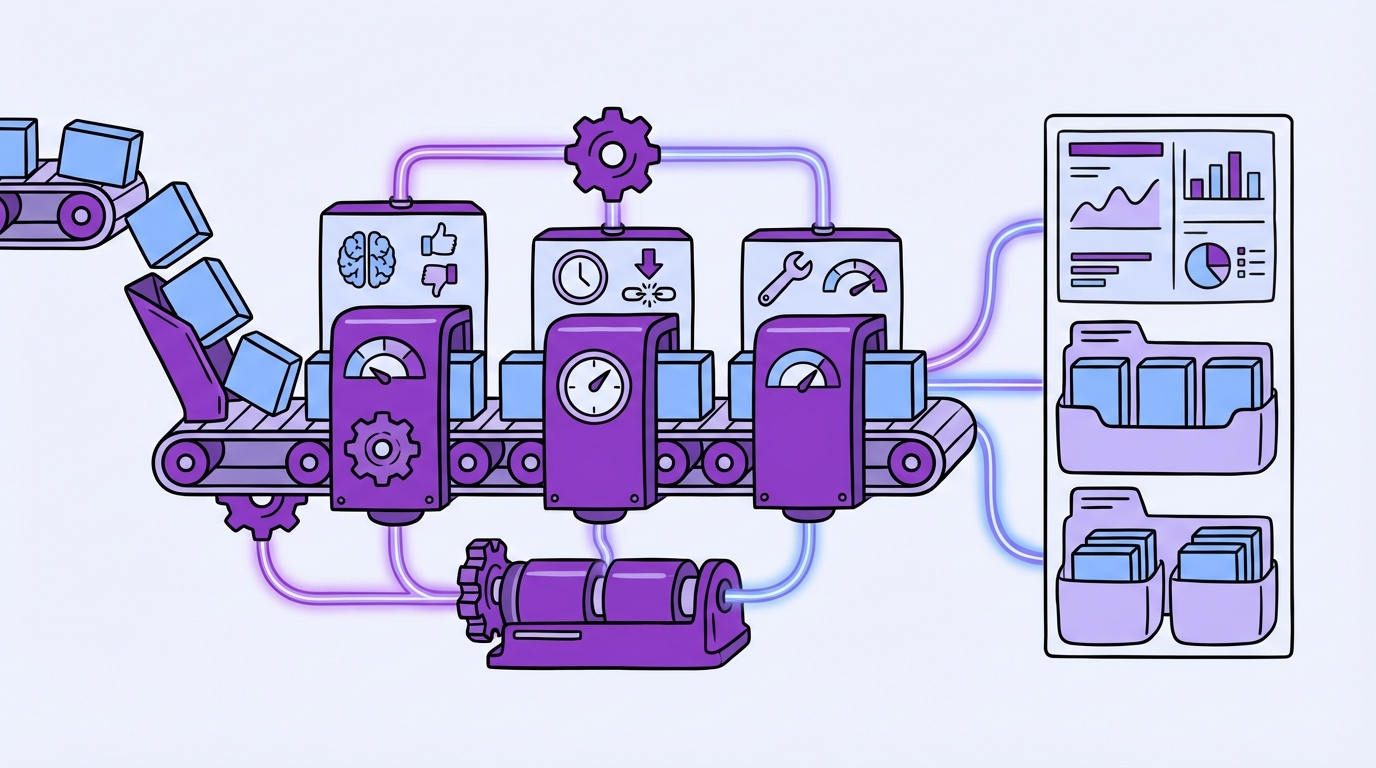
Volume-only backlogs waste time because they ignore severity and revenue concentration. The right unit is money per fix, not tickets per driver. A support-issue ROI model blends ARR exposure, support cost, and remediation effort so teams stop chasing noise and start funding work that actually reduces risk.
Why Volume-First Backlogs Waste Engineering Time
When you rank by counts, you elevate frequent irritants and bury low-volume issues that drive churn. That is the mistake. A forgotten onboarding blocker for new logos can cost more than a hundred minor billing questions. Without dollar context, you set up rework and frustrated teams.
We see the pattern often. A squad ships three fixes in a sprint, ticket volume drops, but negative sentiment and churn signals in the target cohort do not budge. Finance asks for proof of impact. Product points to counts. CX points to quotes. Nobody is checking the money. Put a price on the problem first, then prioritize.
What Signals Actually Predict Business Impact?
Sentiment, churn risk, and customer effort are early, conversational signals that correlate with revenue risk and future volume, while lagging metrics arrive too late to help. Use them together. Churn-risk flags estimate probability, sentiment density shows intensity, and effort tells you where workflows are breaking.
Do not treat these as vanity scores. Tie them to cohorts and renewals. For example, a spike in negative sentiment among enterprise accounts due next quarter is not the same as the same spike in a long-tail free tier. If you need outside framing on ROI thinking, skim the Global ROI CX 2024 report for how leading teams connect CX to revenue.
What Does “Dollarizing Tickets” Mean In Practice?
Every ticket maps to two numbers. First, what it costs you to handle today. Second, what revenue is at risk if you leave it unfixed. Then divide by remediation cost so expensive fixes with weak payback do not clog the roadmap. The math is straightforward once the inputs are stable.
Let’s pretend you process 3,000 tickets a month. You know average handle time, reopen rates, and your fully burdened minute cost. You also know ARR and renewal dates by account. You group tickets into drivers that leadership understands, then compute cost and exposure per driver, per cohort. Now you have a ranked, defensible backlog. Stop chasing volume. Start ranking fixes by dollars with Revelir. Learn More
See The Root Cause, Not The Noise: From Signals To A Support-Issue ROI Model
You cannot score ROI on messy tags. Stabilize your taxonomy, pick the cohorts that matter, and gather the inputs before you calculate anything. This prevents bad math, reduces risk of wrong bets, and makes review meetings faster because everyone sees the same picture.

Inventory The Data You Need Before You Calculate Anything
The model fails when inputs are missing or vague. Start by listing sources and agreeing on proxies where needed. Document them in a simple data dictionary so the same argument does not repeat every month. Clarity up front avoids cost later.
Why it matters: the wrong assumption on handle time or renewal likelihood can swing your ROI rankings and cause real waste. To get it right, assemble:
- Ticket data with sentiment, churn risk, and effort, plus tags and drivers
- Agent time logs or average handle time and reopen rates
- Account ARR, plan tier, tenure, and renewal dates
- Engineering effort estimates and blended cost rates
- Product areas and release windows for scheduling constraints
How Do We Normalize Messy Tags Into Decision-Ready Drivers?
Raw tags are great for discovery, but leaders need categories they recognize. Merge granular tags into canonical tags, then group them under drivers like Billing, Onboarding, and Account Access. Drivers allow apples-to-apples economics because several tags often describe one root issue.
This step is not optional. It ties the math to language the room trusts. Use your analytics workspace to group by canonical tags and drivers, then click into a handful of tickets to validate that the pattern matches real examples. If it does not, fix the mapping before you move on. It saves you from the trust problem later.
What Cohorts Matter For Prioritization?
Cohorts change the math. Plan tier, tenure, region, and product area alter both revenue exposure and fix effect. An onboarding friction driver for new customers can outrank a legacy billing edge case even at lower volume because ARR at risk is concentrated this quarter.
Pick two or three cohorts that drive most of your decisions. Keep it simple. Most teams over-segment and stall. You can refine later. If you want extra context on tying CX measures to business outcomes, this overview on Customer Experience ROI is a helpful primer.
Put Numbers To The Pain: Costs, Churn Exposure, And Effort
The model stands or falls on unit economics. Calculate support costs per driver and cohort, estimate ARR exposure from churn and sentiment signals, then convert engineering effort into dollars. Keep the math transparent so a skeptical exec can follow it in two minutes.
Compute Unit Economics Per Ticket, Driver, And Cohort
Start with average handle time and a fully burdened cost per minute. Multiply to get cost per ticket. Roll that up by driver and cohort. Account for reopen rates and escalation multipliers so you do not understate the cost of broken workflows that bounce around your org.
Build a simple table you can refresh weekly. You want cost per ticket, total monthly cost by driver, and a flag for escalation-heavy areas. Do not get cute with precision. A reasonable estimate that updates often beats a fragile model that nobody trusts. For structure, see how others tie CX to ROI in Three Ways To Map Your Customer Experience Metrics To ROI.
Convert Sentiment And Churn-Risk Signals Into Expected ARR Exposure
Treat churn-risk density as a probability signal, adjusted by historical renewal rates for that cohort. Multiply by ARR for accounts in scope. For negative sentiment and high effort, apply hazard multipliers based on prior periods. Then, document confidence ranges. False precision is a trap.
It is usually enough to bucket confidence as high, medium, or low based on sample size and stability. You are not predicting the stock market. You are ranking work. So be strict about method and humble about certainty. When the number moves, make sure you can show why.
Translate Engineering, QA, And Rollout Effort Into Remediation Cost
Take story points or hours and convert them into dollars using a blended rate across engineering, QA, and release management. Add change-management and support playbook updates if they are part of the fix. Then run a quick sanity check with the tech lead so you do not understate the real work.
Tie this cost back to the ARR and support-cost savings you modeled above. A fix that saves thousands in support minutes but risks a multi-week cross-team rollout might still rank below a targeted onboarding change that removes churn signals before renewal. Context matters more than elegance.
Faster, defensible prioritization with measurable impact. That is what teams want. See How Revelir AI Works
What It Feels Like To Stay In The Old Way
Staying with sampling and score-watching feels safe, until it does not. You lose time, you miss early churn signals, and you end up debating the loudest anecdote in the room. Full coverage with traceable quotes ends those arguments and speeds up decisions.
The Costly Spiral Of Rework And Skepticism
Engineers ship fixes that do not move sentiment or churn density for the target cohort. CX reopens tickets. Finance asks for ROI. Priorities stall. People feel the grind as frustration and delay. The root problem is trust. If a chart cannot be traced to real conversations, stakeholders push back.
We have all been in that meeting. Someone says, “Show me where this came from.” A spreadsheet appears. No quotes. No path back to tickets. Confidence drops. The cost is not just time. It is missed improvement windows and creeping churn risk that shows up when it is too late to act.
Why “Read A Few Tickets” Feels Right But Fails At Scale
Manual review catches nuance. It fails at coverage. Ten percent samples introduce bias, delay detection, and reward confident opinions. The quiet churn signal gets missed. The loud complaint drives the roadmap. You lose. Then you redo the work a month later when the numbers contradict the story.
Set a higher bar. Insist on analyzing every conversation with a path back to the exact quotes. That is how you get past “we think” and into “we know.” If you want a short frame for this, read the line many teams adopt: evidence or it did not happen.
The Playbook: Build And Run Your Support-Issue ROI Model
A workable model fits on one page. Score equals expected ARR recovered plus support cost saved, divided by remediation cost, multiplied by a confidence weight. Ship the score, then validate it with a one-sprint experiment. Keep the loop tight so you learn faster than the problem spreads.
The Scoring Formula You Can Ship This Sprint
Keep it simple and transparent. Teams accept trade-offs when they can see the math. Your score should be stable week to week but sensitive enough to reflect new information when signals shift. Cap extremes so one odd week does not hijack the backlog.
Use this base:
- ROI score = (Expected ARR recovered + Support cost saved over window) / Remediation cost
- Multiply by Confidence weight between 0.5 and 1.0
- Confidence weight reflects sample size, driver stability, and validation status
Add guardrails. Cap savings and exposure at the 95th percentile. Use rolling 4 to 8 week windows to smooth noise. If a driver is under-sampled, reduce confidence until you run a validation pass.
How Do We Prioritize When Confidence Is Low?
Split the queue. Lane A is high-confidence, high-ROI fixes. They go straight to engineering. Lane B is high-ROI but low-confidence. They get a quick validation run first. You avoid risky bets jumping the line while still surfacing big upside.
This is where judgment belongs. If there is a regulatory or brand risk, you may act sooner with lower confidence. Just say it out loud and mark the exception. The worst outcome is pretending you have certainty when you do not. That erodes trust.
Validation And Experiment Plan That Fits One Sprint
Design a small, fast test. Define success before you ship. Then hold the line when the results come back. No moving goalposts.
To keep it practical:
- Choose A or B rollout or a phased release to a high-risk cohort
- Define success metrics, sentiment delta, effort change, churn-signal reduction, and volume drop for the driver
- Set a minimum observation window, for example, two weeks of post-release data
- Pre-commit pass, hold, or revert thresholds with product and CX
- Pull 3 to 5 representative quotes to explain the outcome in leadership updates
How Revelir AI Operationalizes The Support-Issue ROI Model
A model is only useful if you can run it every week without heroics. Revelir processes 100 percent of your tickets, scores each conversation with sentiment, churn risk, and effort, groups them under canonical tags and drivers, and lets you pivot by cohort in Data Explorer. Every metric links back to the exact conversation.
Evidence-Backed Metrics And Full-Coverage Processing
Sampling and black-box scores create risk and delay. Revelir analyzes every conversation, then stores sentiment, churn risk, and effort alongside your tags, canonical tags, and drivers. The result is a complete, structured dataset you can explore without guesswork, and audit without drama.
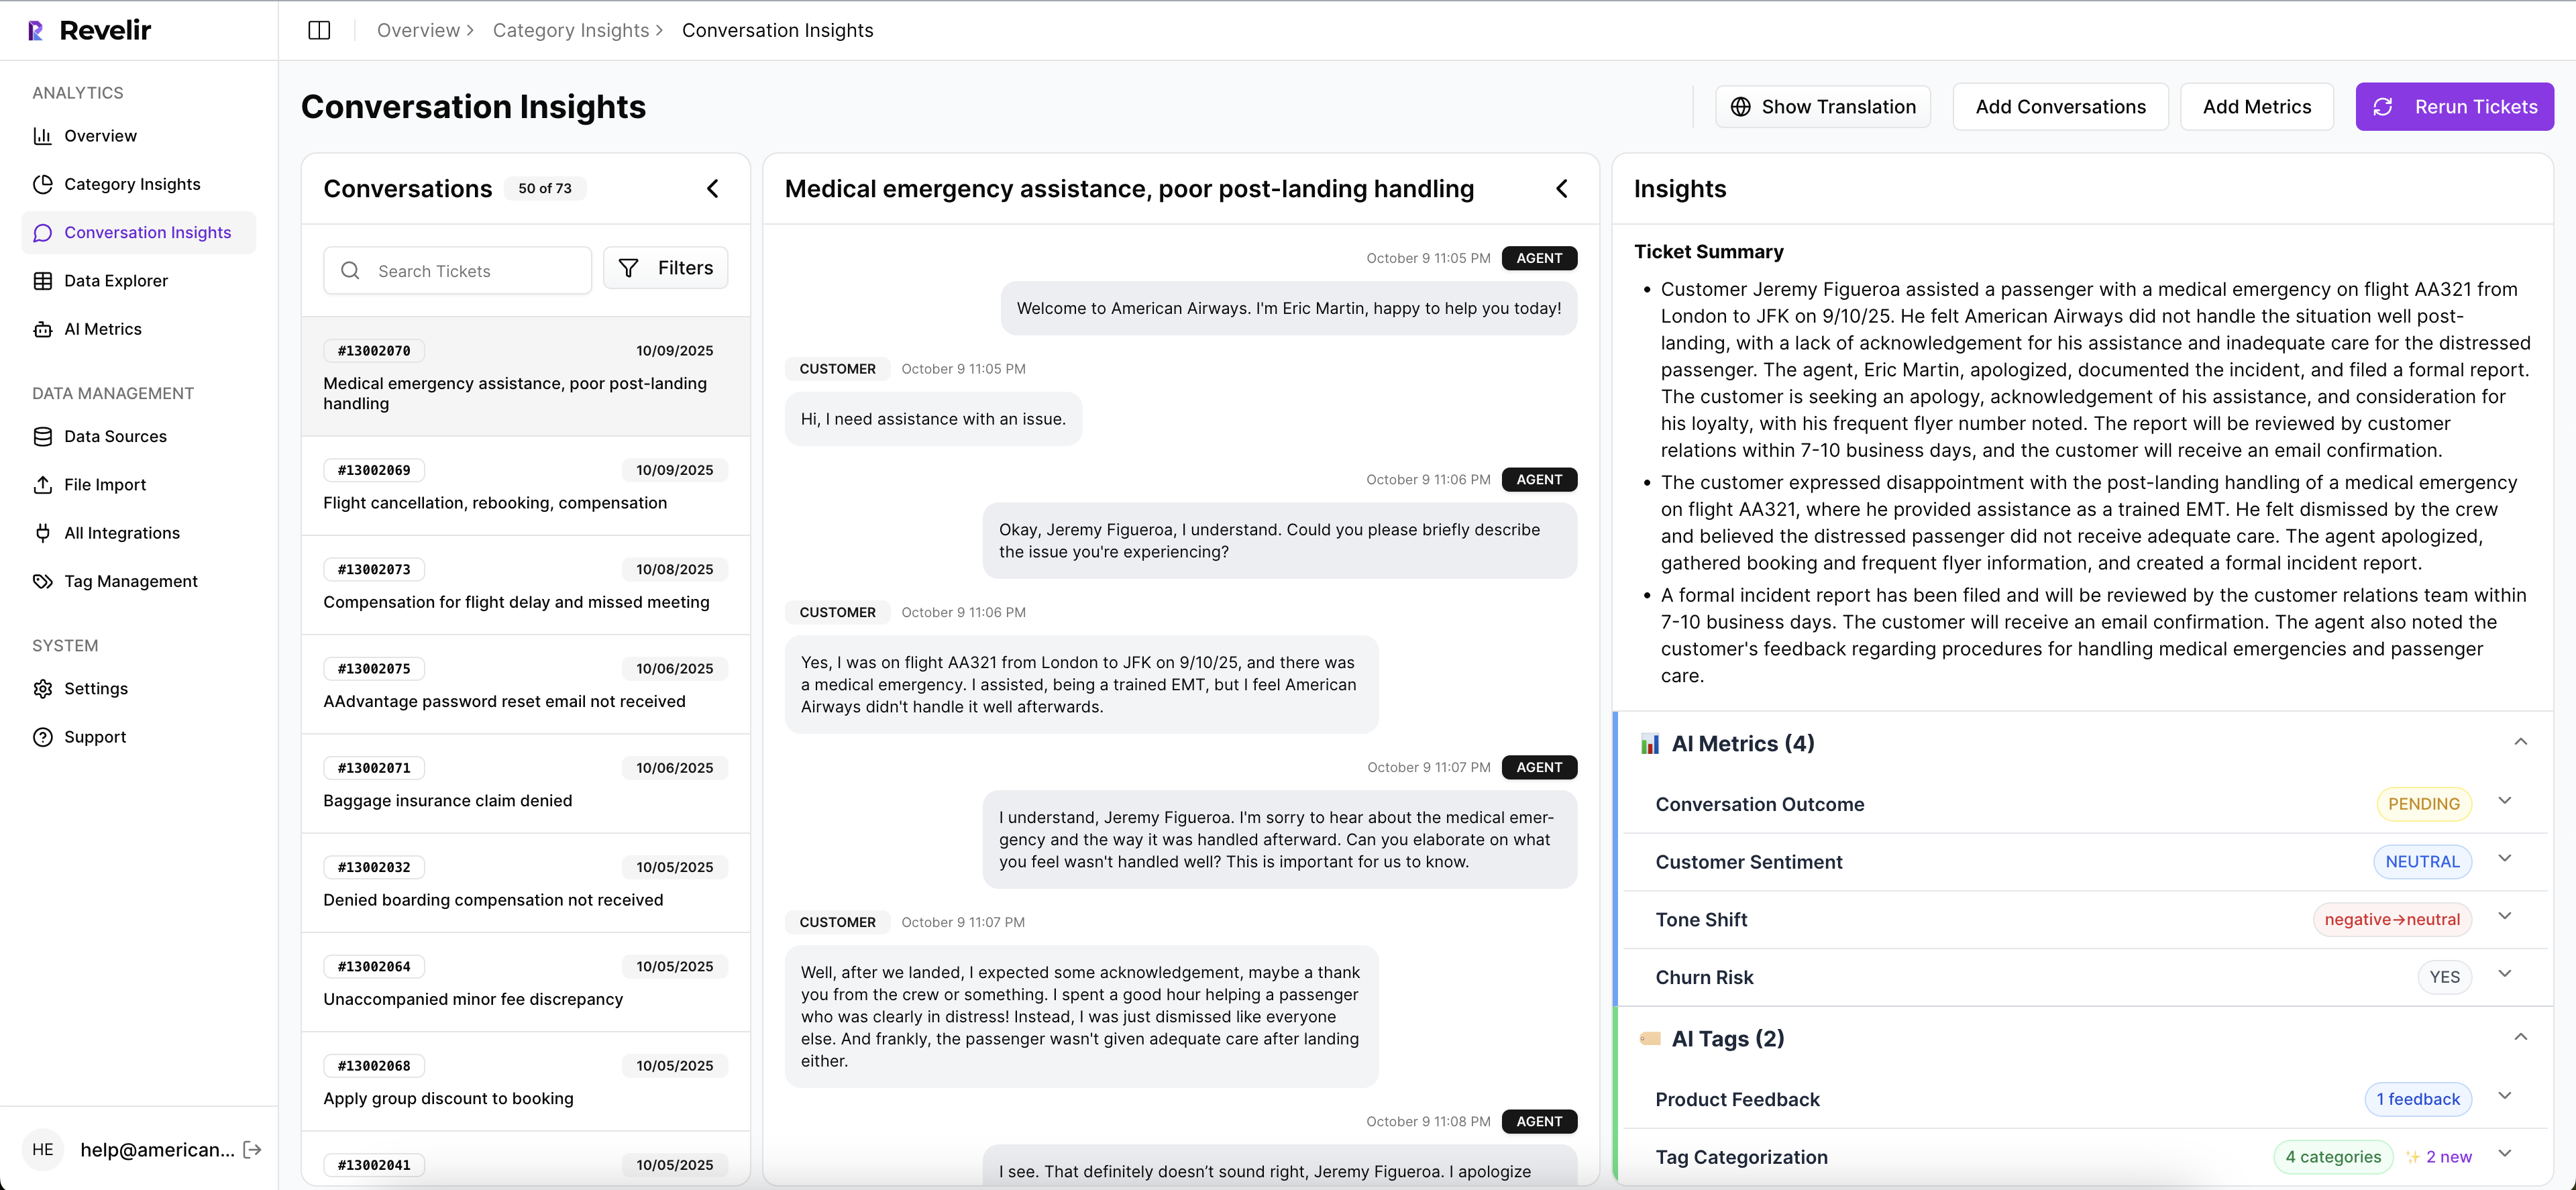
Traceability matters. In Revelir, any count or chart can be clicked to open the Conversation Insights view with the transcript, summary, and the metrics that generated it. That is how you assign confidence weights honestly and cut the “show me the proof” moment from ten minutes to ten seconds.
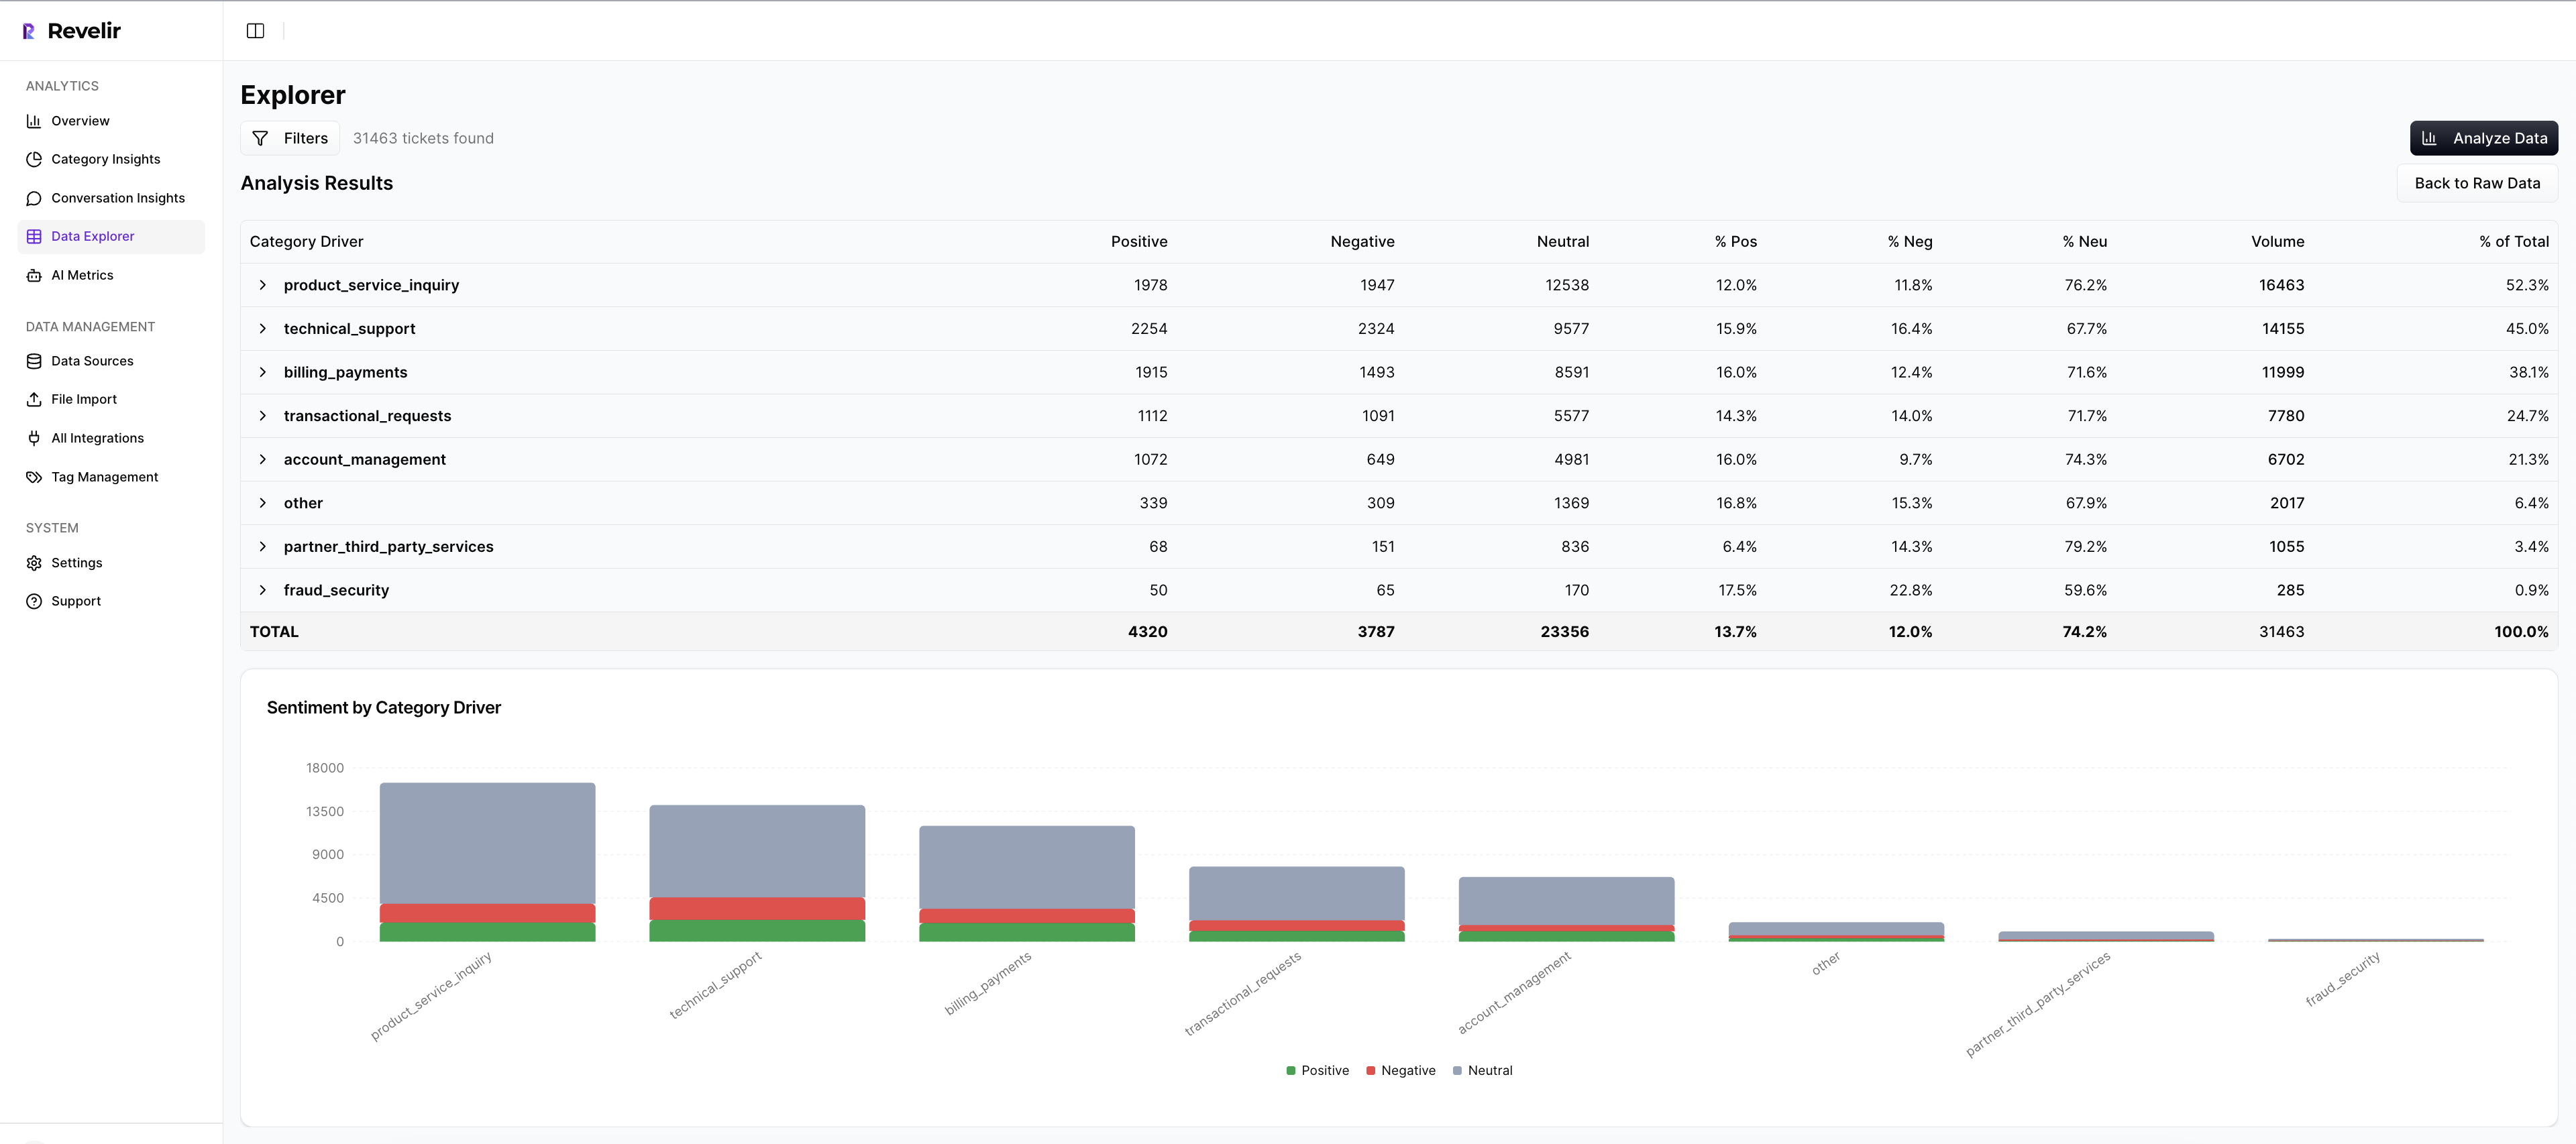
Driver-Level Prioritization In Data Explorer
Teams use Data Explorer to group by drivers and cohorts, then attach unit costs and ARR exposure from the model you built. You see negative sentiment density for Billing among enterprise renewals next quarter, the churn-risk share within that slice, and the support minutes it burns.

From there, you export or copy the backlog-ready list, already labeled with driver, cohort, expected savings, remediation cost, and confidence. Debates shrink. Decisions move faster. The headache of reconciling anecdotes to numbers fades because the evidence is one click away.
Closing The Loop With Validation And Reporting
After a fix ships, you monitor the target driver’s sentiment share, effort, churn-risk density, and volume in Analyze Data. Then click into Conversation Insights to pull three quotes that show what changed. Add them to your leadership update so the win is visible and verifiable.
Most teams track weekly. When a result misses, you do not lose a month. You adjust the mapping, tighten the metric, or run one more cohort cut. The loop keeps trust high because the evidence is in the same place as the number.
Revelir turns noisy support conversations into evidence-backed metrics you can trust. If you want to run this model without spreadsheets, start where teams already work. Get Started With Revelir AI
Conclusion
Volume is loud. ROI is quiet. When you align on a support-issue ROI model, you end the anecdote wars and fund work that cuts risk, cost, and churn. Build the inputs, score the backlog with confidence weights, validate in one sprint, then make it routine. The fastest path is a system that measures every conversation and preserves the evidence.
Frequently Asked Questions
How do I prioritize support issues using Revelir AI?
To prioritize support issues with Revelir AI, start by using the Analyze Data feature. 1) Choose a relevant period, like the last 30 days. 2) Add columns for metrics such as Sentiment, Churn Risk, and Customer Effort. 3) Run the analysis to see which issues have the highest negative sentiment or churn risk. This structured approach helps you focus on the most critical problems affecting customer experience and retention.
What if I need to validate insights from Revelir AI?
If you want to validate insights from Revelir AI, use the Conversation Insights feature. 1) Click on any metric in your analysis results to view the underlying tickets. 2) Review the full transcripts and AI-generated summaries to ensure the data matches your expectations. 3) This step helps confirm that the patterns you see in the data are reflected in actual customer conversations, ensuring you make informed decisions.
Can I customize metrics in Revelir AI?
Yes, you can customize metrics in Revelir AI to align with your business needs. 1) Define custom AI Metrics that reflect your specific terminology or focus areas, such as 'Upsell Opportunity' or 'Reason for Churn.' 2) Enable these metrics in your workspace so they appear in Data Explorer. 3) This flexibility allows you to track the metrics that matter most to your organization and make data-driven decisions.
When should I use the Data Explorer feature?
You should use the Data Explorer feature whenever you need to analyze support tickets in detail. 1) It's ideal for ad-hoc analysis, allowing you to filter and group tickets by various metrics like Sentiment and Churn Risk. 2) Use it to identify trends or specific issues that need attention. 3) The ability to drill down into individual tickets helps you validate insights and understand the context behind the data.
Why does Revelir AI emphasize 100% coverage of conversations?
Revelir AI emphasizes 100% coverage of conversations to ensure that no critical signals are missed. 1) By analyzing every ticket, it helps identify early signs of churn risk and customer frustration that might be overlooked in sampling. 2) This comprehensive approach provides a complete view of customer sentiment and operational issues. 3) Ultimately, it allows teams to make more informed decisions based on reliable, evidence-backed metrics.