

Your support queue already knows which accounts will stick around and which are quietly packing their bags. The signals are not subtle. Frustration cues in the transcript. Payment friction that drags on. Workarounds your team keeps advising because a workflow fails in the same spot every week.
You do not need another score without a story. You need a way to turn messy conversations into evidence you can act on. That starts with seven signals, a simple taxonomy, and a pipeline that rolls conversation-level risk into account-level decisions. Then you can show receipts in every meeting.
Key Takeaways:
- Detect churn risk from conversations by tracking seven signals, then roll them into driver and account risk scores
- Stop sampling, analyze 100% of tickets, and link every alert to quotes so CSMs can trust and act quickly
- Build a small, durable taxonomy with severity tiers, explicit weights, and clear promotion rules to avoid bias
- Quantify escalation and workflow failure costs to shift prioritization from anecdotes to evidence
- Make alerts auditable with drivers, dates, quotes, and next actions to reduce debate and speed decisions
- Use an evidence-backed pipeline in the analytics interface, with drill-downs in the conversation review tool, to validate and iterate
Why Your Support Queue Already Knows Who Will Churn
Your support conversations contain early churn signals long before renewal. Frustration builds across messages, billing gets messy, or workarounds become routine. When you measure these patterns across 100% of tickets and preserve quotes, you can spot risk in time to act. Think of the enterprise account that reopened the same onboarding ticket three times.
Extract frustration cues with a simple rubric
Start with a clear pattern for frustration: sustained negative sentiment across turns, high-effort language like “I’ve tried three times” or “still not working,” and time pressure like “need this fixed today.” Combine the language with context, for example, slow resolution or repeated transfers. Set these cues as standalone risk and as multipliers for other signals.
Operationalize this with full coverage, not samples. Filter for negative sentiment and high effort to find hotspots, then read a handful of transcripts to calibrate what “true frustration” means in your world. Document phrases, agent behaviors, and resolution paths you see in tickets that eventually churned. You want CSMs and analysts using the same definitions.
Detect explicit and unlabeled churn mentions
Build a dual pattern for churn language. Catch explicit phrases like “cancel,” “switching,” or “not renewing,” and catch indirect intent like “this isn’t worth it” or “looking at alternatives.” Treat explicit mentions with higher default weight. Note the timing relative to renewal, because a quiet “we may reduce seats” inside the window is a different risk than a casual comparison in month two.
Validate with transcripts. When a conversation triggers the flag, click through and save representative quotes for stakeholder decks. Over time, add edge phrases you hear in your industry, like “moving providers,” “turning off seats,” or “rolling back deployment.” Research on dialogue intent classification shows both explicit and implicit signals drive model accuracy, especially when combined with context windows, as seen in ACL work on intent detection in conversations.
What churn detection from conversations really means
Think in layers. Signals live at the micro level inside single conversations. Drivers sit at the meso level across categories like Billing or Onboarding. Account risk is the macro view across tickets and time. Respect nuance. One angry message is not the same as a sustained pattern over days. Weight duration, recurrence, and association with critical drivers like onboarding or payments. The goal is a trustworthy threshold that holds up when leadership asks hard questions.
The Real Blocker Is Bias, Not Tooling
Most teams do not lack tooling. They lack consistent definitions and full-population data. Sampling introduces bias, score-only dashboards hide causes, and ad-hoc tags invite debate. A small, shared taxonomy with clear rules fixes that. Then the conversation shifts from “is this representative” to “what do we fix first.”
Build a churn-risk taxonomy that leadership trusts
Use a hybrid taxonomy. Let AI generate granular raw tags from transcripts, then roll them up into canonical tags that match your business language. Group canonical tags under drivers like Billing, Onboarding, Account Access, and Performance. Keep the set small. Expand only when a new category proves it adds clarity.
Drivers are your reporting lens. They connect the messy transcript to leadership’s mental model. Revelir’s hybrid approach, where raw tags roll into canonical tags and then into drivers, gives your reports structure without losing discovery power.
Define severity tiers and mapping rules
For each signal, specify severity tiers, default weights, and promotion rules. For example, two low-severity onboarding issues within 14 days might promote that driver to medium risk. Three workaround mentions in two weeks could bump workflow risk, even if sentiment has calmed. Document how conversation signals roll up to drivers and accounts. This prevents “choose-your-own-adventure” scoring during pressure moments.
A practical scheme looks like this:
Short note, then weight: time proximity to renewal, account tier, and recurrence over a rolling window.
Ingest and normalize 100% of conversations
Connect your helpdesk or upload CSVs so every ticket flows through one pipeline. Normalize timestamps, ticket IDs, requester names, and account IDs. Ensure agent and customer messages are present for tone and effort accuracy. Maintain consistent account identifiers so you can aggregate signals cleanly to the account level. It feels tedious at first, and later liberating.
Curious what this looks like in practice? See how Revelir AI works.
The Hidden Costs Of Partial Coverage And Score-Only Dashboards
Partial coverage and score-watching hide risk, delay fixes, and burn time in meetings. You spend hours debating whether a sample is representative rather than solving the root cause. With 100% coverage and traceable quotes, you shift from guesswork to decisions. That switch reduces false alarms and surfaces quieter, compounding patterns.

Trace escalation patterns and quantify the tax
Define escalation as multi-touch, multi-assignee, or manager-involved sequences, plus patterns like “reopen → reassignment → policy override.” Track where escalations cluster by driver and account tier. Early escalation clusters often predict churn even when senior agents pacify tone.
Imagine 60 enterprise tickets escalated last month at an average of 25 extra minutes each. That is 25 hours of rework and management attention. Now tie those hours to drivers and pull three quotes from the conversation review tool. This turns a hand-wavy problem into a prioritized backlog item with a measurable payback.
Flag product-workflow failures with evidence
Encode failure patterns for core workflows. Look for repeated errors, stuck syncs, or brittle sequences that require manual intervention. Use granular raw tags like “export_failed” or “sync_stuck,” then roll them into canonical tags under a Performance or Workflow driver. Increase weight when failures block ROI-critical outcomes. Studies on multi-signal models show combining operational events with language cues lifts predictive power compared with single-source scores, as discussed in Scientific Reports coverage of multi-feature risk modeling.
Your Team Needs Alerts They Can Stand Behind
Alerts only work when CSMs trust them. Trust comes from two things: clear thresholds and fast access to the evidence. When every alert carries drivers, quotes, and links to transcripts, a CSM can confirm context in 30 seconds and act with confidence.
Identify repeated workarounds
Workarounds are churn accelerants. Tag language like “for now, do X,” “manual fix,” or “temporary workaround.” If the workaround recurs across accounts or persists over weeks, raise severity even when sentiment looks neutral. Workarounds consume goodwill and hide workflow debt from roadmap conversations.
Write the CSM note in a ready-to-send format: “Observed 3 workaround mentions in 14 days for Account A, linked to Report Builder. Representative excerpt: ‘We are manually exporting weekly because sync fails.’ Proposed fix and timing below.”
Surface payment and renewal concerns
Separate payment failure and renewal anxiety from generic billing questions. Track “card declined,” “invoice mismatch,” “seat creep,” and “cancellation window” conversations. Auto-raise risk when these happen within 60 days of renewal or follow a frustration streak. Pair finance signals with workflow friction. A payment issue plus failed exports deserves immediate outreach coordinated with Finance.
Open research reviews of sentiment and intent detection in operational texts reinforce that financial and renewal topics materially change risk classification, and that mixed-signal rules outperform sentiment-only methods, as summarized in an open-access review of sentiment analysis in practical deployments.
The Better Way: An Evidence-Backed Detection Pipeline
An effective pipeline scores conversation signals, aggregates them to the account level, and attaches evidence that speeds action. It is transparent by design. Everyone can see the weights, the drivers, and the quotes. That structure turns alerts into outcomes rather than more noise.
Score and aggregate risk to accounts
Start at the conversation level with explicit weights. For example, high weight for explicit churn mentions and payment concerns, medium to high for product-workflow failures, medium for onboarding friction, medium for escalation, medium for repeated workarounds, and low to medium for frustration cues as a multiplier. Apply freshness decay so recent events count more.
Roll up to account scores across a 30 to 90 day window. Cap redundant repeats. Add business rules like “one high plus one medium within 14 days equals high account risk.” Validate monthly against closed-lost and saved accounts. Research on dialog-based risk signals supports multi-signal scoring over single-label sentiment, as shown in conference work on conversation-level intent and risk modeling.
What evidence every alert should carry
Include the driver, triggering signal or signals, severity, date range, representative quotes with links, and a suggested next action. List signals in order with weights when they co-occur. Evidence turns a score into a story. It also makes coaching easier, because managers can open the same quotes and align on what “good” outreach looks like.
Operational triage, routing, and measurement
Route by driver and tier. Create saved views for “high risk plus Billing for Enterprise,” “onboarding friction for SMB,” and similar slices. Assign owners, set review cadences, and standardize outreach checklists that cover context confirmation, proposed fix, follow-up schedule, and outcome tracking. Measure precision on top-risk cohorts, time-to-first-action, and ARR at risk versus ARR saved. Review false positives in short huddles, refine weights, and document each rule change. A recent journal article on multi-factor customer risk scoring shows teams improve precision when they iterate on weights with real outcomes, not intuition, which aligns with findings reported in a peer-reviewed study on conversational risk scoring in service operations.
Ready to eliminate sampling and guessing from your process? Learn More.
How Revelir AI Operationalizes This End-To-End
Revelir AI turns the pipeline above into a day-to-day workflow you can run in minutes. Connect data, apply AI metrics and tags with full coverage, group by drivers in the analytics interface, and click into the conversation review tool to validate quotes. You move from unstructured text to structured, evidence-backed metrics without manual tagging.
Connect data and get 100% coverage with Revelir AI
Start with a Zendesk integration or a CSV upload. Revelir AI ingests tickets with transcripts, tags, and metadata, then processes 100% of conversations through its AI tagging and metrics engine. No sampling. Within minutes, you can filter and group by Sentiment, Churn Risk, Customer Effort when supported, Canonical Tags, and Drivers.

Verify counts and timelines, then review the analytics interface columns for Sentiment, Churn Risk, Canonical Tags, and Drivers. Full-population processing means no blind spots, and you can pivot by cohort, driver, and time window with confidence.
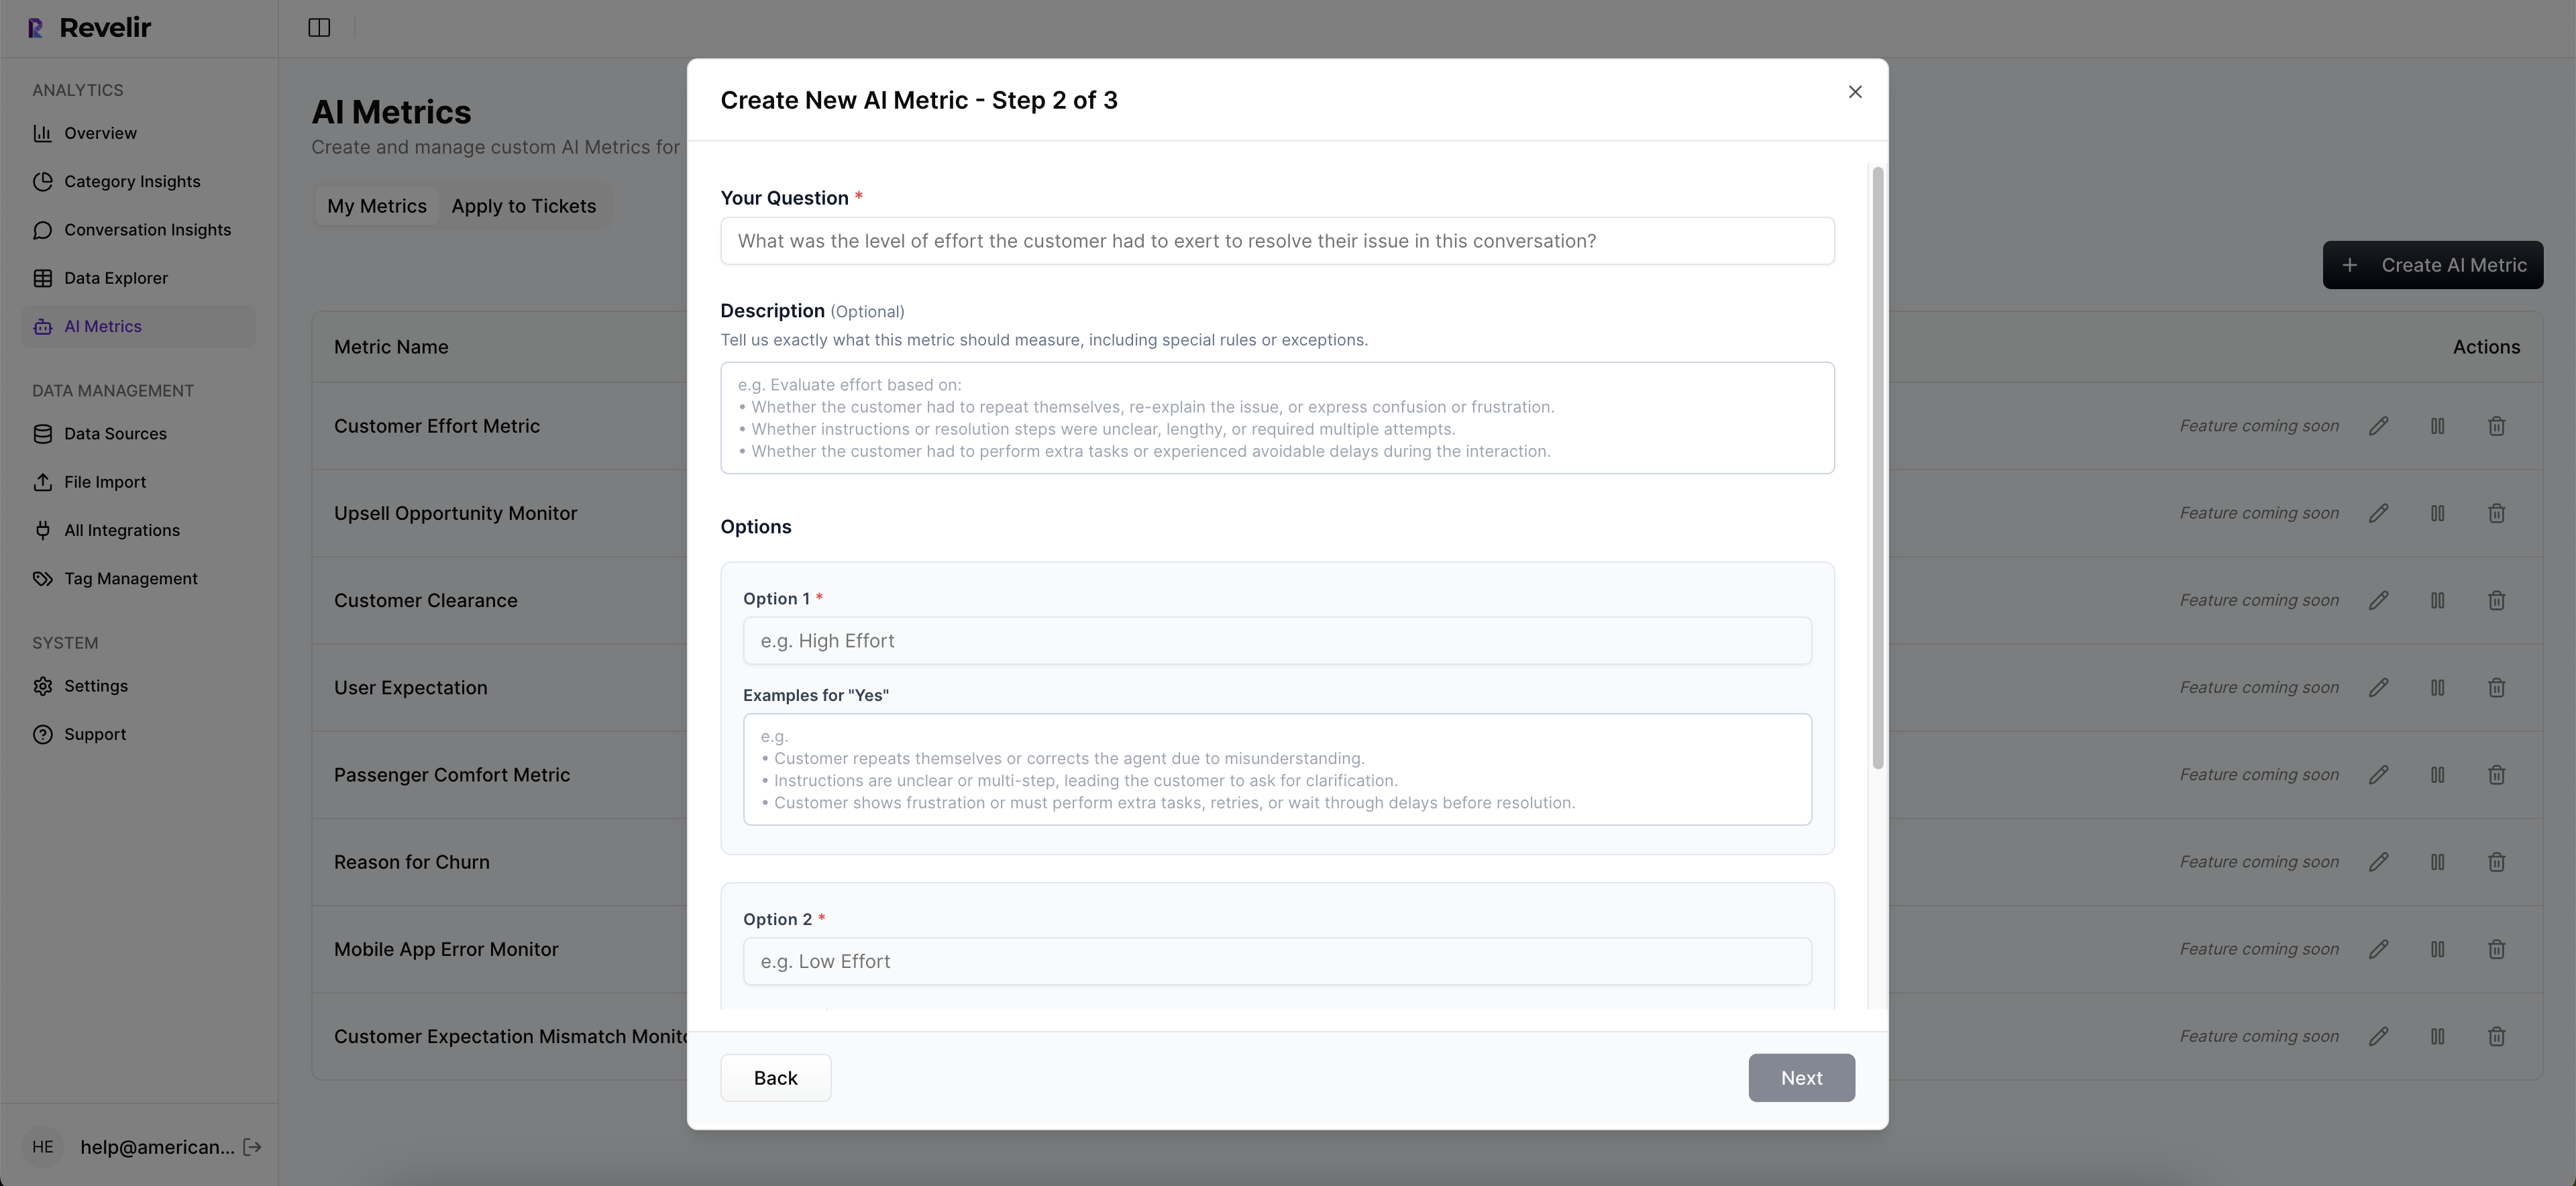
Configure taxonomy, drivers, and custom metrics in the platform
Use the hybrid tagging workflow. Let AI-generated raw tags surface granular patterns, then map them into canonical tags aligned to your leadership language. Group those canonical tags under drivers like Billing, Onboarding, and Performance. Enable core AI Metrics and add business-specific metrics when needed, such as a Reason for Churn field. Over time, refine mappings as you validate patterns in the conversation review tool.
Revelir AI remembers your mappings, which makes future imports cleaner and your reports more stable. That stability builds trust across CX, Product, and Finance.
Validate, analyze, and measure impact in Data Explorer
Run Analyze Data to group Churn Risk, Sentiment, or Effort by Driver or Canonical Tag. The results are interactive, so you can click a count like “19 churn-risk tickets” to jump directly into the conversation review tool for transcripts, AI summaries, and quotes. Save views for recurring reviews, compare pre and post changes, and share insights with stakeholders. If you need to bring metrics into external reporting, you can export structured data, a pattern described in industry evaluations and reflected in Revelir’s approach to downstream analytics.

Remember that 25-hour escalation tax we quantified earlier? Revelir AI helps you isolate the driver cluster behind it, validate with three quotes in two clicks, and track whether the fix reduces escalations next month. That closes the loop.
Instead of manual tracking, see how Revelir streamlines the full workflow from signal detection to validation. See how Revelir AI works.
Ready to move from sample-biased reports to a traceable pipeline on your data? Get started with Revelir AI (Webflow).
Conclusion
Your queue already tells you who is at risk. The hard part is turning those conversations into structured signals that people trust. When you define seven signals, score them transparently, roll them up by driver, and attach quotes to every alert, you stop arguing about samples and start reducing churn.
The path is not more dashboards or more surveys. It is 100% coverage, clear taxonomy, and verifiable evidence you can open in a meeting. Do that and your team moves faster from “what happened” to “what we fix next,” with fewer escalations, less rework, and calmer renewals.
Frequently Asked Questions
How do I identify churn signals in conversations?
To spot churn signals in conversations, start by tracking key behaviors like frustration cues and payment issues. Look for repetitive questions or complaints that indicate confusion or dissatisfaction. You can use Revelir AI to analyze all support tickets, ensuring you capture 100% of the data. This way, you can link specific alerts to actual quotes, helping your customer success team act quickly and effectively on the insights gathered.
What if my team misses early churn signals?
If your team misses early churn signals, it's important to review how you're analyzing conversations. Consider implementing a taxonomy that categorizes different levels of frustration or risk. You can use Revelir AI to build this system, so it becomes easier to prioritize alerts. By collecting evidence from past conversations, you can create a clearer picture of risk, enabling your team to address potential issues proactively before they escalate.
Can I analyze conversations for churn risk automatically?
Yes, you can analyze conversations automatically using tools like Revelir AI. Set it up to scan all support tickets for specific signals that indicate churn risk, such as repeated issues or billing problems. Revelir AI helps you track these patterns and generates alerts when it detects potential churn. This automation allows you to focus on high-risk accounts without manually going through each conversation, making your process more efficient.
When should I escalate a churn risk alert?
You should escalate a churn risk alert when you notice consistent patterns of frustration or unresolved issues over time. If a customer repeatedly reaches out regarding the same problem or shows dissatisfaction in multiple interactions, it's a sign that you need to act. Using Revelir AI, you can quantify the impact of these issues and prioritize them based on severity. Escalating alerts promptly can lead to quicker resolutions and improve customer retention.
Why does tracking conversation signals matter?
Tracking conversation signals is crucial because it provides tangible evidence of customer satisfaction and potential churn. By monitoring these indicators, you can identify problems early and take action before they escalate. Revelir AI makes it easier to analyze all conversations, offering insights that help your team make informed decisions. This proactive approach not only improves customer experiences but also boosts overall retention rates.