

Most teams sample a few tickets, watch CSAT/NPS, and feel informed. It’s usually enough to get through a staff meeting, but it won’t survive a tough question from a CFO or a PM who wants proof. If the signal you trust isn’t tied to the exact conversations it came from, the room stalls. Every time.
Here’s the shift. You move from “we think” to “we can show.” That means 100 percent coverage of support conversations, drivers that explain the “why,” and traceable quotes that back every metric. When the data is complete and auditable, you stop negotiating anecdotes and start prioritizing fixes you can defend.
Key Takeaways:
- Sampling and score-watching create false confidence; 100 percent coverage with traceable evidence creates trust
- Drivers, not scores, reveal what to fix and for whom
- The “time math” on manual reviews never scales. Automate analysis and preserve audit trails
- Grouped analysis plus quote-level drill-downs turn arguments into decisions in minutes
- A simple, repeatable pipeline beats ad-hoc reviews when stakes are high
- Revelir gives you full coverage, drivers, and click-through evidence out of the box
Why Sampling Breaks Evidence-Based Decisions
Sampling breaks evidence-based decisions because it hides the very signals you need, frustration cues, churn mentions, unsolicited feedback, in the 90 percent you didn’t read. Scores help you trend, but they don’t say what to fix. Full-coverage analysis with traceable quotes closes that gap fast.
The hidden bias inside small samples
Sampling sounds responsible. It’s convenient, and nobody’s checking how many important signals you left out. But small samples over-index on what’s loud or recent, not what’s representative. When urgent churn signals hide in “quiet” cohorts, new users, smaller plans, a new region, your 10 percent sample just misses them.
The real risk isn’t a bad decision, it's a confident one made on partial evidence. You optimize an onboarding flow because three tickets were inflammatory, then miss a growing bug with enterprise accounts. The fix is straightforward in concept: stop guessing. Move to 100 percent coverage so you can pivot across cohorts and time windows without arguing about whether the data is “real.”
What happens when scores replace drivers
Scores track trajectory, not diagnosis. A CSAT dip tells you something’s off; it won’t tell you if it’s refunds, login loops, or a brittle workflow in onboarding. Same thing with basic sentiment labels. Useful, but shallow. You get direction without a plan.
Drivers turn a score into action. When negative sentiment is tied to “Billing & Payments” and further to “fee confusion,” you know where to intervene and who to involve. Add traceable quotes, and the conversation changes from “maybe” to “here it is.” If you want a sanity check on designing measurable signals, skim the practical guidance in the AI Playbook.
The Root Cause: Incomplete Coverage And Untraceable Metrics
The root cause is unstructured support text that never becomes complete, trustworthy metrics you can query and defend. Without full coverage and traceability, teams lean on samples, shallow scores, and stitched anecdotes, then wonder why decisions stall.

What traditional reviews miss
Reading a handful of tickets catches nuance. It also misses volume, trend shape, and early signals that only show up in aggregate. Traditional tagging is messy, inconsistent, and hard to maintain. Sentiment-only labels say something is wrong, but not where to intervene or how severe it is for high-value segments.
What you’re really fighting is ambiguity. Without a consistent tagging layer and AI metrics applied to every conversation, your analysis stays bespoke and brittle. That brittleness slows decisions, because any objection, “show me examples,” “what about enterprise accounts?”, forces a context-switch back into raw transcripts you haven’t structured.
Why traceability determines trust
Executives ask for proof. If you can’t click from a chart to the exact tickets and quotes behind it, credibility evaporates. Transparent traceability fixes this. Every aggregate should be drillable to transcripts, summaries, tags, and AI metrics. It’s not just a data practice; it’s how you keep the room aligned.
Here’s the working habit we coach teams to adopt. No chart without a path to evidence. Practically, that means: start at the aggregate view, run grouped analysis by driver or category, click the count, review three to five representative tickets, and pull quotes. Speed comes from the workflow, not from skipping validation. If you need a framing for stakeholder storytelling, the Customer Playbook has useful patterns.
The Real Cost Of Sampling And Score Watching
Sampling and score watching burn time, misdirect teams, and create a trust gap that shows up in escalations and rework. The costs stack, time, money, morale, and they’re predictable.
The time math you cannot escape
Let’s pretend you handle 1,000 tickets a month. A ten percent sample at three minutes per ticket is five hours for a partial view. Reviewing 100 percent manually would take 50 hours. Neither path scales, and both delay detection of churn risk. Meanwhile, the queue keeps moving. So does customer sentiment.
The math doesn’t care about intent. You’ll either miss weak signals or spend your week reading. Automation isn’t about replacing humans; it’s about giving them structured, complete data to investigate. Then your five hours go to decisions and follow-through, not scavenger hunts.
The compounding cost of chasing the wrong fix
Score dips without drivers send teams to generic remediation. More help articles. Broader agent scripts. A “please bear with us” email. You know the drill. Each week spent on the wrong fix consumes engineering cycles, keeps ticket volume high, and tests customer patience. That compounds.
Tie sentiment to drivers, add effort and churn risk, and prioritization becomes obvious. You target “fee confusion” in Billing & Payments for enterprise customers first because volume × severity is highest. Clarity shortens the path from pain to the real fix. Faster cycle. Less rework.
When partial views fuel escalations
Partial views amplify the loudest anecdote. One gnarly ticket drives a leadership panic, agents spin on rework, and product refuses to commit because evidence is thin. Everyone is right from their angle, and the system gets noisier.
Grounding decisions in 100 percent of conversations, grouped by drivers and severity, lowers the noise floor. You still act fast when something spikes, but you act with context. Escalations go down because the narrative is backed by a complete, defensible dataset.
Still wrestling with manual reviews and stitched spreadsheets? There’s a simpler path. If you want to see what full coverage plus traceability looks like in practice, See how Revelir AI works.
What It Feels Like To Defend Anecdotes In The Room
Defending anecdotes is exhausting. The questions are fair, “how big, who’s affected, do we have examples?”, but without traceable metrics you’re back to guessing. It’s not a good feeling.
The 3 am incident no one saw coming
A late-night spike hits. You pull three tickets. They look scary. The next morning, the question is scale, how many, which drivers, which customers, and you can’t answer with confidence. We’ve all been there.
With full coverage, your workflow is simple: filter by timestamp, run grouped analysis by driver, click the counts, and review examples. The story moves from fear to facts fast: “27 tickets in the last two hours, 80 percent tied to ‘Account Access’, two quotes attached.” The room exhales. Next steps are obvious.
When your biggest customer asks for proof
Enterprise account on the line. Their ops lead wants receipts. If you bring a summary without the transcript path, the call gets tense fast. If you bring counts and quotes tied to their tickets, the tone changes. You regain control of the narrative.
We use a simple drill when a tough question lands: start with the aggregate, show the top drivers, click into the highest severity cluster, read one or two transcripts, then summarize with a number-plus-quote sentence. People lean in. Decisions move forward. If you want mindset cues for handling pressure, this short talk on communicating technical evidence is worth a watch.
A Production-Ready 6-Step Pipeline For Evidence-Backed Feedback Analysis
A production-ready pipeline turns unstructured conversations into structured metrics, validates insight with quotes, and drives a repeatable prioritization cadence. Keep it lightweight, but consistent.
Ingest and verify 100 percent coverage
Connect a CSV export or Zendesk. Confirm ticket counts, date ranges, and that conversation text is present. Then sanity-check: compare imported totals to your helpdesk for the chosen period, scan a sentiment overview, and confirm new tickets update automatically. Fix gaps now, otherwise every downstream analysis inherits blind spots.
Two rules help here. First, verify the population before you trust any slice. Second, don’t move on until you can answer “how many tickets are we missing?” with “none.” It’s tempting to skip this step under time pressure. Don’t. Coverage is the foundation.
Define a minimal taxonomy and enable core AI metrics
Start small. Create or refine canonical tags leadership recognizes, Billing & Payments, Onboarding, Performance, Account Access. Keep raw tags for discovery, but group them into a clear taxonomy that reflects your language. Then enable AI metrics: Sentiment, Churn Risk, Customer Effort, plus one or two custom metrics tied to your business.
Clarity beats completeness in week one. You can always add categories later. What matters is that every conversation rolls up into stable buckets, and every bucket can be filtered and grouped alongside severity metrics. That’s how you get from “we think” to “here’s what to fix.”
Analyze, validate, prioritize, and operationalize
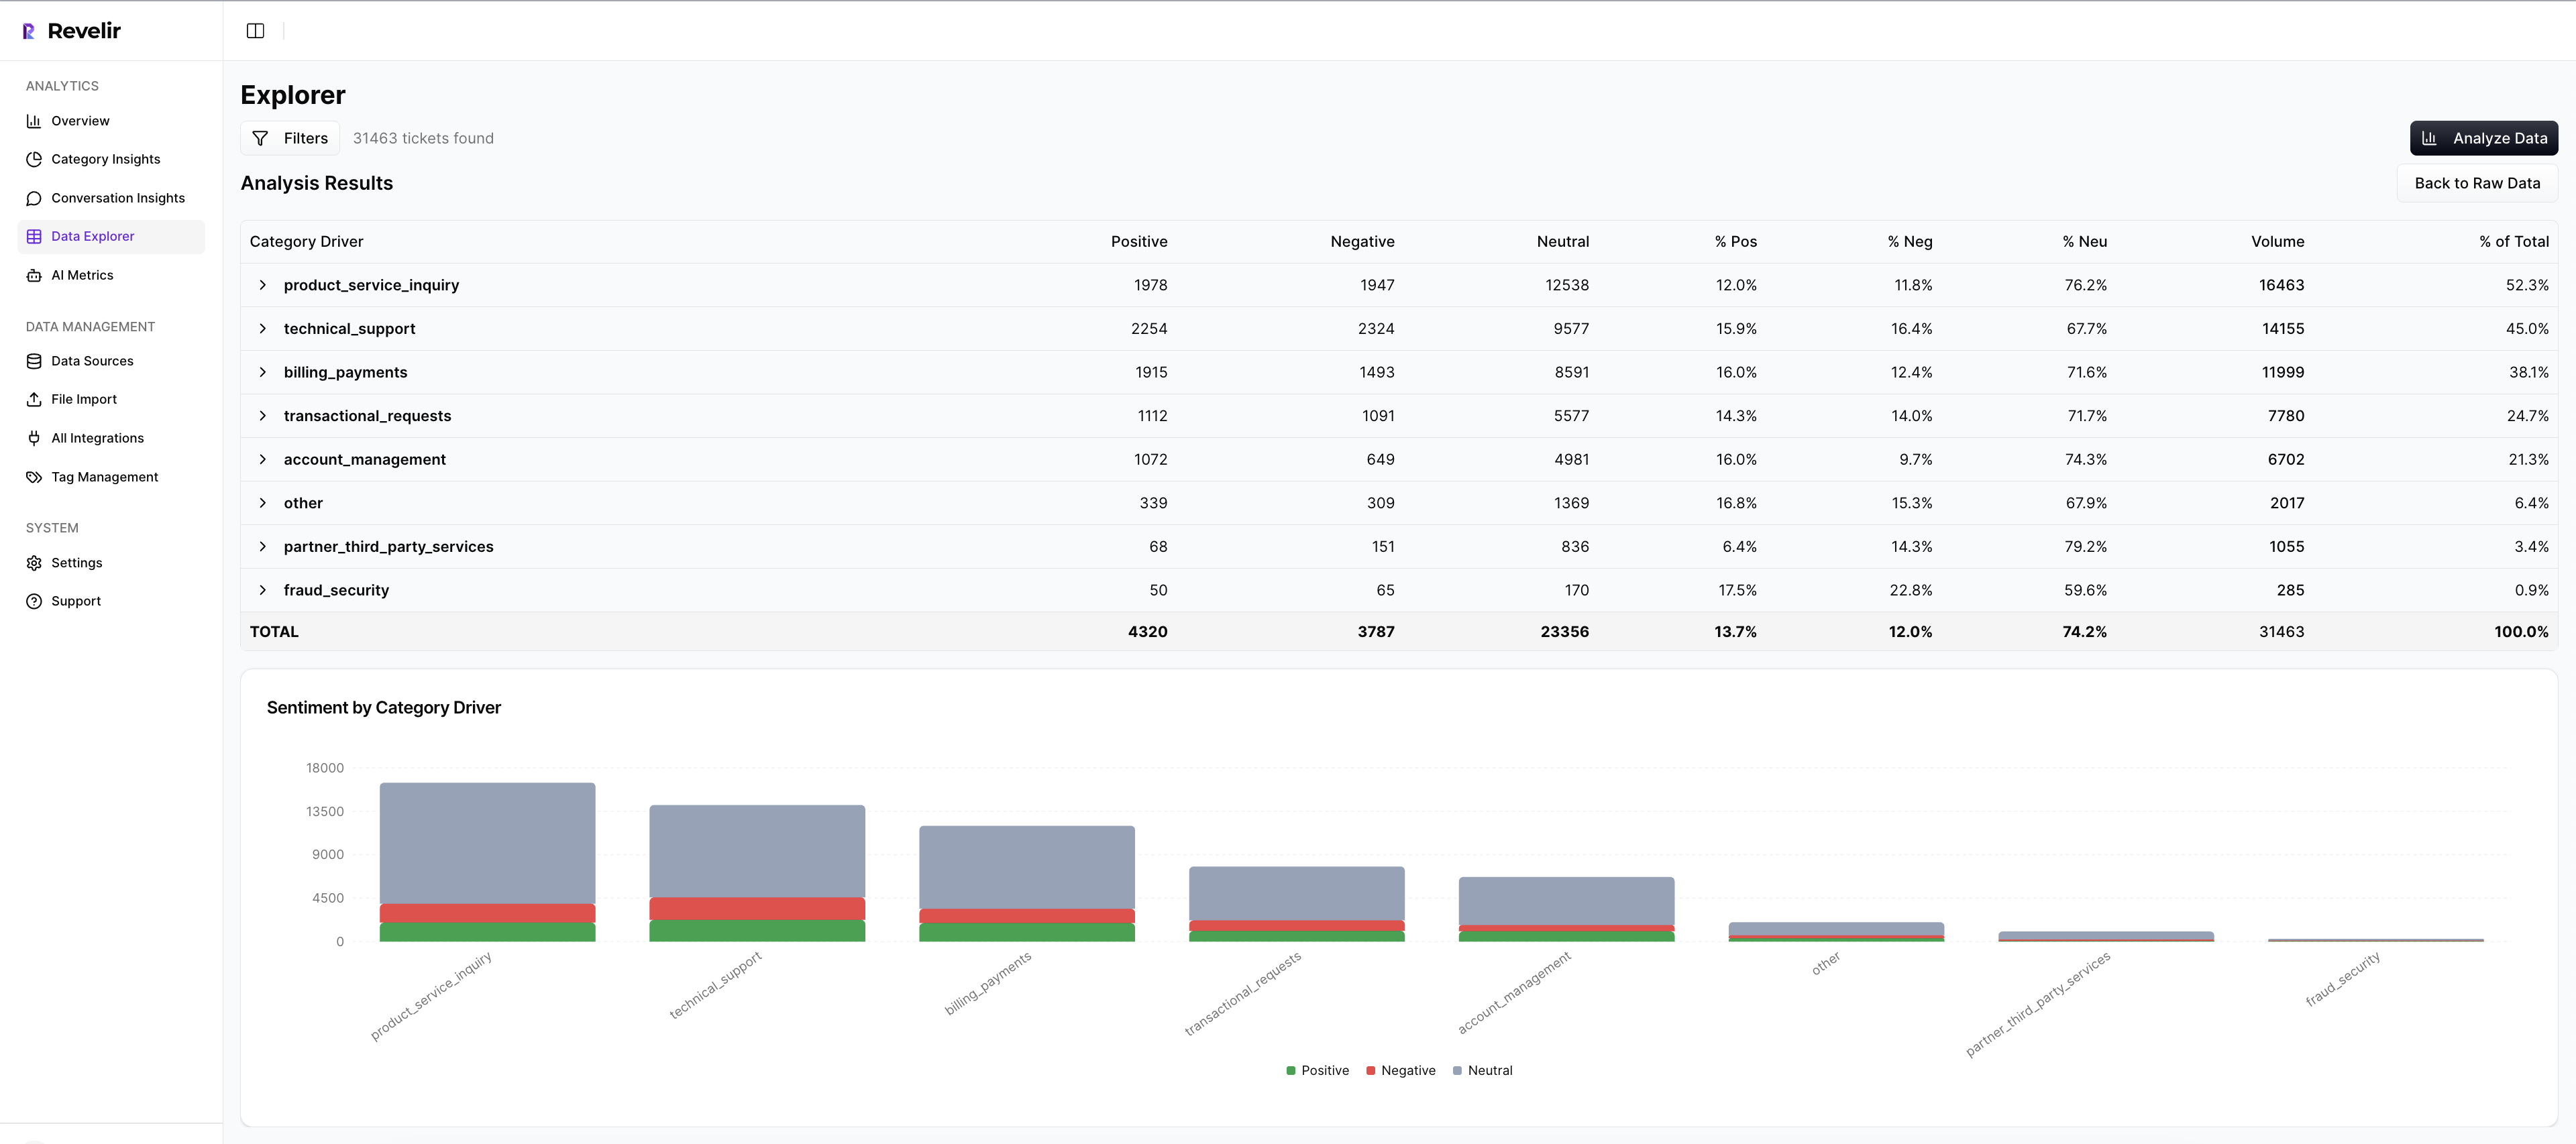
Open your analysis workspace. Apply filters like “last 30 days,” optionally “Plan = Enterprise,” and sentiment/churn-risk slices. Click into grouped analysis and choose a metric (Sentiment, Churn Risk, Effort) with a group-by dimension (Driver or Canonical Tag). Isolate high-volume or high-severity clusters that are worth attention.
Now validate the pattern with conversation drill-downs. Click any count to see the tickets, read a handful, and capture three to five quotes per priority segment. Build a quick matrix, volume on one axis, severity on the other, and mark the top-right clusters to address first. Finally, save the views you used so your month-over-month review is consistent. Repeat the same workflow, not the same debate.
Ready to skip theory and see a full pipeline in action with your tickets? Learn More.
How Revelir AI Automates Evidence-Backed Feedback Analysis
Revelir AI automates full-coverage processing, applies a hybrid tagging and driver model, and computes AI metrics you can filter, group, and validate, then ties every insight to the exact conversations behind it. You get speed, coverage, and credibility in one place.
Full coverage processing with traceable drill downs
Revelir processes 100 percent of your uploaded or ingested tickets, no sampling, so the dataset is complete. Every aggregate is clickable to Conversation Insights, where you see the transcript, AI summary, tags, and AI metrics. That means when someone asks “show me,” you’re two clicks from the evidence.
This solves two earlier costs at once: the time math of manual reviews and the trust erosion from black-box numbers. Instead of five hours reading a sliver, you spend minutes moving from grouped views to specific quotes. The outcome: faster answers, fewer escalations, and less rework.
Hybrid tagging and driver model for leadership clarity
Revelir uses raw tags for discovery and canonical tags plus drivers for clarity. Raw tags surface granular themes (“billing_fee_confusion”), while canonical tags roll them up into leadership-ready categories (“Billing & Payments”). Drivers give you a strategic lens across categories, Billing, Onboarding, Performance, so you can communicate at the right altitude.

The benefit is practical. You can pivot from a driver-level spike to the exact issues and transcripts without rebuilding a spreadsheet. Teams stay aligned because the language is consistent, and the evidence is always attached. Less arguing, more fixing.
AI metrics you can filter, group, and validate
Out of the box, Revelir computes Sentiment, Churn Risk, and Customer Effort, and supports custom AI metrics in your business language. In Data Explorer and Analyze Data, you filter and group on these fields to reveal patterns in seconds. Then you click into tickets to verify that the classifications “make sense.”

Setup is fast: start with a CSV export or connect Zendesk to ingest historical and ongoing tickets. Verify counts and timelines, enable core metrics, and refine your taxonomy over time. The payoff is immediate, structured, defendable insights that map directly to the rational costs you’re carrying today: wasted review hours, generic fixes, and meeting fatigue.
If you want the shortest path from unstructured conversations to evidence-backed decisions, let Revelir do the heavy lifting. Learn More
Conclusion
You can keep sampling and watching scores, or you can raise the bar: full coverage, drivers that explain the “why,” and quotes that prove every claim. That’s how you move from meetings to momentum. When every chart links to conversations, you stop defending anecdotes and start making decisions you can stand behind.
Frequently Asked Questions
How do I set up Revelir AI with my helpdesk?
To set up Revelir AI with your helpdesk, start by connecting your data source. You can either integrate with a platform like Zendesk or upload a CSV file of your recent tickets. Once connected, verify the basic fields and timelines to ensure everything is accurate. After that, you can set up canonical tags to organize your data meaningfully. Finally, enable core AI Metrics like Sentiment and Churn Risk to start analyzing your conversations effectively. This setup typically takes just a few steps and can provide insights in minutes.
What if I want to analyze churn risk across different customer segments?
To analyze churn risk across customer segments using Revelir AI, first, filter your dataset by the specific segment you want to examine, such as 'Enterprise' or 'Frequent Customers.' Then, use the Analyze Data feature to select 'Churn Risk' as the metric and group by 'Canonical Tag' or 'Driver.' This will help you identify which segments are experiencing the highest churn risk and allow you to drill down into specific tickets for more context. This approach ensures you're targeting your analysis effectively.
Can I customize AI metrics in Revelir AI?
Yes, you can customize AI metrics in Revelir AI to fit your business needs. After setting up your account, navigate to the metrics configuration section where you can define custom AI Metrics that reflect your specific terminology and requirements, such as 'Upsell Opportunity' or 'Reason for Churn.' This allows you to tailor the insights generated by Revelir to align with your organizational goals, ensuring that the data is relevant and actionable for your team.
When should I validate AI outputs with Conversation Insights?
It's a good practice to validate AI outputs with Conversation Insights whenever you notice discrepancies or unusual patterns in your data. For example, if the sentiment analysis shows a spike in negative feedback, you can click into Conversation Insights to review the specific tickets that contributed to this trend. This validation step helps ensure that the AI's tagging and metrics align with the actual customer conversations, allowing you to make informed decisions based on reliable evidence.
Why does Revelir AI emphasize full coverage of support conversations?
Revelir AI emphasizes full coverage of support conversations because sampling can lead to missed signals and biases in the data. By analyzing 100% of your tickets, Revelir ensures that you capture all relevant feedback, including subtle cues like frustration signals and churn mentions. This comprehensive approach allows you to make data-driven decisions backed by complete evidence, rather than relying on partial views that can misrepresent customer sentiment and needs.