

When you’re comparing Revelir AI vs Thematic, you’re usually not debating “which UI is nicer.” You’re debating trust, speed, and whether the insight survives the meeting where someone asks, “Cool, show me the receipts.” Thematic is built for broad Voice of the Customer programs across channels, while Revelir AI is built to measure support conversations with evidence you can trace back to real tickets.
What Teams Should Know When Comparing Revelir AI and Thematic
Revelir AI and Thematic can both analyze customer language at scale, but they’re optimized for different jobs. Thematic is typically used for enterprise VoC and research-grade thematic analysis across surveys, reviews, and other feedback sources (Thematic Text Analytics). Revelir AI is more helpdesk-first, focusing on evidence-backed metrics from support conversations, with drill-down to the exact ticket context.

| Feature | Thematic | Revelir AI |
|---|---|---|
| Primary Use Case | Enterprise VoC + research-grade thematic analysis (Thematic Analysis) | Support conversation analytics with evidence-backed metrics (first-party) |
| Data Coverage Approach | Broad ingestion across feedback sources (surveys, reviews, etc.) (Qualitative Data Analysis) | 100% of ingested support conversations (no sampling) (first-party) |
| Evidence / Traceability | Drill-down to verbatims within themes (Text Analytics Best Practices) | Every metric and chart ties back to the ticket and quote (first-party) |
| Setup Style | Typically more taxonomy and stakeholder alignment work up front (Thematic Analysis) | Fast start via Zendesk connection or CSV upload (first-party) |
| Pricing Approach | Quote-based, contact sales is standard for enterprise tools (Thematic on G2) | 7-day free trial; pricing not publicly listed (first-party) |
Key Takeaways:
- Thematic fits enterprise VoC teams unifying surveys, reviews, and support, while Revelir AI fits support teams needing ticket-level proof fast.
- If “show me the quote” is a constant meeting interruption, prioritize traceability from metrics to verbatims in both tools’ workflows.
- Sampling and survey-only programs tend to miss churn mentions and frustration cues that live inside tickets, not dashboards (Thematic Text Analytics).
- Revelir AI leans into 100% conversation coverage plus metrics like sentiment, churn risk, and effort as filterable columns, not just themes.
Market Context: VoC Platforms Vs Support-First Analytics
VoC platforms and support-first analytics tools solve overlapping problems, but they start from different data realities. VoC teams are often consolidating surveys, reviews, and multi-channel feedback into executive reporting, and Thematic speaks directly to that work (Qualitative Data Analysis). Support-first analytics starts in the helpdesk, where volume is high, context is messy, and you need answers that survive cross-functional scrutiny.
It’s usually the same story. A CX leader wants one source of truth. A support leader wants to know why volume spiked this week, which issues create high effort, and which accounts are quietly churning. Those are related questions, but the tooling priorities aren’t identical.
Where this gets people in trouble is buying “broad” when they actually need “deep.” Or buying “deep helpdesk workflow” when the real mandate is VoC across the whole customer lifecycle. The right choice depends on where your pain is coming from.
Things worth clarifying internally before you choose:
- Are you reporting on “customer feedback” broadly, or diagnosing support friction specifically?
- Do you need heavy taxonomy governance and research workflows, or do you need speed and audit-ready evidence?
- Will insights be used mainly by an insights function, or by support and product triage teams day to day?
Where Sampling And Survey-Only Fall Short
Sampling and survey-only programs miss a lot of what actually drives customer behavior, especially in support. Surveys can tell you sentiment moved, but they don’t reliably tell you why, and they tend to miss unsolicited product feedback buried in tickets (Why Use Open-Enders In Surveys). Sampling has a different failure mode, it’s faster, but you don’t know what you didn’t read.
Let’s pretend you handle 1,000 tickets a month. If you sample 10%, you might feel productive, five hours of review and you’ve got “themes.” Nobody’s checking whether that 10% included the weird billing edge case that is setting off churn mentions in enterprise accounts. Then you walk into a product meeting with a tidy chart and somebody asks, “How confident are we this is real?” Headache.
Support data is where customers complain in detail. It’s also where they mention competitors, churn intent, and the exact workflow they couldn’t complete. Those signals can disappear if your process is score-watching plus a few anecdotal reads.
What To Evaluate: Coverage, Traceability, Actionability
The best comparison framework is simple: coverage, traceability, and actionability. Coverage is whether you’re measuring 100% of the conversations you ingest, or whether the workflow encourages sampling and partial visibility. Traceability is whether the charts link back to exact verbatims and ticket context, so stakeholders trust it. Actionability is whether the tool helps you answer “what do we do next,” not just “what are the themes.”
Same thing with “actionability.” A theme called “onboarding” isn’t that helpful on its own. You want to break it down, segment it (new customers vs enterprise), and pull quotes that show the actual friction. That’s what moves work forward.
A practical evaluation checklist:
- Can you pivot by sentiment, customer segment, and issue category without exporting to spreadsheets?
- When you find a spike, can you click through to the exact conversations and validate the pattern quickly?
- Does the tool help you roll up granular issues into leadership-friendly drivers without weeks of taxonomy work?
The Hidden Time Tax of Support Analytics (and How to Avoid It)
The hidden time tax comes from turning unstructured tickets into something leaders will act on, because manual tagging, sampling, and spreadsheet rollups don’t scale. Teams often spend hours producing a “findings deck,” then get stuck when stakeholders ask for proof and the link back to the original conversations is weak. You avoid it by measuring 100% of conversations and keeping every metric tied to traceable evidence.
Most teams don’t call it a “time tax.” They call it “Friday.” The recurring ritual: someone pulls a sample, tags it, makes a slide, and hopes nobody asks too many questions. Then you repeat next week.
The tax shows up in three places.
First, rework. You publish an insight, then someone challenges it, then you scramble to find better examples and rebuild the story. Second, mis-prioritization. If your themes are vague or sampled, you can end up fixing the wrong thing for a quarter. Third, trust. Once trust erodes, every insight becomes a debate instead of a decision.
Let’s pretend you have a billing issue that only hits a specific plan tier. If your sample misses it, you’ll see “billing complaints” as a general theme, and you’ll likely respond with generic comms or extra help docs. Meanwhile, the real fix is a product bug tied to a payment edge case. That’s the costly version of “close enough.”
Ways teams reduce the time tax in practice:
- Stop treating qualitative analysis as a one-off project. Make it a measurable layer that updates as new tickets arrive.
- Design for validation, not just summarization. If you can’t click to the original conversations, you’ll keep losing time in meetings.
- Separate “emerging themes” from “reporting categories.” You need both, but mixing them creates endless taxonomy churn.
Thematic: What It Does Well and Where It Fits
Thematic is a strong fit for enterprise VoC and insights teams that need research-grade thematic analysis across large volumes of feedback. It’s designed for analyzing qualitative data with thematic modeling and best-practice workflows for turning open text into structured themes and trends (Thematic Analysis). In practice, it’s often used when you’re unifying surveys and other feedback streams into executive-ready insight reporting.
Thematic’s worldview is basically: qualitative data is valuable, but only if you can analyze it rigorously and consistently. And that’s fair. If you’re running a mature VoC program, you care a lot about methodological consistency, taxonomy controls, and themes that stay stable over time.
It also has a strong educational footprint. Their content goes deep on how to do thematic analysis and text analytics in a way that doesn’t devolve into random anecdotes (Qualitative Data Analysis). That matters when you’re building internal buy-in for a structured program.
Strengths
Thematic’s strength is research-grade thematic analysis with workflows that support structured, defensible insight generation. It focuses on turning qualitative feedback into themes, tracking trends over time, and creating insight outputs that can be shared with leadership (Text Analytics). If you’re unifying multiple feedback sources, that thematic rigor tends to be the point.
Where teams tend to like it is the human-in-the-loop control. You’re not just letting a model invent categories and calling it done. You can shape the taxonomy, refine themes, and build something that aligns with how the org talks about customer problems (Text Analytics Best Practices).
Strengths that come up most often:
- Thematic modeling built for qualitative analysis workflows (Thematic Analysis)
- Guidance on best practices for analyzing open text at scale (Text Analytics Best Practices)
- VoC orientation for combining surveys and other feedback streams into themes (Text Analytics)
Limitations
Thematic’s trade-off is that enterprise VoC scope can mean longer time-to-value, especially if you’re starting from “we have tickets” and you just want support insights next week. Taxonomy design and stakeholder alignment can be a real project, and not every org has the patience for that (Text Analytics Best Practices). Some teams love the rigor. Others just want answers without the ceremony.
Pricing is another practical limiter. Third-party review context commonly reflects a sales-led motion and enterprise buying process, which can slow down evaluation cycles (Thematic on G2). That’s not “bad,” it just changes who can realistically buy it and how fast.
And if your ask is helpdesk-first operational workflows, Thematic isn’t positioned as an agent assist or QA tool. It’s built for insights and VoC style analysis, not coaching agents in real time or running support QA programs (Thematic Text Analytics).
Limitations to plan for:
- Sales-led evaluation and quote-based enterprise buying process (Thematic on G2)
- Time investment in taxonomy alignment for consistent reporting (Thematic Analysis)
- Not positioned as a helpdesk agent toolset (agent assist/QA) (Text Analytics)
Pricing And Deployment Considerations
Thematic’s pricing isn’t publicly listed, and the standard path is contacting sales for a quote (Thematic on G2). That usually means the deployment is treated like an enterprise platform rollout, not a “put in a card and run a pilot this afternoon” situation.
Deployment-wise, the main consideration is scope. If you’re ingesting surveys and multiple feedback sources, you’ll need clarity on which datasets matter most, who owns taxonomy decisions, and how you’ll operationalize insights after they’re generated. If you don’t answer those up front, you can end up with a powerful tool and a lot of internal confusion.
Questions worth asking in the buying process:
- Which teams will own theme governance over time?
- How will you validate themes with stakeholders who demand verbatim proof?
- What’s the fastest path to an insight you can act on this quarter?
How Revelir AI is Different: Thematic tends to shine in broad VoC programs, but Revelir AI is built around full-coverage processing of support conversations, then letting you drill from aggregates straight into the exact tickets and quotes. That traceability makes it easier to defend insights in cross-functional meetings, without turning taxonomy work into a multi-week project. It also gives you a Data Explorer workflow where sentiment, churn risk, effort, and custom metrics behave like filterable columns, so you can pivot fast.
Chattermill: Where It Excels and Where It May Not Fit
Chattermill is generally strongest for large CX teams that want omnichannel CX intelligence and executive dashboards. It positions itself around consolidating customer feedback, surfacing trends, and enabling action through platform workflows and updates focused on insights operations (Chattermill Product Updates). In practice, it’s often a fit when you need cross-channel visibility more than helpdesk-specific analysis.
Chattermill’s core bet is that insight is an operating system. You bring in feedback. The platform surfaces what’s changing. Then you route it into workflows that drive action. That’s appealing when you’ve got multiple business units and lots of stakeholders who need consistent reporting.
It’s also a classic enterprise posture. If you’re a smaller team, you might feel like you’re buying a whole control tower when you just wanted a faster way to understand tickets.
Strengths
Chattermill excels at consolidating feedback across channels and presenting it in a way leaders can consume. Their public product updates emphasize observation-style insights and anomaly detection, which is useful when you’re tracking changes over time across large datasets (Chattermill Product Updates). It’s built for broad CX intelligence, not just support.
They also talk publicly about competitive context and performance, which signals the platform is meant for strategic insight work, not only operational support triage (Chattermill Blog). If your mandate includes “tell the org where experience is breaking across the journey,” that kind of framing matters.
Strengths you’d typically care about:
- Omnichannel CX intelligence orientation and platform updates focused on insight workflows (Chattermill Product Updates)
- Trend and change detection concepts (anomaly-style signals) surfaced in product messaging (Chattermill Product Updates)
- Strategic CX framing aimed at enterprise use cases (Chattermill Blog)
Limitations
Chattermill’s limitations usually show up when teams expect a helpdesk-first analytics workspace and instead get a broad CX platform. That’s not a flaw, it’s the trade-off. If your daily workflow lives in Zendesk tickets and you need fast pivots by ticket attributes, the “unified VoC” approach can feel heavier than necessary.
Enterprise setup can also be a real factor. Multi-channel ingestion and stable insight workflows can take time to configure, and some teams experience latency between ingestion, model tuning, and “trustworthy enough to act” insights. Again, not unique to Chattermill, it’s just what happens when you unify a lot of sources.
Chattermill also appears to be sales-led and enterprise-oriented, based on how it presents product updates and use cases rather than self-serve tiers (Chattermill Product Updates). That changes the evaluation process and budget expectations.
Limitations to plan for:
- Broad platform scope may be more than support-only teams need (Chattermill Blog)
- Setup and stabilization time can be non-trivial in enterprise deployments (Chattermill Product Updates)
- Enterprise buying motion, not positioned as self-serve (Chattermill Product Updates)
Pricing And Deployment Considerations
Chattermill’s pricing is typically quote-based and aligned to enterprise deployments, based on its public posture and product update messaging (Chattermill Product Updates). If you’re used to self-serve pricing, this can be a slower cycle with more stakeholder involvement.
Deployment is mainly about defining scope. Which channels matter, which teams get access, how you’ll segment the data, and what “action” looks like after insights are identified. If you don’t define that early, you can end up with dashboards everyone likes and nobody uses to change priorities.
A few practical deployment questions:
- Do we need omnichannel visibility now, or is support the urgent fire?
- Who owns acting on insights, and how do they want evidence presented?
- How quickly do we need to show value to justify the platform cost?
How Revelir AI is Different: Chattermill tends to optimize for broad CX intelligence, while Revelir AI is designed to turn support tickets into structured metrics with 100% coverage and audit-ready drill-down. Instead of starting from “unify every channel,” Revelir AI starts from “measure every support conversation,” then lets you pivot by sentiment, churn risk, effort, and drivers in a Data Explorer workflow. That’s usually faster when your highest-stakes questions are coming straight from the helpdesk.
Why Revelir AI for Evidence-Backed Support Insights
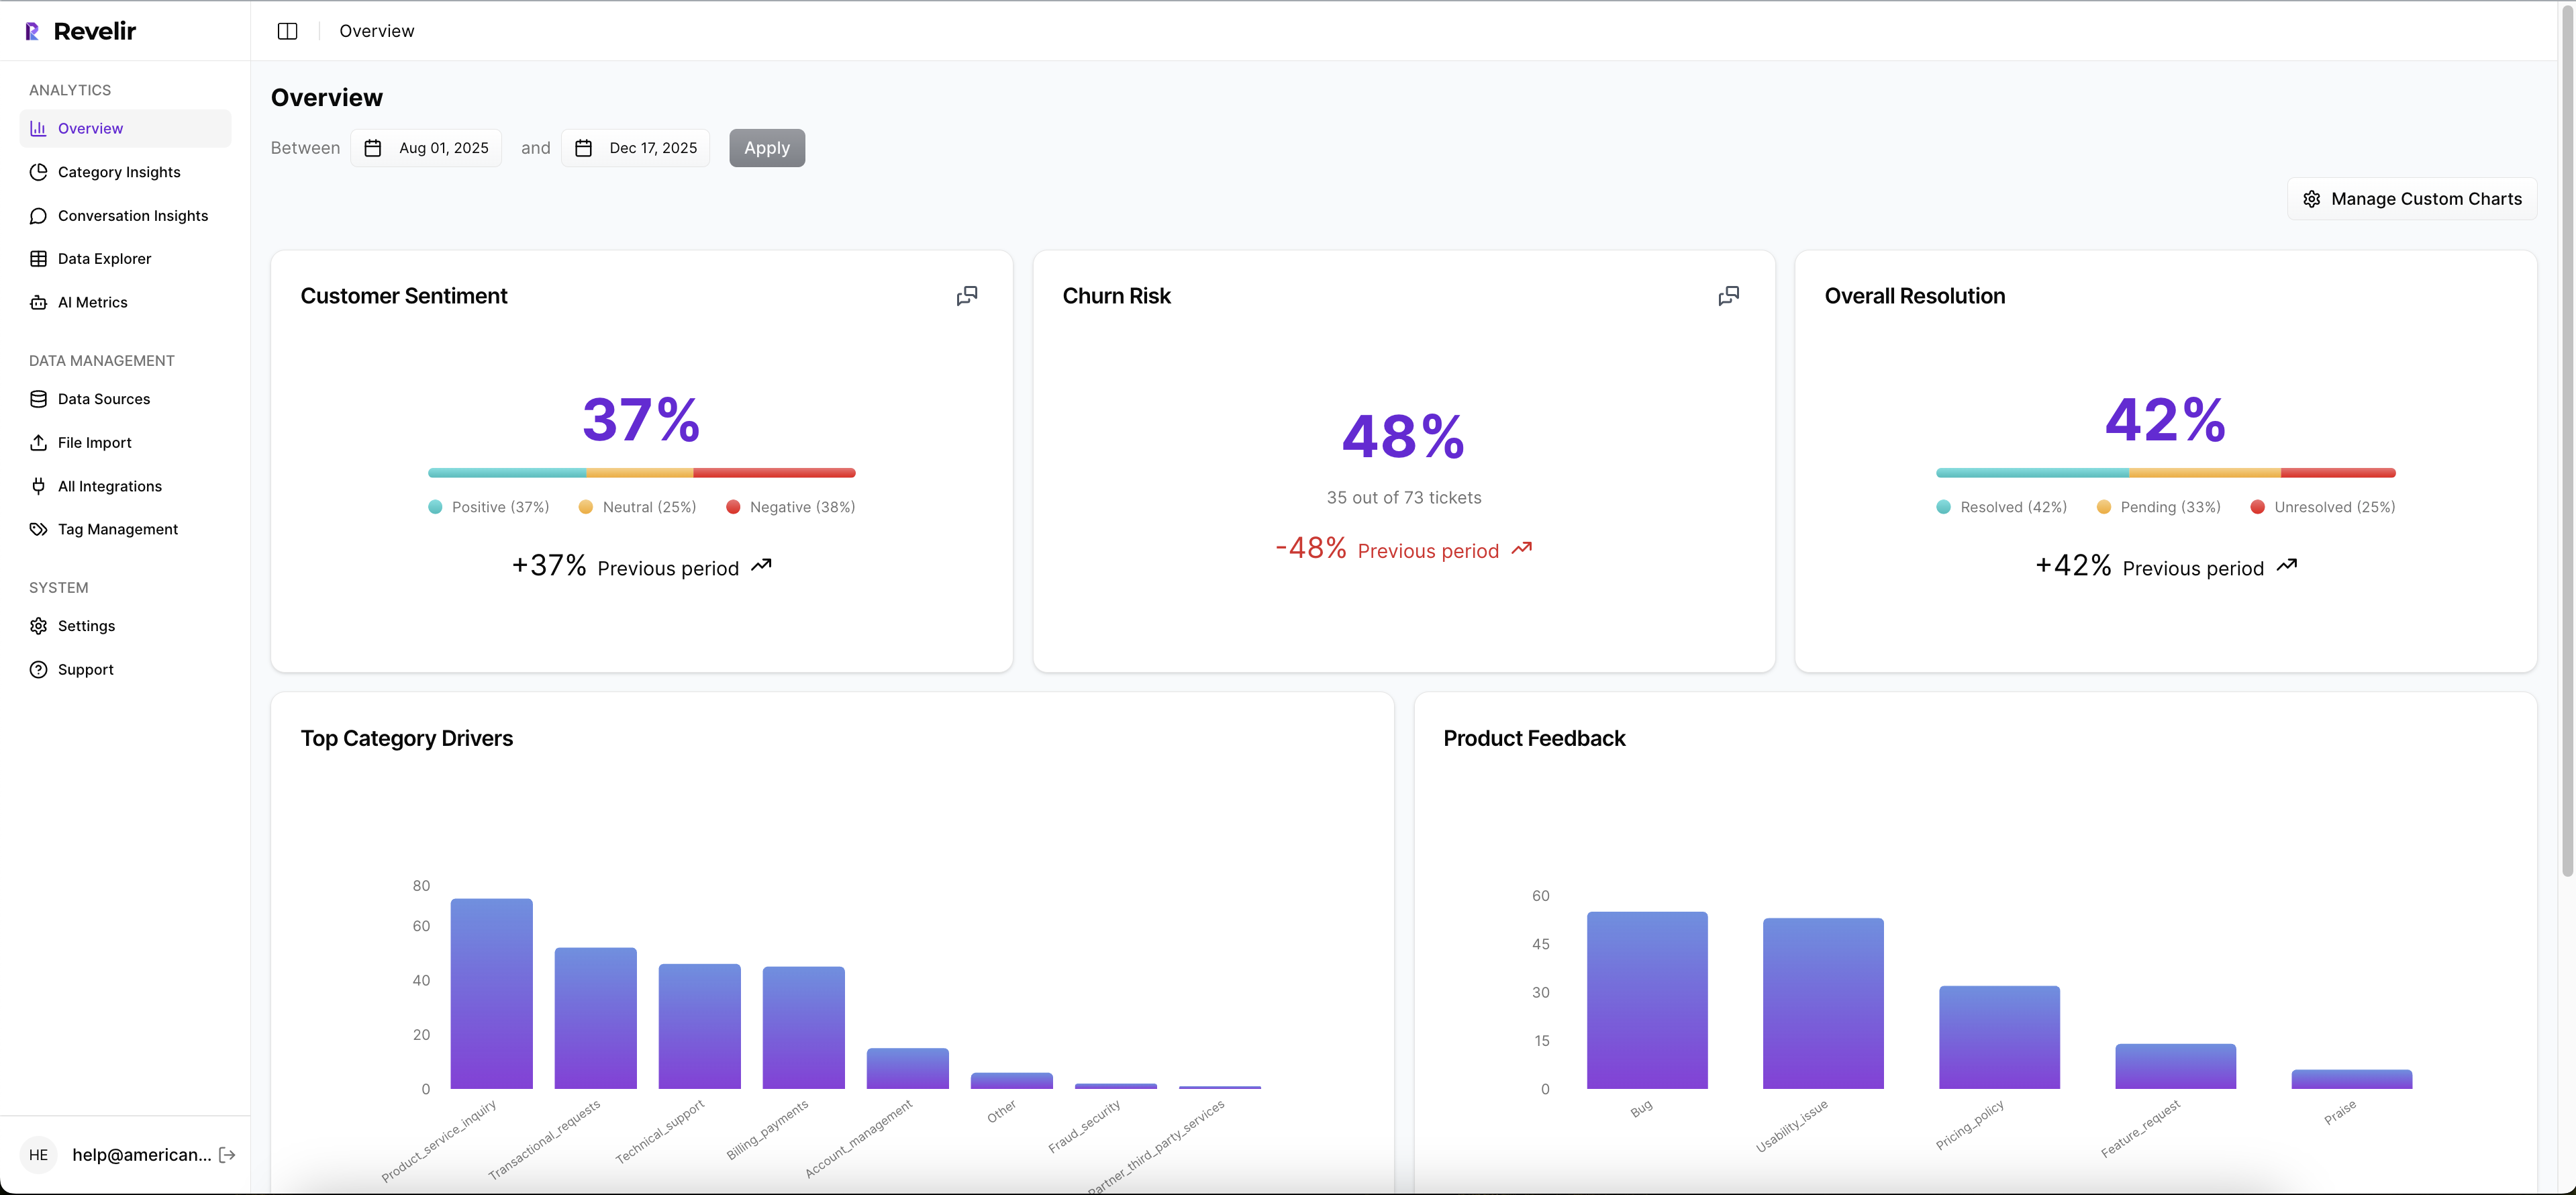
Revelir AI is the better fit when your priority is measuring support conversations with 100% coverage and defensible evidence tied to exact tickets and quotes. It computes structured metrics like Sentiment, Churn Risk, and Customer Effort across all ingested conversations, then lets you validate patterns by clicking into Conversation Insights. For teams tired of sampling debates, that full-coverage plus traceability combo is the point.
Here’s the thing. Most teams don’t actually need “more dashboards.” They need fewer arguments. And arguments usually happen when your metrics can’t be verified quickly.
Revelir AI leans into a workflow that looks like how CX and product leaders actually make decisions. Top-down pattern recognition, then bottom-up validation. You spot a spike in negative sentiment, group by a driver or canonical tag, then click straight into the underlying conversations to see if it’s real.
What Sets Revelir Apart
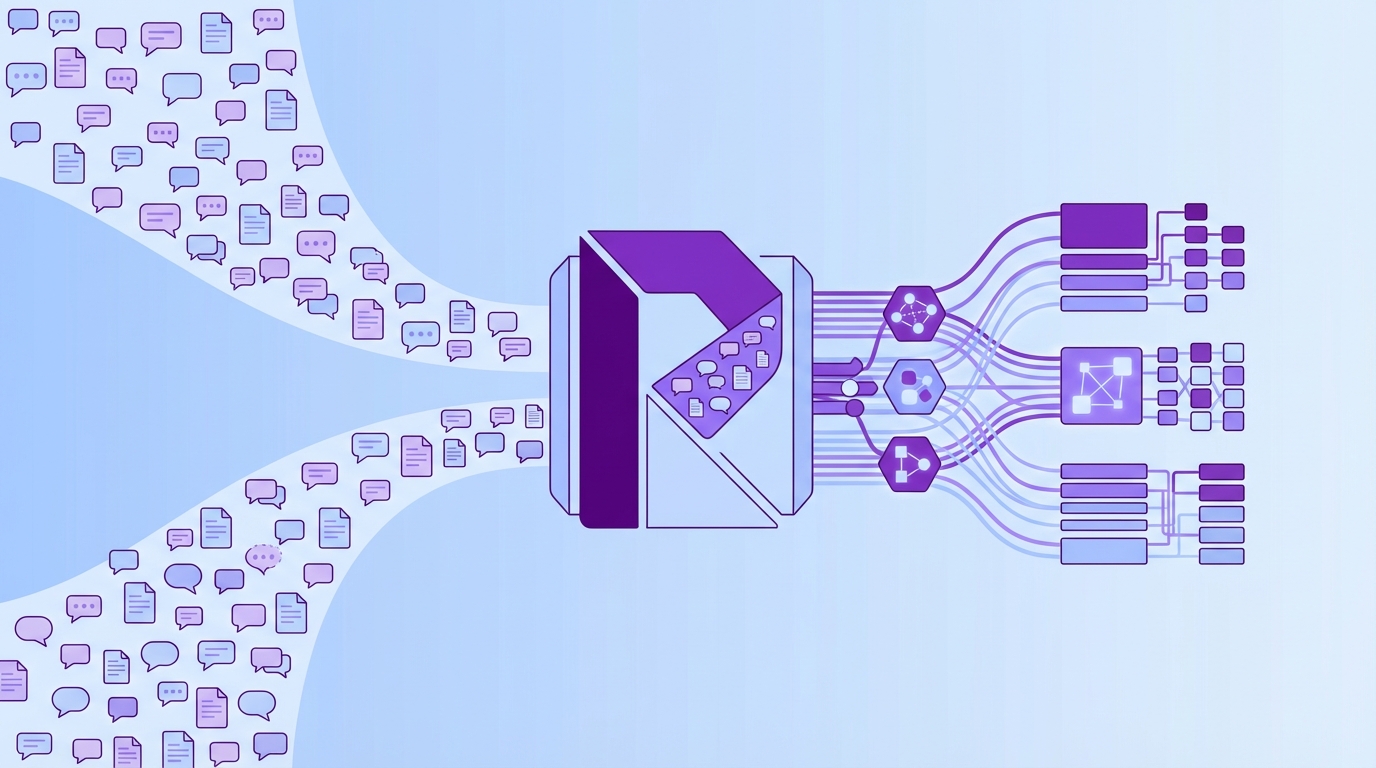
Revelir AI’s differentiation is that it behaves like a measurement layer for support data, not just a theme generator. It processes 100% of conversations you ingest, then stores the outputs as structured, queryable columns you can filter and group by. That means sentiment, churn risk, and effort aren’t just “insights,” they’re dimensions you can analyze like any other dataset.
The part that surprises teams is how much faster alignment gets when evidence is built in. Nobody has to trust a summary doc. They can click into the actual ticket and see the quote that produced the metric. That tends to change the tone of product and finance conversations, because you’re not asking them to believe you.
Core capabilities that show up in day-to-day use:
- Full-coverage processing across ingested conversations (no sampling)
- AI tagging and structured metrics: Sentiment, Churn Risk, frustration signals, product feedback
- Evidence-backed traceability from charts to conversations and quotes
- Data Explorer with Filters plus Analyze Data (group-by analysis with tables and charts)
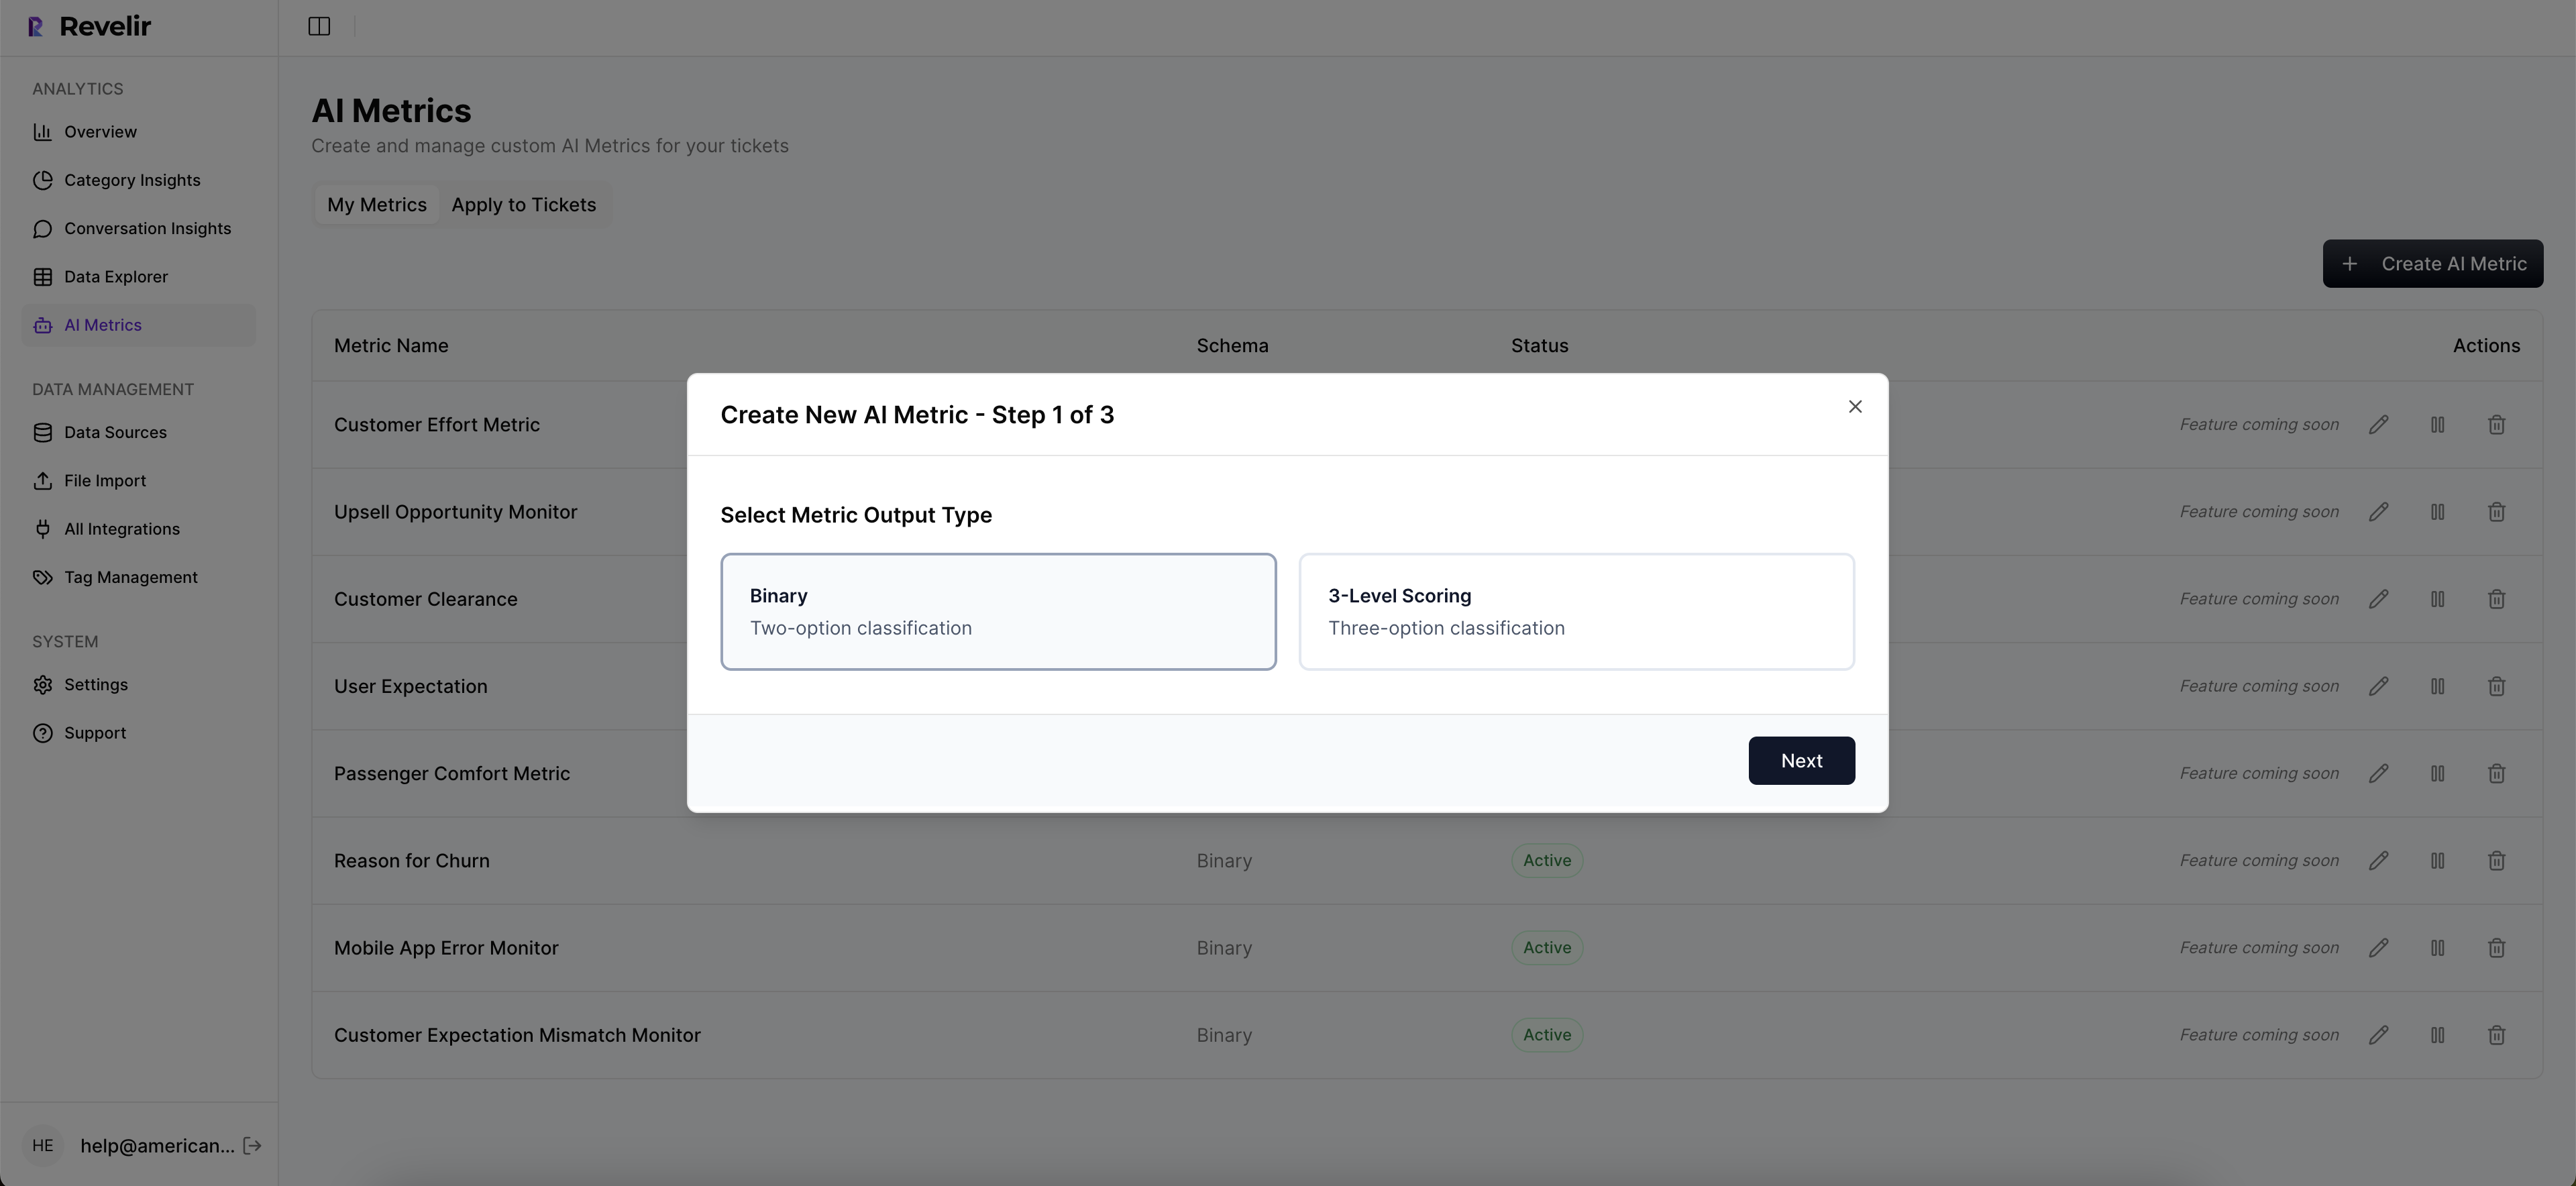
- Custom metrics and taxonomy, so you can define what matters and apply it consistently
- API export, so your reporting layer can pull the structured outputs into BI
And yes, you can sanity check patterns quickly. That’s built into the workflow. You run an analysis, click the row (like “36 tickets”), then review several conversations in Conversation Insights to validate accuracy.
Best-Fit Use Cases
Revelir AI is best when support data is already the richest source of truth you have, and you’re tired of treating it like a qualitative swamp. It fits teams who want to find drivers behind sentiment shifts, detect churn risk signals early, and capture unsolicited product feedback without launching yet another survey.

This is where the “let’s pretend…” test matters. Let’s pretend you’re seeing churn pressure in mid-market accounts. Surveys say “value for money” dipped, but you don’t know what changed. In tickets, you can often find the real reason: billing confusion, feature gating, onboarding friction, or workflow breakage. If you can measure every ticket and group by drivers, you can prioritize fixes with evidence instead of vibes.
Best-fit patterns:
- CX teams that need defensible proof for cross-functional prioritization
- Support leaders who want to quantify effort, sentiment drivers, and churn mentions from tickets
- Product teams who want continuous, unsolicited feedback tied to real customer quotes
Some teams won’t need it. If your primary mandate is omnichannel VoC across surveys, reviews, and social, and support is just one input, you might prefer a broad VoC platform. That’s valid.
Getting Started
Getting started in Revelir AI is usually about getting tickets in fast and validating the first set of patterns, not building a taxonomy committee. You can upload historical tickets via CSV or connect your helpdesk API (Zendesk) and start seeing insights quickly. Then you use Data Explorer and Analyze Data to answer common questions like “what’s driving negative sentiment” and “which issues are hitting enterprise accounts.”
A simple rollout flow that tends to work:
- Ingest a meaningful slice of historical tickets (enough to capture seasonality if you have it)
- Run grouped analysis by driver or canonical tag for negative sentiment
- Click into Conversation Insights to validate examples and build trust internally
- Define any custom metrics you need (like churn reason), so your org’s language becomes filterable columns
- Export via API if you need the metrics in BI
If you’re evaluating options right now, it’s usually worth seeing your own data in the workflow. That’s where the differences become obvious. You can See how Revelir AI works and decide if the evidence-backed approach matches how your team actually operates.
Final Verdict: Which Platform Makes Sense for You?
The right platform depends on whether you’re running a broad VoC program or trying to operationalize support conversations into measurable, provable metrics. Thematic is often a fit for enterprise insights teams doing research-grade thematic analysis across multiple feedback sources (Thematic Analysis). Revelir AI is often a fit when you need 100% ticket coverage, structured metrics, and drill-down evidence to speed up decisions.
If you’re still torn, use a simple decision lens: where does the first hour of value come from?
With a VoC platform, the first hour of value often comes from unifying sources and establishing themes that can be tracked over time. With a support-first measurement layer, the first hour of value is usually “I can finally answer what’s driving negative sentiment, and I can show the exact tickets.”
Comprehensive Capability Grid
Here’s the fuller grid, using the criteria teams actually argue about in buying committees.
| Criteria | Revelir AI | Thematic | Chattermill | Notes |
|---|---|---|---|---|
| Primary focus | Support conversation analytics with audit-ready evidence | Enterprise VoC and research-grade thematic analysis | Omnichannel CX intelligence and dashboards | Different centers of gravity: helpdesk-first vs broad VoC |
| Conversation coverage model | 100% of ingested tickets (no upfront manual tagging) | Broad feedback ingestion; sampling driven by VoC scope (Text Analytics Best Practices) | Broad feedback ingestion; scope set by integrations (Chattermill Product Updates) | Coverage depends on data sources and ingestion setup |
| Evidence traceability to verbatims | Direct link from aggregates to tickets and quotes | Drill-down to verbatim feedback within themes (Text Analytics) | Drill-down to verbatims within dashboards (Chattermill Product Updates) | All three provide access to original text |
| Automated tagging/themes | Hybrid Raw + Canonical Tags with learning mappings | Automated thematic modeling with human-in-the-loop (Thematic Analysis) | AI-powered themes/topics (Chattermill Product Updates) | Different taxonomic controls |
| Drivers / root-cause layer | Drivers to roll up tags by reason | Root-cause exploration via themes/taxonomy (Thematic Analysis) | Themes and observations for drivers (Chattermill Product Updates) | Terminology differs; intent is similar |
| Built-in AI metrics | Sentiment, churn risk, effort, outcome | Sentiment and theme metrics; churn risk not emphasized publicly (Text Analytics) | Sentiment and observations; churn risk not emphasized publicly (Chattermill Product Updates) | Metrics depth varies by platform |
| Custom classifiers/metrics | Custom AI Metrics as columns | Human-in-the-loop taxonomy and custom themes (Text Analytics Best Practices) | Custom taxonomies and segments (Chattermill Product Updates) | Different degrees of flexibility |
| Data exploration workspace | Data Explorer + Analyze Data tables/charts | Dashboards and theme explorers (Text Analytics) | Dashboards, segmentation, trend analysis (Chattermill Product Updates) | Workflow differences matter day to day |
| Natural-language Q&A | ✗ | Not a core positioning in public materials (Text Analytics) | Not highlighted as core capability (Chattermill Product Updates) | Some platforms emphasize Q&A assistants |
| Real-time alerts/anomalies | Not positioned as real-time alerting | Not emphasized as core feature set (Thematic Changelog) | Emphasized in product updates (Chattermill Product Updates) | Operational alerting varies |
| Helpdesk/agent tools (assist, QA) | ✗ | Not a focus (Text Analytics) | Not a focus (Chattermill Product Updates) | Agent assist is more common in SX tools |
| CSV ingestion | ✓ | Varies by deployment (Qualitative Data Analysis) | Varies by deployment (Chattermill Product Updates) | Useful for pilots and backfills |
| API / data export | ✓ | APIs and exports discussed in enterprise contexts (Thematic Product) | APIs and exports implied in platform scope (Chattermill Product Updates) | All support getting data out |
| Commercial model | 7-day free trial; pricing not publicly listed | Quote-based enterprise pricing (Thematic on G2) | Quote-based enterprise pricing posture (Chattermill Product Updates) | Budgeting and time-to-value differ |
If you want to pressure test this with your own data, that’s usually the cleanest way to decide. You can Learn More and see whether the full-coverage, evidence-backed workflow matches the way your team needs to answer questions.
If you’re an enterprise VoC team doing research-grade thematic work across surveys and broad feedback sources, Thematic is a sensible place to look, especially given its focus on thematic analysis best practices (Thematic Analysis). If you’re a support, product, or CX operator who’s constantly asked to prove the “why” behind a spike, Revelir AI’s ticket-level traceability and structured metrics tend to reduce the frustrating rework cycle.
One last practical move. Pick a real question you’ve struggled to answer, like “what’s driving negative sentiment among enterprise accounts,” then run the same question through each workflow. The tool that gets you to a defensible answer fastest is usually the one you’ll still be using six months from now. And if you want to run that test inside Revelir AI, Get started with Revelir AI (Webflow).
Frequently Asked Questions
How do I choose between Revelir AI and Thematic?
To decide between Revelir AI and Thematic, consider your primary needs. If you're focused on analyzing support conversations, Revelir AI is designed for that, providing evidence-backed metrics from 100% of ingested support interactions. On the other hand, if your goal is broader Voice of the Customer insights across various feedback sources like surveys and reviews, Thematic might be a better fit. Assess what type of data and insights are most critical for your team.
Can I integrate Revelir AI with other tools?
Yes, you can typically integrate Revelir AI with other customer support tools to enhance your analytics. Look for integration options that allow you to pull in support tickets and conversations seamlessly. This will help you get the most out of the evidence-backed metrics Revelir AI provides, ensuring that your insights are as comprehensive as possible. Check the specific integration capabilities on the Revelir AI platform for more details.
What if I need detailed insights from support tickets?
If you need detailed insights from support tickets, Revelir AI is a strong choice. It allows you to drill down into specific conversations and metrics tied directly to the tickets. This means you can trace back any insights to the original support interactions, giving you a clear picture of customer issues and trends. Make sure to set up your ingestion process to capture all relevant support conversations for the best results.
When should I use Revelir AI for customer feedback?
You should use Revelir AI when you want to focus specifically on support conversations and need metrics that are backed by actual customer interactions. It's particularly useful during product launches or when you're trying to identify recurring issues in customer support. By analyzing these conversations, you can gain actionable insights that can help improve your support processes and customer satisfaction.
Why does Revelir AI focus on support conversations?
Revelir AI focuses on support conversations because it aims to provide businesses with evidence-backed metrics that are directly tied to customer interactions. This approach allows teams to understand the context behind customer issues more deeply and make informed decisions based on actual support data. By prioritizing support analytics, Revelir AI helps organizations improve their customer service and address pain points effectively.