

Most small businesses don’t fail at AI because the tech isn’t ready. They fail because the pilot can’t survive a simple question: “Show me the proof.” No baseline. No traceability. Nobody can click a chart and land on the exact conversation that generated the number. So the pilot stalls.
Here’s the fix. Treat your first project like a 90-day measurement exercise, tight scope, 100% coverage of the relevant data, and evidence you can audit in two clicks. Keep it out of production, start from your existing exports, and make every metric traceable to real examples. That’s how you get a decision, not just a demo.
Key Takeaways:
- Anchor your pilot on evidence and traceability, not features or hype
- Start with a non-disruptive setup: CSV export or a simple helpdesk connection
- Score use cases with a quick rubric (strategy fit, feasibility, data readiness)
- Quantify the costs of sampling and “evidence debt” to build urgency
- Run weekly checkpoints: trends first, then drill into real conversations
- Use 100% coverage and auditability to win trust and funding
Ready to see what a 90-day, evidence-first pilot looks like on your data? Learn More
Why Most Small Business AI Pilots Miss The Mark
Most small-business pilots miss because they chase features, not proof. The winning pattern is boring: full coverage of a thin slice of data, metrics that roll up cleanly, and a click-through path to the exact examples behind every chart. That’s the difference between debate and a green light. A simple baseline for “before” and a defensible “after” makes the decision obvious.
The real failure mode is missing evidence
Here’s the thing. It’s usually not accuracy that kills the pilot. It’s that nobody can trace the metrics back to source conversations when asked. Leaders don’t buy black boxes; they buy lines they can audit and stories they can verify in minutes. Directionally right is fine, if it’s transparent.
You feel this when the room starts asking for examples. If your “drivers” can’t link to three representative quotes, you lose momentum. Same thing with sentiment spikes that can’t be explained. You need 100% coverage of the relevant dataset, a taxonomy leadership understands, and quotes attached to every claim. The job isn’t more dashboards, it’s evidence.
Why are measurable outcomes non negotiable?
If you can’t measure, you can’t decide. That doesn’t mean overengineering. Define one or two outcomes you’d defend in a board memo: time saved per ticket, reduction in high-effort conversations, or fewer churn-risk flags in key accounts. Keep it simple and verifiable.
Decide who signs off on the evidence and what “good” looks like before you start. Baseline in week one. Log lifts weekly. And insist every chart can be clicked into real conversations. Want a planning template? Many leaders align pilots to a straightforward AI adoption playbook so outcomes, not opinions, drive go/no-go.
Treat Your First AI Project Like A 90 Day Measurement Exercise
Your first AI project should look like a measurement pilot that fits inside your current workflow. Start with a CSV export or helpdesk connection, define one success criterion, and run weekly checkpoints. You’ll learn fast, avoid production risk, and gather evidence people trust. That’s the point.

Map processes to AI in five minutes
Do a quick audit, no workshops. List your top workflows by volume and pain: support triage, refund handling, knowledge lookup, lead follow-up. For each, note data availability, repetition, and human variance. You’re looking for unstructured text that AI can convert into metrics or decisions a human can verify.
You’ll spot patterns fast. Repetitive processes with clear outcomes make great pilots. So do messy, text-heavy workflows where leaders keep asking “why” and nobody’s checking the conversations. Pick one thin slice. Keep it self-contained. And make sure you can get the data without chasing five teams.
How do you score use cases quickly?
Use a simple rubric. Score three things: strategy fit (50%), feasibility (30%), and data readiness (20%). Strategy asks, “Does this move a top metric now?” Feasibility asks, “Can we set it up without heavy engineering?” Data readiness asks, “Can we get exports or API access this week?”
Weighting matters. A use case that hits a board-level metric but needs six weeks of plumbing isn’t a pilot; it’s a project. You want high-value density and a sponsor who cares. If you need a reference point, a clear leadership roadmap helps align the rubric with what actually gets funded.
The Costs Of Guesswork You Can Avoid
Guesswork has a bill. Sampling steals hours, rework creeps in, and trust erodes when nobody can trace a metric to its source. Quantify that cost upfront. In most teams, 100% coverage and traceability pay for themselves within a quarter by cutting debate and accelerating decisions.
Let’s pretend you lose two hours a day to manual reviews
Let’s pretend you handle 300 tickets per week and sample 10%. That’s 30 tickets at three minutes each, 90 minutes daily. Add context switching and reporting and you’re at two hours. Over 90 days, that’s ~90 hours. At a $60 fully loaded rate, you’ve spent $5,400 for a partial view that still invites debate.
And that’s the direct cost. The indirect cost is worse. Those hours slip into nights and weekends when incidents spike. Teams guess at drivers, ship broad fixes, and watch the queue fill again. A 90-day pilot that eliminates sampling replaces all that with evidence you can defend.
The price of evidence debt
Evidence debt shows up when the room asks “Show me where this came from” and you can’t click into examples. Work slows. People redo analyses. Arguments about representativeness replace action. You pay twice: once in engineering rework, again in customer trust.
A simple mitigation plan: full coverage of the dataset that matters and traceability to quotes. This isn’t fancy. It’s a discipline. If you want a lightweight structure to socialize this, see a pragmatic 90-day AI readiness roadmap. The play is straightforward: evidence first, then automation.
Tired of debating anecdotes? See how teams turn conversations into defendable metrics and examples in minutes. See how Revelir AI works
The Human Side Of An Unproven AI Bet
Risk isn’t just technical, it’s emotional. The fastest way to burn trust is a pilot that wakes people up at 3am or a dashboard nobody believes. Keep your pilot read-only, validate weekly with real examples, and protect morale while you learn. That’s how you keep momentum.
The 3am incident no one wants
A brittle pilot that touches production before it’s proven will trip alerts at the worst time. Don’t do that. Run the pilot in shadow mode: capture metrics, not actions. Compare AI outputs to human decisions quietly for a few weeks. Make accuracy the goal, not automation.
You’ll still move fast. Shadow mode gives you speed with a safety net. When the patterns make sense and the examples hold up, then you consider routing or drafting. Until then, protect sleep, customer experience, and credibility.
When your team stops believing the dashboard
Confidence drops the moment labels don’t match what people read in tickets. Fix it with a simple ritual: a weekly drill-down. Review trends, then open five to ten real conversations from the top segments. Invite agents and product. Ask, “Does this make sense?”
It’s a small habit with a big payoff. People start trusting the aggregates because they can audit them. You align on what “good enough” looks like for your business and adjust where it isn’t. Keep the bar directionally reliable and auditable. That’s how belief returns.
A Low Friction 90 Day Pilot That Proves Value
A credible 90-day pilot is light on plumbing and heavy on proof. One use case. One baseline. One success criterion. Weekly checkpoints. And every chart can be clicked back to the words customers actually said. You’ll avoid disruption, learn faster, and make a call with confidence.
Select one use case with a five minute scoring rubric
Choose a thin slice with high value density. Example: reduce high-effort support by identifying top friction drivers. Score it quickly by strategy fit, feasibility, and data readiness. Confirm a business sponsor, agree on a baseline, and document a single success criterion.
Be specific. “Reduce high-effort tickets by 20% in 90 days” is the right shape. Someone owns it. Someone signs off on the evidence. And everyone knows the next meeting ends with a decision, not another swim lane diagram.
Set up a minimal data pipeline in seven days
Move fast with what you have. Export last month’s conversations as CSV or connect your helpdesk via a simple API or no-code connector. Verify ticket counts, timestamps, and core fields. Keep scope tight, only add columns you’ll analyze in the next review.
Thin slices win. You can always add segments later. In week two, layer on drivers or canonical tags if you need them. In week three, consider enabling a focused custom metric. Build iteratively, guided by the questions leadership is actually asking.
Design success metrics and an evidence plan
Define what you’ll measure, how large your sample must be, and how traceability will work. Examples: sentiment by driver, churn risk flags, effort distribution. Establish your baseline in week one and log lifts weekly. Hard rule: every number must link back to real conversations.
This “evidence plan” becomes your meeting script. Open with the trend, click into the examples, pause. You want the nod from product and finance because the reasoning is inspectable. Use that green light to scope the next thin slice, measured the same way.
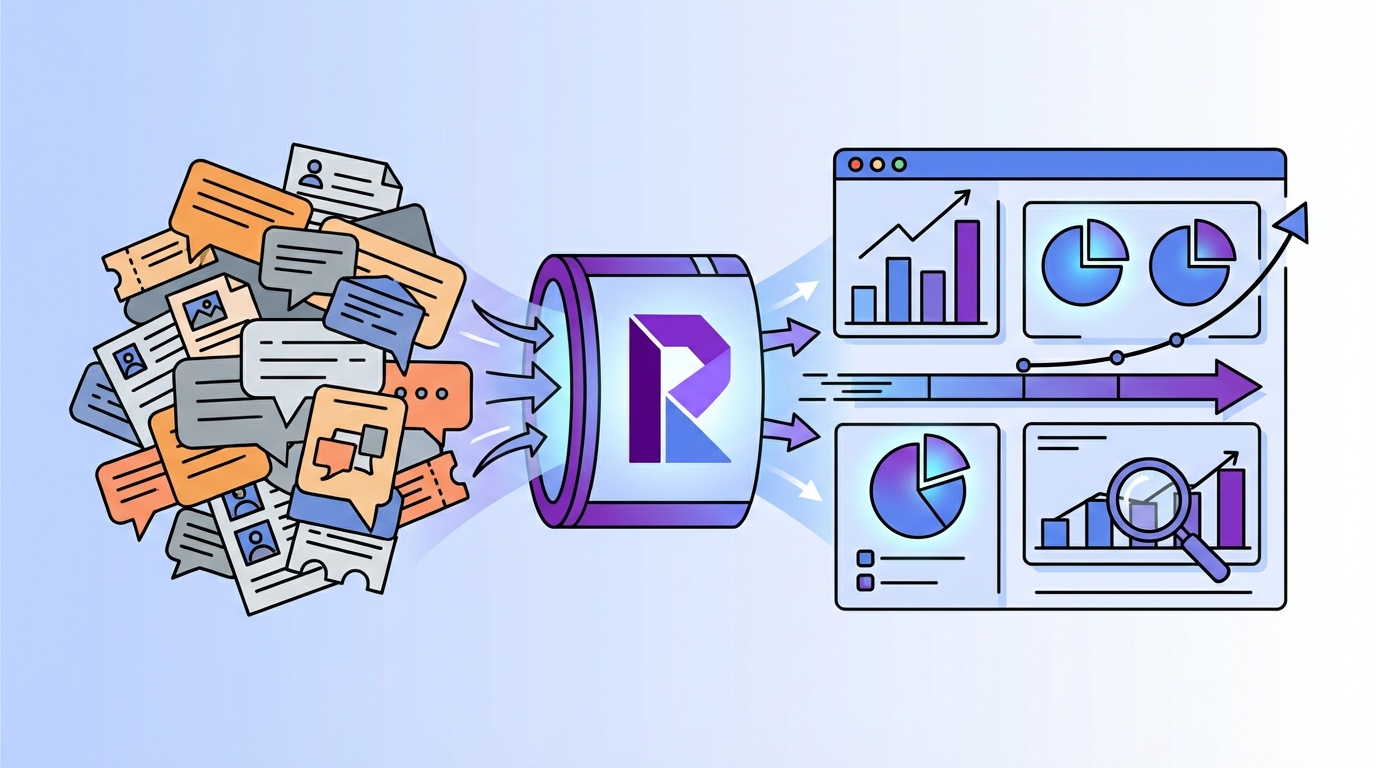
How Revelir AI Accelerates Your 90 Day Pilot
Revelir accelerates your pilot by turning messy conversations into evidence-backed metrics you can slice, trust, and audit. It ingests your tickets, processes 100% of them, and makes every chart clickable to the exact conversations behind it. You move from guesswork to decisions, faster and with less risk.
Evidence backed metrics with 100 percent coverage
Revelir processes 100% of the conversations you ingest, no sampling, no subset analysis, no manual tagging required upfront. Each ticket gets structured fields like Sentiment, Churn Risk, and Customer Effort, plus any custom AI Metrics you define for your business language.

Coverage matters because it eliminates the representativeness fights that slow decisions. When leadership asks, “Are we sure this is the whole picture?”, you can say yes and show them. It’s the antidote to the two-hour daily sampling habit you’re trying to retire.
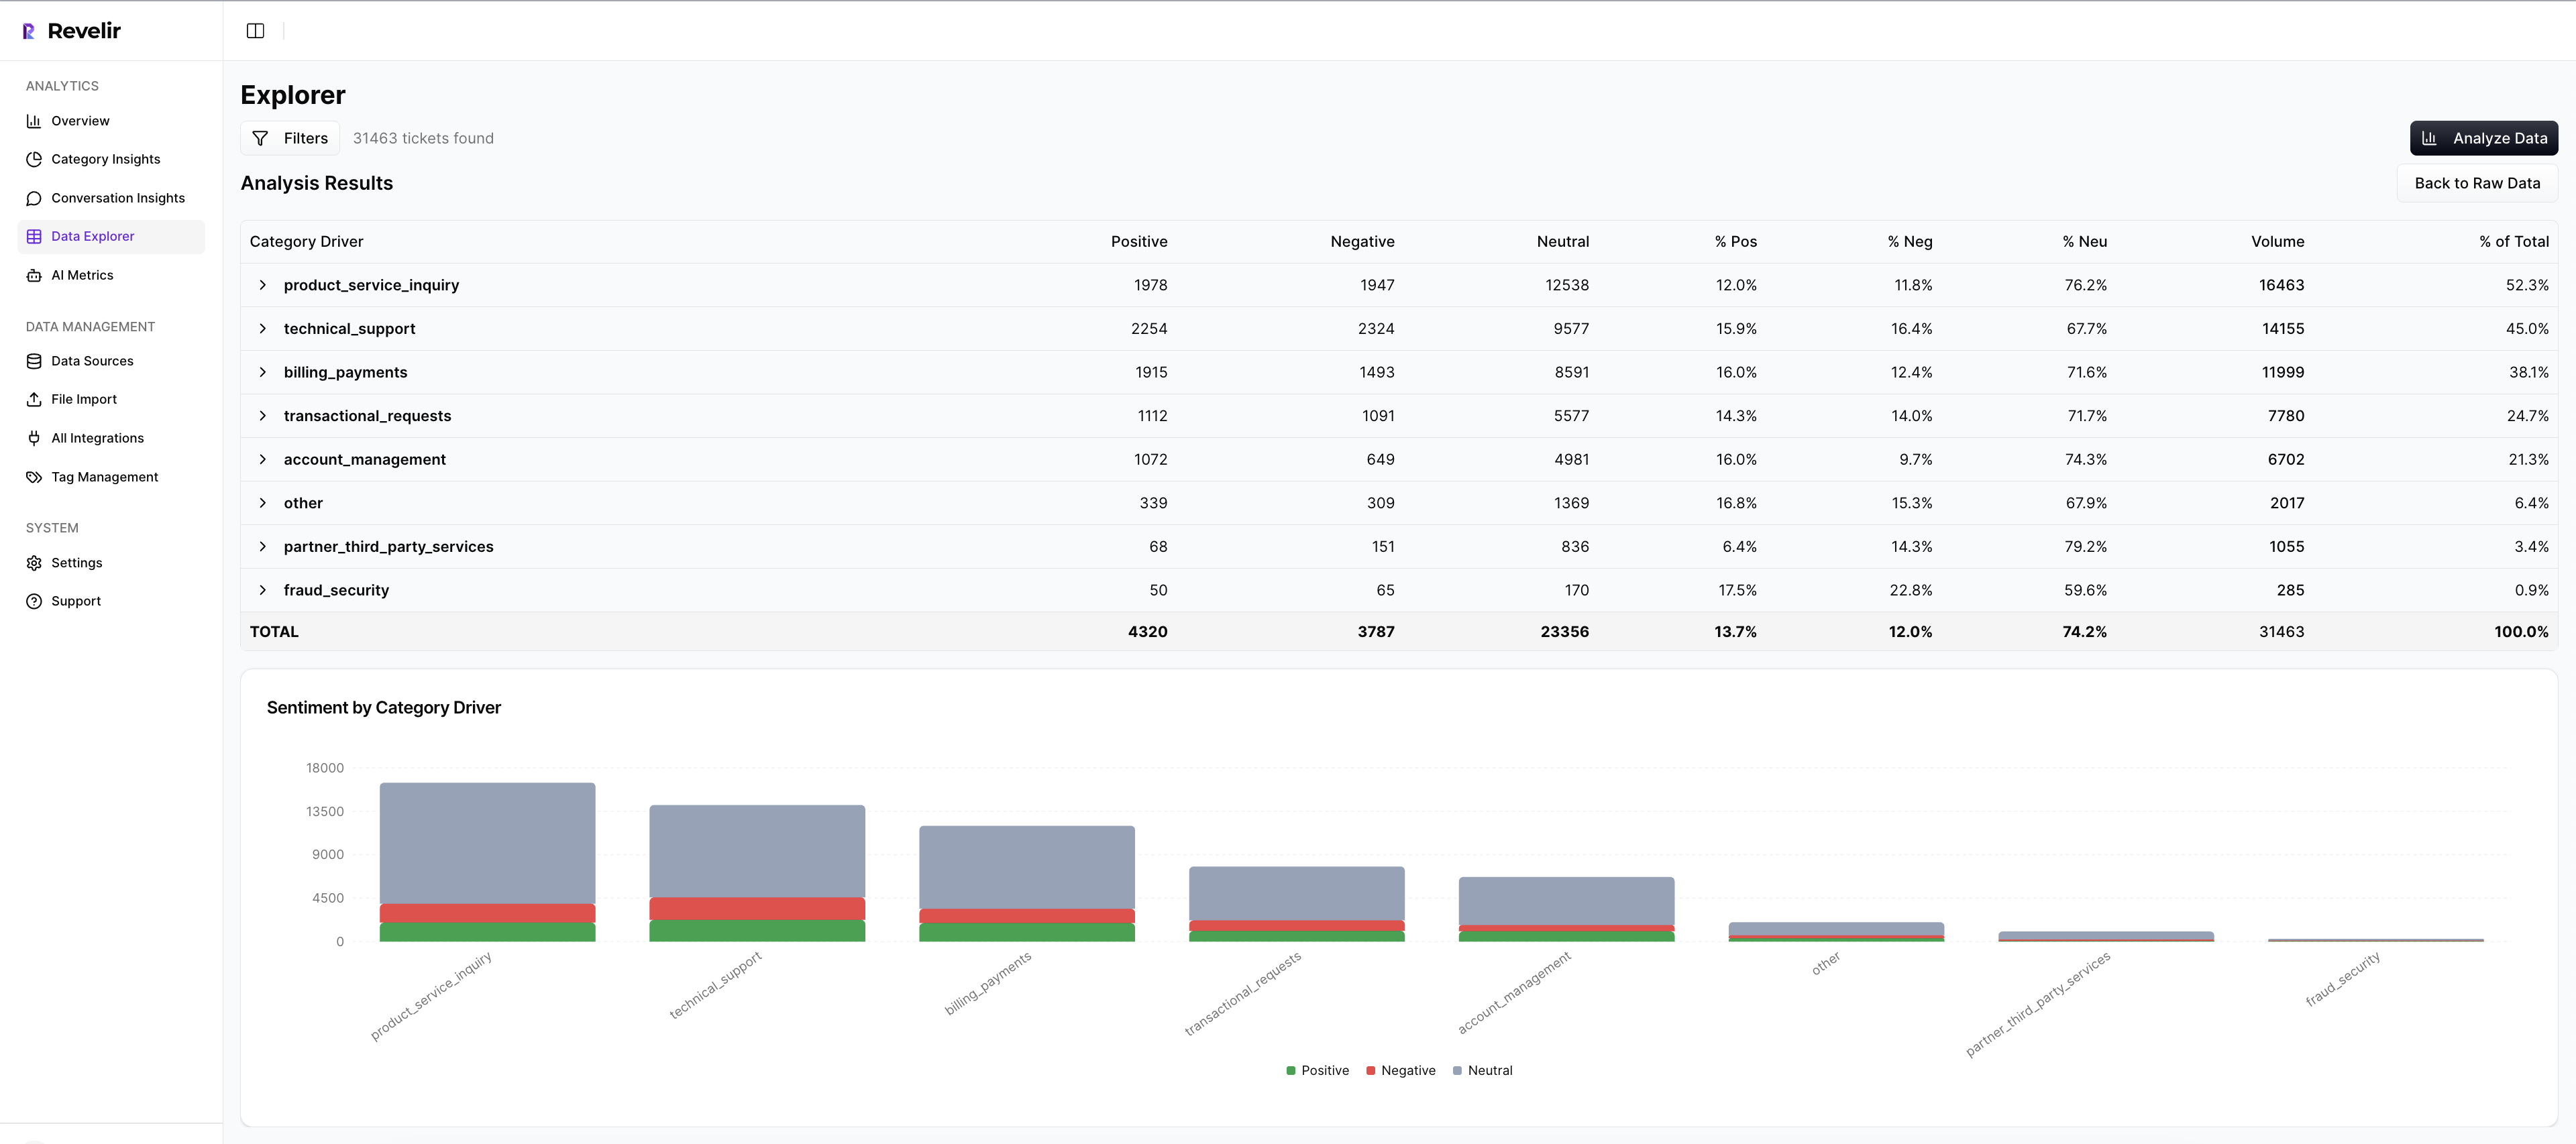
Use Data Explorer and Analyze Data for weekly reviews
Revelir’s Data Explorer is a pivot-table-like workspace for conversations. Filter by sentiment, churn risk, drivers, or canonical tags. Add columns for custom metrics. Then open Analyze Data to group metrics by Driver, Canonical Tag, or Raw Tag and see patterns in seconds.

Crucially, everything is interactive. Click any count, “19 churn-risk tickets in Billing”, and jump straight into Conversation Insights to read the transcripts, summaries, and tags behind that number. That’s your weekly ritual in one place: patterns, examples, action.
Traceability that earns stakeholder confidence
Every aggregate in Revelir links directly to real conversations and quotes. When someone asks “Show me,” you click once and you’re there. That transparency lowers debate and accelerates alignment, especially with product and finance, who need verifiable examples to prioritize work.
This is how you pay down evidence debt. Instead of defending charts, you review examples together, adjust where needed, and move forward. The model doesn’t have to be perfect, it has to be directionally reliable and auditable. Revelir is built for exactly that threshold.
If you want to validate this workflow against your own tickets, there’s a simple next step that takes minutes, not months. See how Revelir AI works
Conclusion
If you take one idea from this, make it this: treat your first AI project like a 90-day measurement exercise with evidence you can audit. Keep it light, keep it traceable, and keep it real by clicking from metrics to the exact words customers said. Do that and you’ll stop debating anecdotes, quantify the time you’re getting back, and know, without guesswork, whether to scale.
Frequently Asked Questions
How do I set up Revelir AI with my helpdesk?
To set up Revelir AI with your helpdesk, start by connecting your support platform, like Zendesk. Once connected, Revelir will automatically ingest historical tickets and ongoing updates, ensuring your analysis is always current. If you prefer, you can also upload a CSV file of your support tickets. Just go to the Data Management section, select File Import, and upload your CSV. Revelir will parse the data and apply its AI metrics and tagging, making insights available within minutes.
What if I want to customize my metrics in Revelir?
You can customize your metrics in Revelir by defining your own AI Metrics that reflect your business needs. This allows you to create specific metrics like 'Upsell Opportunity' or 'Reason for Churn'. Simply set the questions you want the AI to answer and the possible values it can return. Once defined, Revelir will analyze your conversations and store the results as structured fields, enabling you to pivot and analyze them effectively.
Can I validate metrics with real conversations in Revelir?
Yes, you can validate metrics with real conversations in Revelir. When you analyze data, you can click on any metric value to access Conversation Insights. This feature shows you the exact list of conversations behind the metric, complete with full transcripts and AI-generated summaries. This allows you to confirm whether the metrics align with the actual customer interactions, ensuring that your insights are grounded in reality.
When should I run analyses in Revelir?
You should run analyses in Revelir regularly, especially after significant changes in your product or customer feedback trends. For instance, if you launch a new feature or policy, check the sentiment and churn risk metrics to see how they are affected. Running analyses weekly or monthly can help you stay on top of emerging issues and track the effectiveness of your interventions over time.
Why does Revelir emphasize 100% conversation coverage?
Revelir emphasizes 100% conversation coverage because it ensures that no critical signals are missed. By processing every ticket without sampling, you gain a complete view of customer sentiment and issues. This approach eliminates bias and allows you to catch early signals of churn or frustration that might be overlooked in partial analyses. It also builds trust in your metrics, as every insight can be traced back to the actual conversations.