

Most teams try to tame support data with tidy categories and good intentions. It looks clean on the dashboard. It breaks in the wild. The reality is messier: customers use a hundred ways to describe the same issue, new problems appear mid‑quarter, and nobody’s checking whether rollups still match the words customers actually said.
Here’s the real headwind: manual taxonomies and sampling give you a false sense of control. You get pretty charts, not provable drivers. When leadership asks “What’s behind that spike?” the room wants quotes, not guesses. You need discovery that stays open, reporting that stays stable, and an evidence trail you can defend.
Key Takeaways:
- Use AI-generated raw tags for discovery, then normalize into 10–25 canonical categories for clarity
- Stop sampling: process 100% of conversations and preserve click-through to transcripts and quotes
- Maintain drivers (the “why”), not just categories (the “where”), to move decisions faster
- Reduce rework by updating mappings, not rewriting the taxonomy every quarter
- Set a lightweight review cadence to handle low-confidence mappings and new patterns
- Connect charts to evidence; trust grows when examples match aggregates
Ready to skip the taxonomy drama and see a working model? See how Revelir AI works.
Why Manual Taxonomies Miss Real Drivers
Manual taxonomies miss real drivers because they compress a long tail of language into brittle buckets. Emerging issues surface as dozens of phrasing variants that humans won’t predefine, so they disappear in reporting. The fix is a hybrid: let AI generate raw, high‑resolution tags, then promote durable patterns into canonical categories.
The long tail hides emerging issues
The long tail is where new problems live. They show up as “billing fee confusion,” “unexpected charge,” “charge seems wrong,” “fee not explained,” and a dozen cousins. Same theme. Many phrasings. If you expect humans to predict and maintain every variant, you’ll either overfit the taxonomy or miss the signal until it’s big and loud.
Discovery should stay open. That’s why you generate raw tags from every conversation—short, specific, machine‑friendly descriptors that capture nuance without forcing it into a box too soon. Over time, you’ll see clusters. Some burn out. Some harden into consistent patterns that deserve a stable home in your reporting language. That’s when you promote them.
Here’s the pattern we’ve seen work: keep the raw layer wide and forgiving, then curate a small, consistent set of canonical categories on top. Raw keeps you curious. Canonical keeps you credible. Both matter.
Why do sample-based reviews break trust?
Sampling speeds up reading, but it makes you blind where you most need vision. Let’s pretend you handle 1,000 tickets a month. Reviewing 10% at three minutes each costs five hours and still risks missing quiet, compounding issues. Full manual coverage is 50 hours. Neither option builds timely consensus.
The deeper problem is trust. When a chart can’t open the exact conversations behind it, people hesitate. You get “Is that representative?” and “Show me an example,” not a decision. Full-population processing with traceability fixes that. Every aggregate should be a doorway—click and you’re staring at the transcripts and quotes that created the number.
If you care about auditability, take a page from measurement science: confidence comes from repeatability and traceability. Teams that institutionalize a path from metric to evidence build credibility over time, not just a prettier dashboard. See the framing in NIST’s guidance on traceability and confidence in measurement for language that translates well to reporting standards.
Drivers and evidence beat tidy labels
Executives move when you name the driver and show the proof. Scores without causes stall decisions. “Negative sentiment up” is a shrug. “New customer negative sentiment is driven by onboarding friction in steps 2–3—here are the quotes” gets budget and prioritization.
Maintain a short list of drivers that explain why issues happen. Attach quotes to every metric so you can pivot from trend to transcript on demand. In practice, that means your analysis layer always supports two moves: aggregate to see the pattern, and click through to validate the story. Do both, and prioritization gets faster and more defensible.
Let AI Discover, Then Normalize To Your Language
A hybrid approach lets AI discover patterns while humans define the language of record. Keep raw tags wide for nuance and novelty. Normalize only what persists, using a minimal canonical schema your leadership recognizes. Preserve traceability from every rollup to the underlying conversations to avoid “black box” skepticism.

What is a minimal canonical schema and why 10 to 25 categories?
A minimal canonical schema keeps reports stable and legible across quarters. Aim for 10–25 categories. Fewer than 10 hides signal—everything blurs. More than 25 becomes a taxonomy job you didn’t hire for. Start from drivers (the “why”), then define canonical tags that speak leadership’s language—Billing & Payments, Account Access, Onboarding, Technical Issues, Performance.
You don’t need to get it perfect on day one. Start draft, then stabilize. The discipline is this: resist the urge to create a new category for every phrasing variant. Let raw tags soak up variation. Promote a new canonical category only when a pattern is durable and useful for decisions. That way, your schema evolves without exploding.
When you communicate the rules, keep them simple. One-line definitions, 2–4 inclusion criteria per category, and an overflow for Unknown/Needs Review. Clarity beats sophistication here. Everyone uses the same words the same way.
Preserve traceability from rollups to quotes
Trust grows when charts open to real conversations. Store raw tags, canonical tags, drivers, and AI metrics per conversation. Keep links to the full transcript and an AI summary. In analysis, every count should open the exact list of conversations behind it. That’s your antidote to “black box” doubt.
You’ll use that click-through in two ways. First, quick validation: read a handful of tickets to confirm the pattern makes sense. Second, persuasion: pull crisp quotes for cross‑functional reviews. When the path from trend to transcript is one click, you shift from arguing about methodology to acting on evidence. It’s the difference between an opinion and a proof point.
If your team is designing the human-in-the-loop piece, borrow thinking from taxonomy evolution work—lightweight review queues and incremental updates beat wholesale rewrites. For context, see patterns in human-in-the-loop taxonomy evolution research and adapt them to your workflow.
The Hidden Costs That Drain Your CX Team
Hidden costs pile up when you sample, manually reclassify, and present charts that can’t be audited. The math isn’t kind to busy teams. The rework is real. And the moment someone asks for proof and you can’t click through, momentum stalls.
The manual tagging time sink, a quick math example
Let’s pretend you handle 1,000 tickets a month. A “quick” 10% sample at three minutes per ticket costs five hours and still misses edge cases. Full manual coverage at the same pace would take 50 hours—more than a week for one person. And that’s just reading, not mapping, reporting, or acting.
That delay compounds. You detect problems late, escalate more often, and burn engineering cycles on the wrong fixes. The team works hard, but the learning loop is slow and biased. In the meantime, customers keep telling you exactly what’s wrong—in words you’re not measuring. It’s a tax you don’t need to keep paying.
A full-coverage pipeline eliminates that trade-off. You get speed and completeness, not speed or completeness. And you reallocate those hours to decisions and interventions, not plumbing.
The reclassification headache during taxonomy changes
Taxonomies drift. New features ship. Policies change. If your labels are hard-coded in dashboards or spreadsheets, every shift triggers rework. You rewrite rules. You reclassify history. You rebuild charts. Teams lose confidence in trend lines because the ground keeps moving under their feet. Frustrating rework, stale dashboards.
A hybrid model reduces churn. Keep raw tags intact. Evolve canonical mappings incrementally. When you update a mapping, historical conversations auto‑roll into the new category without manual rewrite. Names stay stable. Reporting stays comparable. And your analysts stop doing archaeology.
The interjection here: small weekly stewardship beats quarterly taxonomy overhauls. Ten quiet minutes today save a loud week next month.
When leaders ask for proof and you cannot click through
Nothing slows a meeting like a chart you can’t defend. If a graph can’t open the underlying conversations, confidence drops. You get follow‑up meetings, not decisions. People want quotes. They want context. And they deserve both.
Make click-through non‑negotiable. Every aggregate should be a gateway to evidence—transcript, AI summary, tags, and metrics. Run quick sampling checks in context to confirm patterns make sense. It won’t just improve accuracy; it will improve culture. People stop litigating methods and start owning outcomes. For language on repeatability and confidence, see NIST’s perspective on measurement confidence.
Still living in CSVs and ad‑hoc reviews? You’re not alone. But you don’t have to stay there. Learn More about moving to full coverage with traceable evidence.
You Need Evidence You Can Defend In The Room
You need evidence you can defend—fast, clear, and verifiable. The winning pattern is simple: show the driver, click a count, read two transcripts, and share quotes. People align when they hear the customer’s words, not your paraphrase. Transparent evidence changes decisions.
The 3 minute story that changes a roadmap decision
A VP asks why sentiment dipped among new accounts. You open the analysis, show the top driver, click the count, and skim two transcripts. One quote mentions confusion in step two of onboarding. Another calls out unclear billing during trial conversion. Now it’s not “sentiment is down.” It’s “this step is causing frustration—here’s where and why.”
Three minutes. One driver. Two quotes. Decision made. Engineering knows which workflow to adjust. CX knows which macro to update. Finance knows what to flag on invoices. That’s how evidence reduces debate and accelerates action.
This isn’t theater; it’s rigor. The transparency itself builds trust. See the research on how transparent evidence improves decision alignment and reduces second‑guessing in peer-reviewed work on transparent decision-making.
How confidence grows when examples match the numbers
Confidence compounds when quick spot checks match aggregates. Make it a habit: in reviews, read a handful of linked tickets from key segments. If examples align with the pattern, you greenlight the trend and act. If not, you adjust mappings or refine prompts. Either way, the loop between chart and evidence is short, frequent, and reliable.
Over a quarter, the organization starts to trust the numbers because the numbers repeatedly hold up under scrutiny. That trust is cultural capital. It buys you faster prioritization, fewer “prove it again” loops, and less friction between CX, product, and finance. In short: evidence earns speed.
Build A Hybrid Tagging Pipeline That Scales
A scalable pipeline balances AI discovery with human curation. Choose drivers and a minimal schema first. Generate high‑resolution raw tags automatically. Map raw to canonical with a blend of rules and similarity. Set a lightweight human review cadence with clear SLAs. That’s the flywheel.
Choose drivers and a minimal canonical schema first
Pick 6–10 drivers that explain why issues happen—Billing, Onboarding, Account Access, Technical Issues, Performance, Refunds. Then define 10–25 canonical categories leadership recognizes. Write one‑line definitions and 2–4 inclusion rules per category. Add a bucket for Unknown/Needs Review to keep accuracy honest.
The goal isn’t perfect coverage; it’s stable language. Keep names consistent across quarters so trends mean something. Evolve by updating mappings, not by multiplying categories. When a new pattern emerges, test it in the raw layer. If it persists and informs decisions, promote it. Otherwise, let the raw layer absorb the noise.
A note on maintenance: publish lightweight change notes when mappings shift. People appreciate the “why.” It reduces confusion and improves adoption.
Map raw to canonical with rules, similarity, and thresholds
Mapping needs both precision and recall. Start with deterministic heuristics—exact and fuzzy matches for high‑precision rollups (“payment_failed” → Billing & Payments). Layer in semantic similarity with an embedding search to catch phrasings you didn’t predict. Use confidence thresholds to decide when to auto‑map versus queue for review.
Avoid false friends with exclusion rules (“credit” near “documentation” ≠ Billing complaint). Allow multi‑label rollups when a raw tag legitimately sits under two drivers (e.g., “refund_flow_timeout” touches both Refunds and Performance). And record confidence per mapping so you can monitor drift, triage low‑confidence items, and tighten prompts where needed.
When refining the semantic layer, techniques from the information retrieval world are your friend; see an overview of embedding-based similarity methods for mapping quality. Also, treat prompt design as an ongoing craft—short, noun-phrase tags with domain terms tend to travel well across data; for context, see prompting considerations for reliable tagging.
How Revelir AI Operationalizes Hybrid Tagging With Traceable Evidence
Revelir operationalizes this hybrid pattern out of the box: 100% coverage, AI-generated raw tags, canonical mappings you control, an analysis layer to surface drivers, and one‑click traceability from every aggregate to the conversation. The result is discovery that stays open and reporting that stays trusted.
Full coverage processing with AI generated raw tags
Revelir processes 100% of tickets via a Zendesk connection or CSV uploads. There’s no sampling, no partial views. Every conversation is tagged with raw AI signals and enriched with AI metrics—Sentiment, Churn Risk, and Customer Effort when present—so you’re measuring the complete population, not a sliver.

That full coverage matters. It eliminates the sampling trap and the hours lost to manual review. It also catches early patterns before they turn into escalations. Each row in the data represents a fully processed conversation you can filter, group, and drill into as needed.
Analyze Data and filters to surface top drivers
Day to day, you work in Data Explorer. Add or remove columns. Filter by sentiment, churn risk, effort, driver, canonical tag, date ranges, or any imported metadata. With Analyze Data, you can group metrics by driver, canonical tag, or raw tag and see the distribution in a table and stacked bar chart.
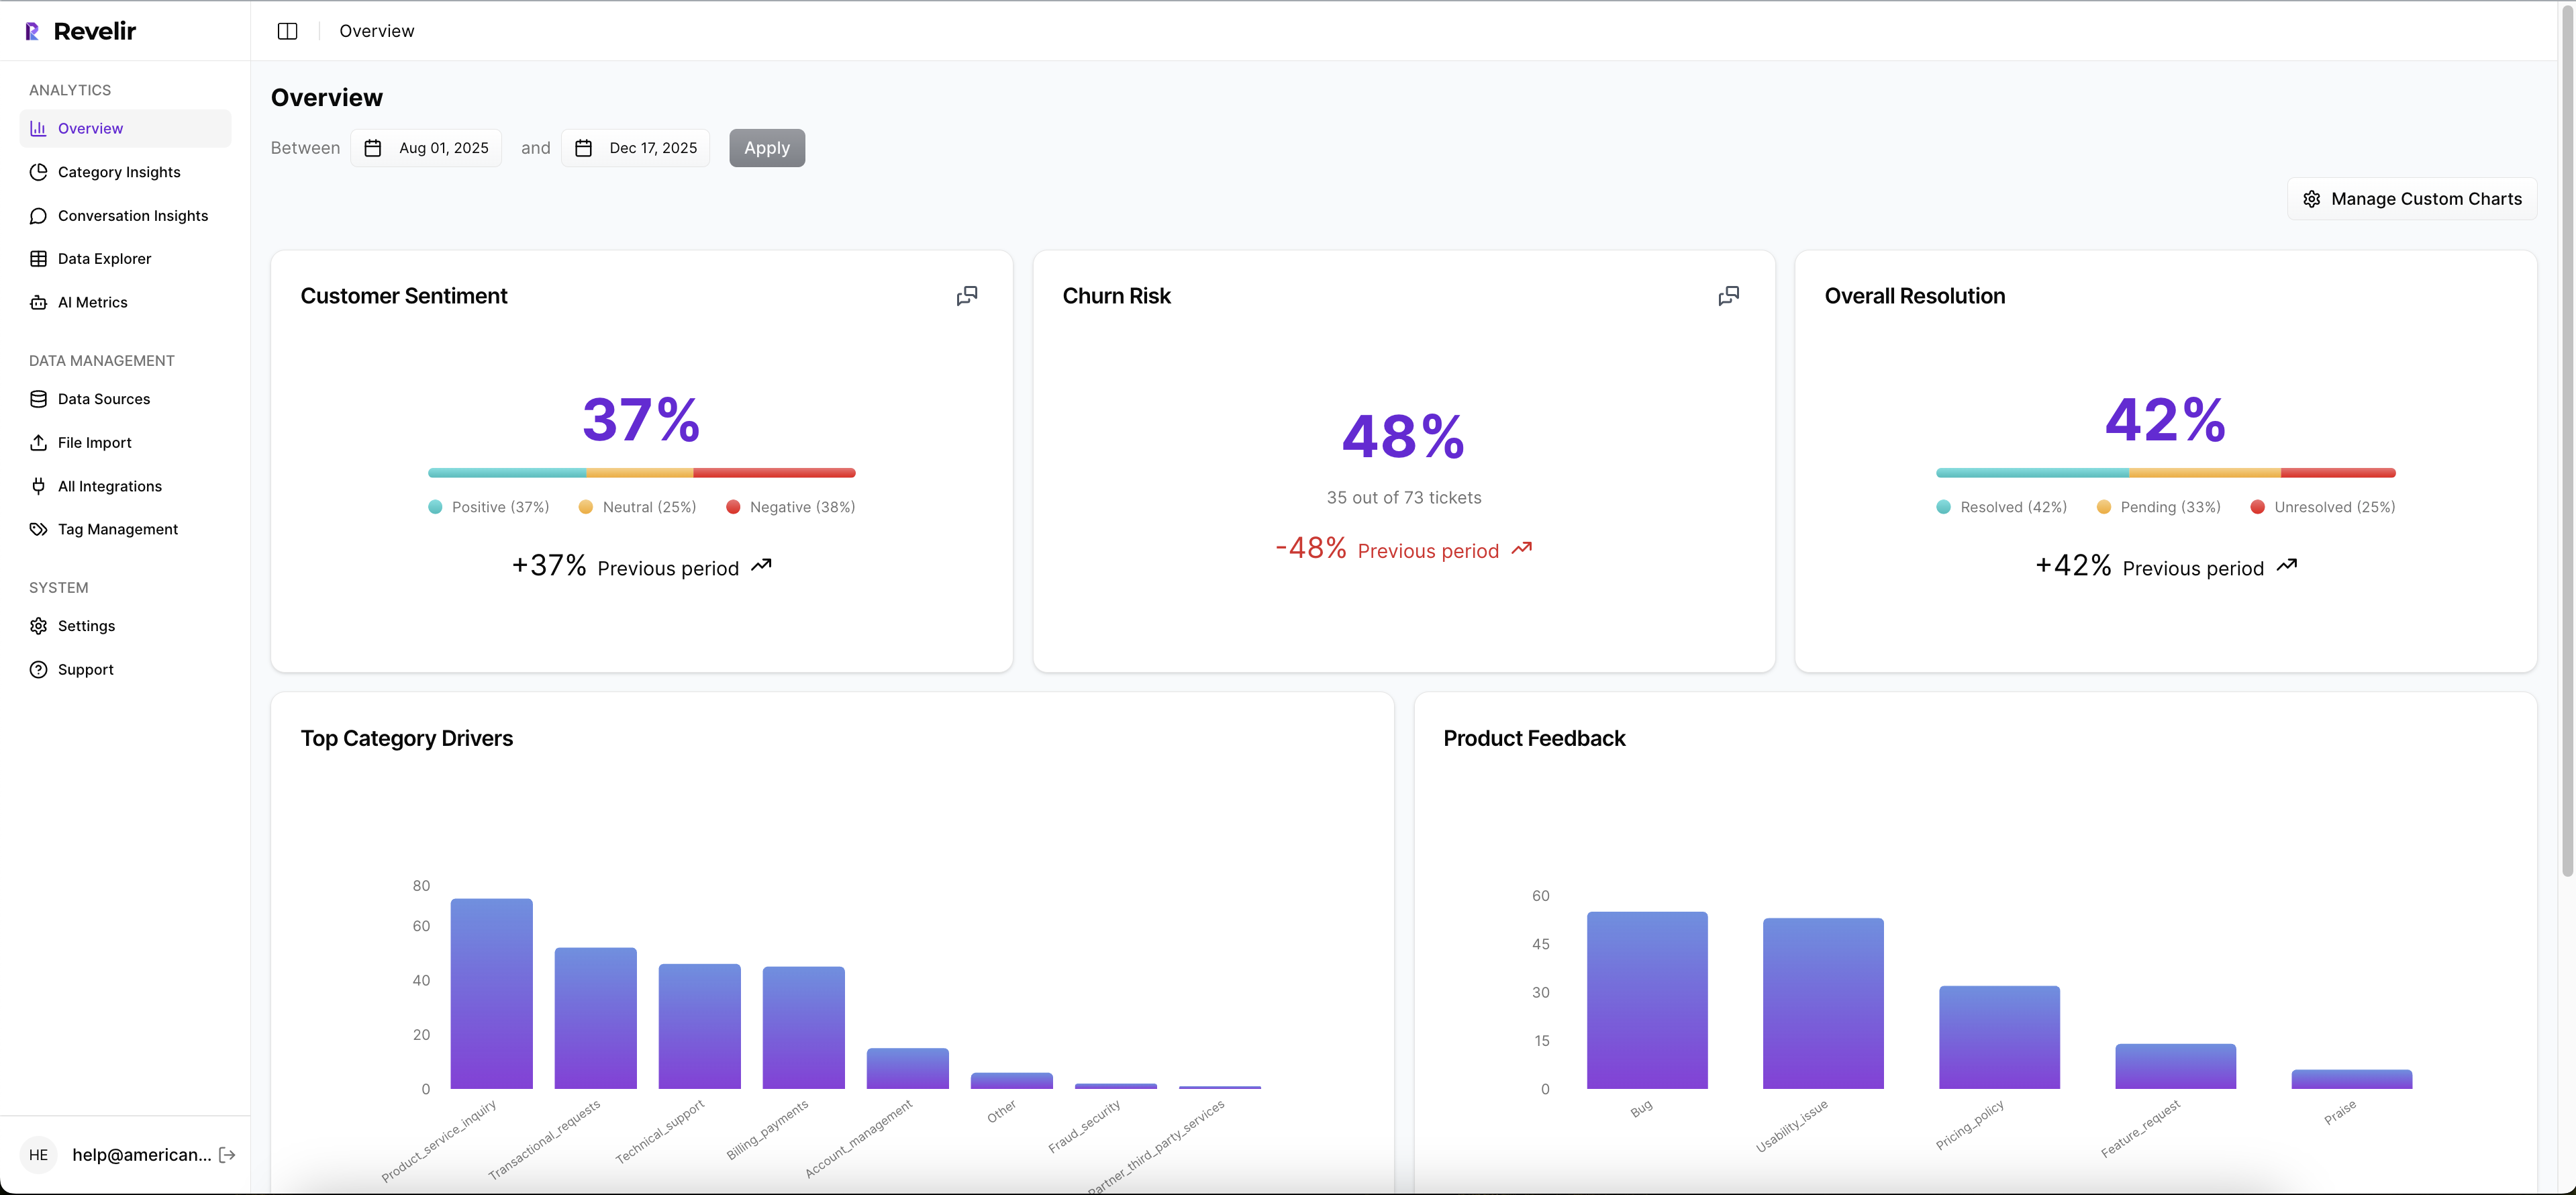
This is where you answer questions like “What’s driving negative sentiment among new customers?” or “Where is churn risk concentrated this quarter?” in seconds. The interactivity isn’t a gimmick; it’s how you move from volume metrics to credible drivers without writing SQL or exporting CSVs. When a segment looks interesting, you click the count to see the exact conversations behind it.
Conversation Insights links keep evidence one click away
Every aggregate in Revelir is traceable. Clicking a segment opens Conversation Insights for that slice: full transcripts, AI summaries, assigned raw and canonical tags, sentiment, churn risk, and effort. You validate the pattern immediately, gather quotes for leadership, and adjust mappings if a nuance appears.

This short path from number to narrative is the trust engine. It addresses the “Show me an example” challenge in real time and keeps meetings focused. It also makes weekly stewardship practical: curators can review low‑confidence mappings with evidence in context and publish small improvements that auto‑apply to historical and new conversations.
If you’ve been wrestling with the manual/time trade‑off, the difference is stark. You reduce the five‑hour sampling habit to a three‑minute validation loop, and you stop debating representativeness. That’s time you get back. That’s confidence you can show.
Want to see this workflow on real data? See how Revelir AI works.
Canonical tags, drivers, and learned mappings
Inside Revelir, you create canonical tags that match your business language and align them to high‑level drivers like Billing or Account Access. You group similar raw tags under those canonicals, and Revelir remembers the mapping—so future raw tags auto‑roll into the right category. Over time, reports stabilize while discovery stays open and useful.
Because mappings persist, your history updates automatically when you refine the taxonomy. No painful reclassification projects. No stale trends. And because all of it ties to 100% of your conversations, you close the loop from discovery to decision without a manual QA pass every week.
Revelir centralizes the work where you already are: analyze, decide, and, when needed, validate. The tool handles the structure; your team handles the story.
Reaching for an end-to-end, evidence-backed pipeline? Let Revelir carry the heavy lift so your team can focus on decisions. Learn More.
Conclusion
Manual taxonomies and sampling feel efficient until they don’t. The long tail hides new issues, reclassification drains time, and charts without quotes stall decisions. A hybrid model flips the script: let AI discover, normalize to a minimal schema, and keep every metric one click from evidence.
Do that, and you get two compounding benefits. First, speed—answers in minutes, not weeks. Second, trust—patterns that hold up under scrutiny. Whether you roll your own approach or use Revelir, set the bar higher: full coverage, traceability, and drivers with quotes. That’s how you turn support conversations into decisions you can defend in the room.
Frequently Asked Questions
How do I connect Revelir AI to my helpdesk?
To connect Revelir AI to your helpdesk, start by selecting your platform, such as Zendesk. Once you've chosen, follow the prompts to authenticate and link your account. This process allows Revelir to automatically import historical tickets and sync ongoing updates. After connecting, you can begin analyzing your support conversations without manual exports, enabling you to leverage Revelir's full capabilities for structured insights quickly.
What if I need to create new canonical tags?
If you need to create new canonical tags in Revelir AI, you can do so directly within the tagging system. Navigate to the tagging interface, where you can add new tags based on emerging patterns or issues you've identified. This flexibility allows you to refine your categorization over time, ensuring that your reporting aligns with your organization's language and needs. Remember, as you create new tags, the AI will learn these mappings for future conversations.
Can I analyze customer sentiment over time?
Yes, you can analyze customer sentiment over time using Revelir AI's Data Explorer. Start by filtering your dataset by date range and sentiment. Then, use the Analyze Data feature to group the results by drivers or canonical tags. This will provide you with a clear view of how sentiment trends change over specific periods, helping you identify patterns and address any emerging issues effectively.
When should I review low-confidence mappings?
You should review low-confidence mappings regularly, ideally during your lightweight review cadence. This could be monthly or quarterly, depending on your data volume and the frequency of new patterns. By assessing these mappings, you can ensure that the AI's classifications remain accurate and relevant. This proactive approach helps maintain the integrity of your insights and supports better decision-making across your teams.
Why does Revelir AI emphasize evidence-backed insights?
Revelir AI emphasizes evidence-backed insights because they provide a clear path from data to decision-making. By linking metrics directly to the source conversations, teams can validate findings and ensure that insights are grounded in real customer feedback. This transparency builds trust among stakeholders and helps prioritize actions based on verifiable evidence rather than assumptions or anecdotal reports.