

Most teams say they want “customer insight.” What they actually have are dashboards and hunches. Volume trends, CSAT, a few spicy anecdotes from Slack. It’s usually enough to get through a weekly standup. It’s not enough to defend a roadmap trade‑off.
Here’s the thing. The real signal lives inside the transcripts. Frustration cues. Churn mentions. Unsolicited product feedback you didn’t even ask for. When you measure 100% of conversations and keep a one‑click path to quotes, debates cool and decisions move. That’s the difference between storytelling and proof.
Key Takeaways:
- Stop sampling; measure 100% of support conversations and preserve traceability to quotes
- Pair scores with structured drivers and linked examples so decisions don’t stall
- Replace brittle manual taxonomies with a hybrid of AI raw tags and human‑refined canonical tags
- Quantify the cost of sampling: time lost, biased reads, wrong fixes that compound
- Stand up a repeatable workflow: ingest, validate, analyze by driver, and always drill into real tickets
Why Sampling And Score Watching Keep You In The Dark
Sampling and score-watching hide the very signals that explain what to fix and why. The answer is 100% coverage with traceability, so every metric links to the exact conversations behind it. For example, pairing sentiment with drivers and quotes turns “scores” into action that earns buy‑in.
The Signals That Matter Live Inside Conversations
The strongest signals rarely show up as tidy survey scores; they sit in the back‑and‑forth of real tickets. Frustration language, “we’re considering alternatives,” repeated setup confusion, those are not reliably captured by forms. You don’t catch that by sampling 10% and hoping the right tickets landed in your bucket. You catch it by processing every conversation and pivoting across cohorts, product areas, and weeks.
If you’ve ever walked into a review with a downward CSAT curve and gotten grilled on “why,” you’ve felt this gap. Without conversation‑level evidence, people debate representativeness instead of acting. Third‑party rundowns of ticket analysis echo this pattern: without structured data and linked examples, teams stay abstract and slow. If you need a primer to ground your team, point them to a neutral overview like Zendesk ticket analysis concepts for context, then go further with your own evidence.
Why Scores Alone Stall Decisions
Scores signal “something’s up”; they rarely say “here’s the fix.” A dip in sentiment could be pricing confusion, onboarding friction, or performance instability. Same thing with effort. You can spend a sprint on the wrong fix if you don’t separate drivers from noise. Leaders aren’t allergic to bad news; they’re allergic to vague asks with no proof.
Linking metrics to drivers and quotes is what changes the room. “Negative sentiment is up” invites skepticism. “Among new customers, 41% of negative sentiment ties to onboarding steps 2–3, here are three representative conversations” earns nods and next steps. That’s how you turn a curve into a plan instead of a debate.
Prefer to skip the theory and see it? Take five minutes and see how Revelir AI works with real, linked examples.
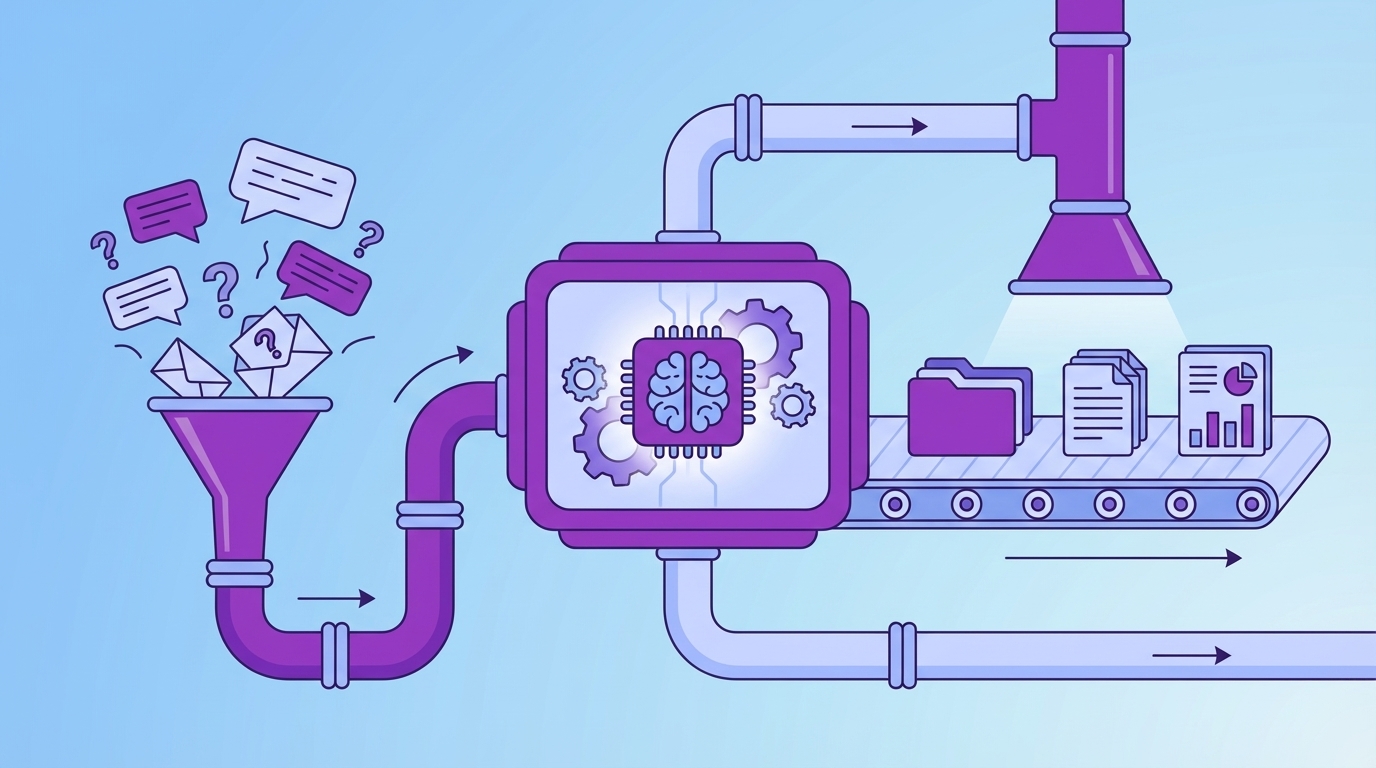
The Real Bottleneck Is Unstructured Conversations
The real bottleneck isn’t willpower or talent; it’s the messiness of unstructured text at scale. You can’t pivot on drivers or prove a claim if everything lives as free text. The fix is a layer that converts transcripts into tags and metrics and lets you jump to quotes in one click. Think: structure first, proof built‑in.
What Traditional Approaches Miss About Coverage And Traceability
Manual reviews catch nuance but collapse under volume. BI dashboards visualize beautifully, once you give them structured fields. In between those worlds sits the missing middle: a system that ingests every ticket, applies consistent metrics, and keeps evidence a click away. Without that, you either move slow or ask people to trust a black box. Neither holds up in the room.
This is where your process design matters. Stop piecing together exports, regex rules, and one‑off notebooks. Start with ingestion, add a consistent metrics layer, and wire the analysis space to drill‑downs. If you need to map stakeholders to steps, frameworks like an IT ticketing system process flow are useful, then update them for a world where AI produces the structure and humans validate.
The Hidden Complexity Of Manual Taxonomies
Hand‑built taxonomies drift. Rules get brittle. New phrasing breaks old categories. Nobody’s checking the maintenance cost when they propose “let’s just add a label.” And now you’ve got a reporting language nobody trusts. A hybrid approach is saner: let AI generate granular raw tags for discovery, then have humans curate canonical tags and drivers for reporting. Over time, mapping improves and the taxonomy stabilizes.
This hybrid model gives you both early detection and executive clarity. Raw tags spot the weird, new, and emerging. Canonical tags and drivers communicate in the language leadership expects, Billing, Onboarding, Account Access. You get discovery without chaos, clarity without rigidity. More importantly, you keep the receipts: click a count, read the tickets, validate the story.
The Hidden Costs Of Sampling And Ad Hoc Reviews
Sampling burns time, invites bias, and delays the fix. Quantify it and the choice becomes obvious. Review 10% of tickets at three minutes each? That’s five hours for a partial view. Review 100% manually? Fifty hours. Meanwhile, churn risk cues slip by and you’re arguing about representativeness. That’s not a strategy; it’s a stall.
Time And Bias You Cannot Afford
Let’s pretend you handle 1,000 tickets this month. Ten percent at three minutes each costs five hours. Those five hours still miss patterns that only appear in the other 900. The only way to remove bias is coverage. And the only way to keep pace is automation that doesn’t hide its work. Otherwise, you’re choosing between slow and shallow.
Ad‑hoc reviews make it worse. Spikes trigger scramble sessions dominated by the loudest story, not the most representative pattern. Teams leave with “we should write more help articles” because it’s doable, not because it’s right. Best‑practice lists acknowledge the need for consistency, but without structured, linked evidence, consistency collapses into opinion. If your team needs operational hygiene alongside structure, skim a guide like ticket handling best practices as a baseline, then enforce truth with data.
The Opportunity Cost Of Wrong Fixes
Score‑only reads lead to symptomatic responses: generic apology emails, documentation blitzes, small policy tweaks. Some help. Many don’t. Every sprint spent on the wrong fix compounds: escalations rise, queues swell, sentiment dips, agents burn out, and product velocity drops. You pay twice, once in effort, again in credibility, when you can’t prove the driver.
This is where traceability pays for itself. If a VP asks “show me two tickets,” you should click a number, open transcripts, and read quotes aloud. If you can’t, work gets deprioritized behind roadmap items with clearer proof. Evidence changes that calculus in your favor. It also shortens the path from discussion to decision because nobody has to take your word for it.
Tired of rework and stalled reviews? There’s a faster lane. Learn More about going from raw tickets to linked, defensible metrics.
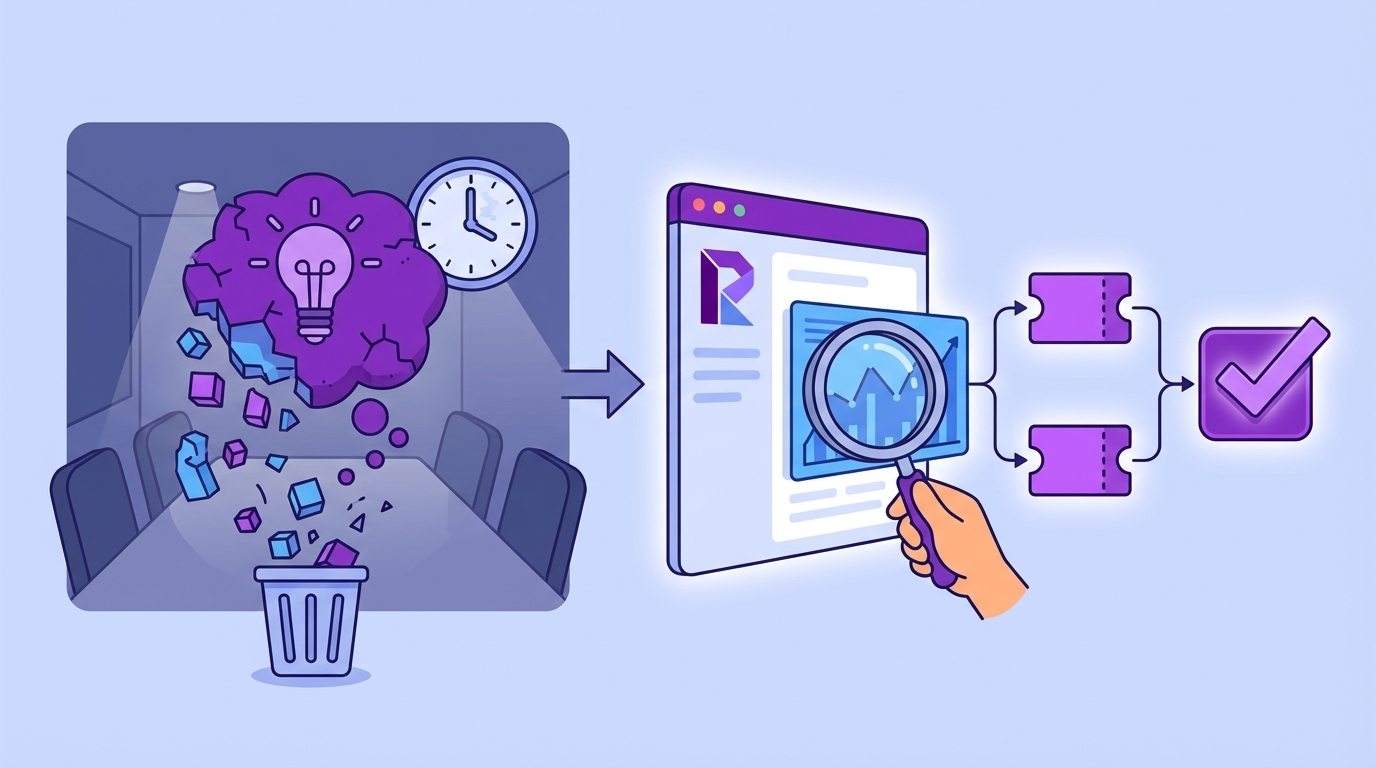
When Insights Die In The Room
Insights die when you can’t validate them on the spot. The fix is simple: build your workflow so every aggregate can be drilled into within seconds. Three sentences, two tickets, one decision. That’s the bar in a skeptical room.
The Three Minute Challenge From A Skeptical PM
We’ve all been there. You present the trend. Someone asks for examples. If you’re digging through spreadsheets or Slack, the room cools. If you click the count and open conversation drill‑downs, transcripts, summaries, metrics, tags, the conversation shifts. Scope, trade‑offs, and next steps replace forensic debates.
That’s not about theatrics; it’s about trust. Fast validation says, “we did our homework, and you can check it.” It also prevents weaponized anecdotes, those one‑off stories that derail prioritization. You’re anchoring decisions to patterns with receipts, not stories that just happen to be memorable.
When Your Largest Customer Threatens To Churn
Churn risk whispers long before it shows up in revenue. “We’re evaluating alternatives.” “This workflow isn’t working for our team.” Without consistent detection and grouped analysis, that whisper stays quiet until renewal. With churn risk flagged across 100% of conversations, you can isolate patterns by segment, account tier, or product area and act early.
CSMs walk in with proof: “Here are the five conversations from your team last month, and what we changed.” That reframes the renewal from risk to resolution. For teams sharpening their analysis muscle, a plain‑English walkthrough like how to analyze support tickets can help align roles, then level up with evidence‑backed drill‑downs.
Build A Repeatable, Evidence-First Workflow
An evidence‑first workflow is simple: define your questions, ingest everything, structure the text, and keep validation one click away. You move from discovery to decision without switching tools or losing trust. For example, you can run “Sentiment by Driver,” click into the worst segment, and pull quotes for leadership in minutes.
Define Goals, Questions, And Success Metrics Upfront
Start by naming the questions you need to answer and who needs them. “What’s driving negative sentiment for new accounts this month?” “Which drivers correlate with churn risk for Enterprise?” “How quickly can we verify a spike?” Then define success: fewer high‑effort tickets, reduced resolution time, lower churn risk density in priority segments.
Write it down. Share it with product, success, and CX. This forces alignment and keeps your taxonomy tethered to decisions, not elegance. It also clarifies which metrics matter and which are nice‑to‑have. A simple doc beats months of “what does this label mean again?” conversations.
Ingest 100 Percent Of Conversations And Validate The Pipeline
Connect your helpdesk or backfill with CSVs. Confirm counts, date ranges, and a quick sentiment overview. Make sure new tickets flow automatically so your analysis stays fresh. Then set a lightweight validation routine: weekly spot checks where you read a few tickets and confirm the metrics “make sense.”
Your checklist can be boring and effective:
- Counts match the source system within an expected margin
- Key fields populate reliably (sentiment, churn risk, tags)
- Sample transcripts are readable; summaries align with the text
- Aggregates hold up when you click into real tickets
Interjection. Don’t over‑engineer this. Consistency beats complexity.
Adopt Hybrid Tagging, Raw Discovery Mapped To Canonical Drivers
Let AI generate granular raw tags to surface emerging issues you didn’t think to label. Then group related raw tags into canonical categories, your business language, and attach drivers for executive clarity. Assign clear ownership: who approves new canonical tags, how mappings get updated, and the cadence for drift reviews.
Once this is in place, grouped analysis gets fast. You can run “Churn Risk by Driver” and know the categories are stable and trusted. If you want a simple rubric for running grouped analyses without overthinking it, see a straightforward outline like how to analyze support tickets and adapt it to your taxonomy and review cadence.
How Revelir AI Automates This End To End
An evidence‑backed workflow is easier when the plumbing is done for you. Revelir AI processes 100% of conversations, turns free text into structured metrics and tags, and keeps a one‑click path to the exact tickets behind every number. It’s built for the moment when someone says, “show me the examples.”
Full Coverage Processing With Evidence-Backed Traceability
Revelir AI analyzes 100% of uploaded or ingested tickets automatically, no sampling, no manual tagging required to start. Every aggregate, negative sentiment by driver, churn risk by category, links to Conversation Insights with transcripts, AI summaries, tags, and metrics. That traceability kills the “prove it” pause and protects you from biased reads that sampling invites.
The payoff is concrete: faster decisions, fewer detours into methodology debates, and a shared understanding of the “why” behind the number. When the CFO asks for examples, you click a count and read quotes. When product asks for scope, you pivot across segments and time windows without leaving the analysis space. Revelir AI makes evidence routine, not a scramble.
Hybrid Tagging And Driver Mapping Without Manual Upkeep
Revelir AI generates granular raw tags for discovery, then lets you roll them into canonical tags and drivers for clean reporting. Over time, Revelir learns your mappings so similar raw tags auto‑group into the right categories. You get evolving discovery with stable reporting language, without brittle rule libraries or constant maintenance.

This hybrid system gives you both: early detection of new patterns and leadership‑ready clarity. It also means “What does this label mean?” stops derailing meetings. Categories stay meaningful, trend analysis stays clean, and your taxonomy evolves with your customers instead of fighting them.
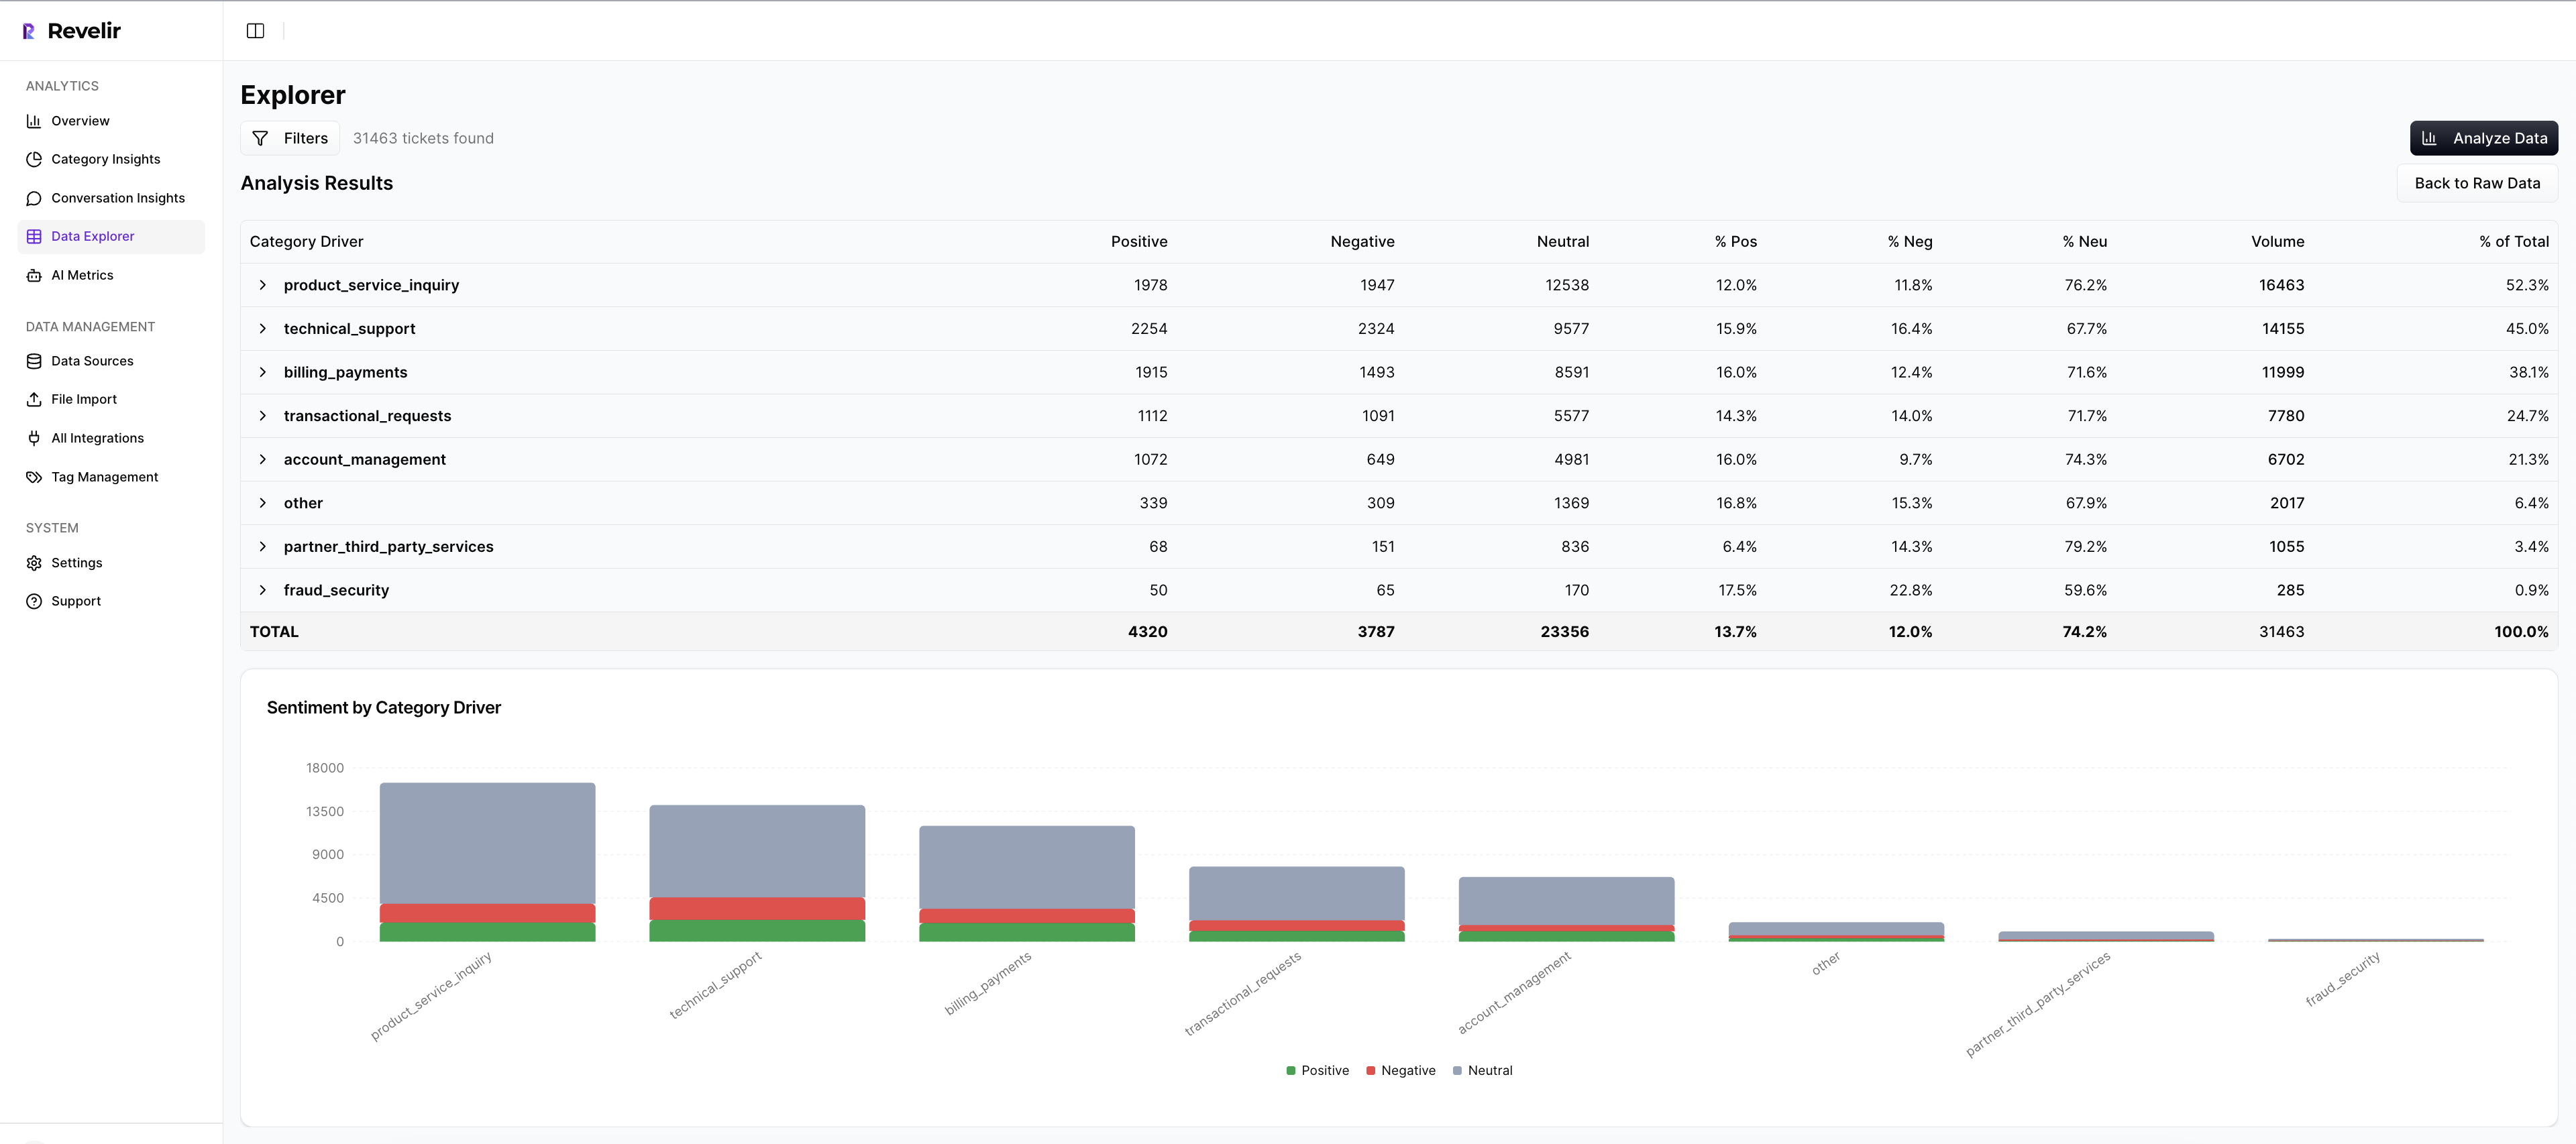
Data Explorer And Analyze Data For Grouped Insights
Most of your day lives in Data Explorer, a purpose‑built, pivot‑table‑style workspace. Filter by sentiment, churn risk, effort, canonical tag, driver, and metadata. Add or remove columns. Sort by volume or severity. Then run Analyze Data to summarize metrics by driver or category and see distributions at a glance. From any number, click into the underlying conversations.

This closes the loop between pattern and proof. You move from “What’s driving negative sentiment?” to three representative tickets in seconds. And when priorities change, you adjust filters and rerun the analysis, no spreadsheets, no rework. It’s the fastest way to answer CX questions and bring product along with evidence.
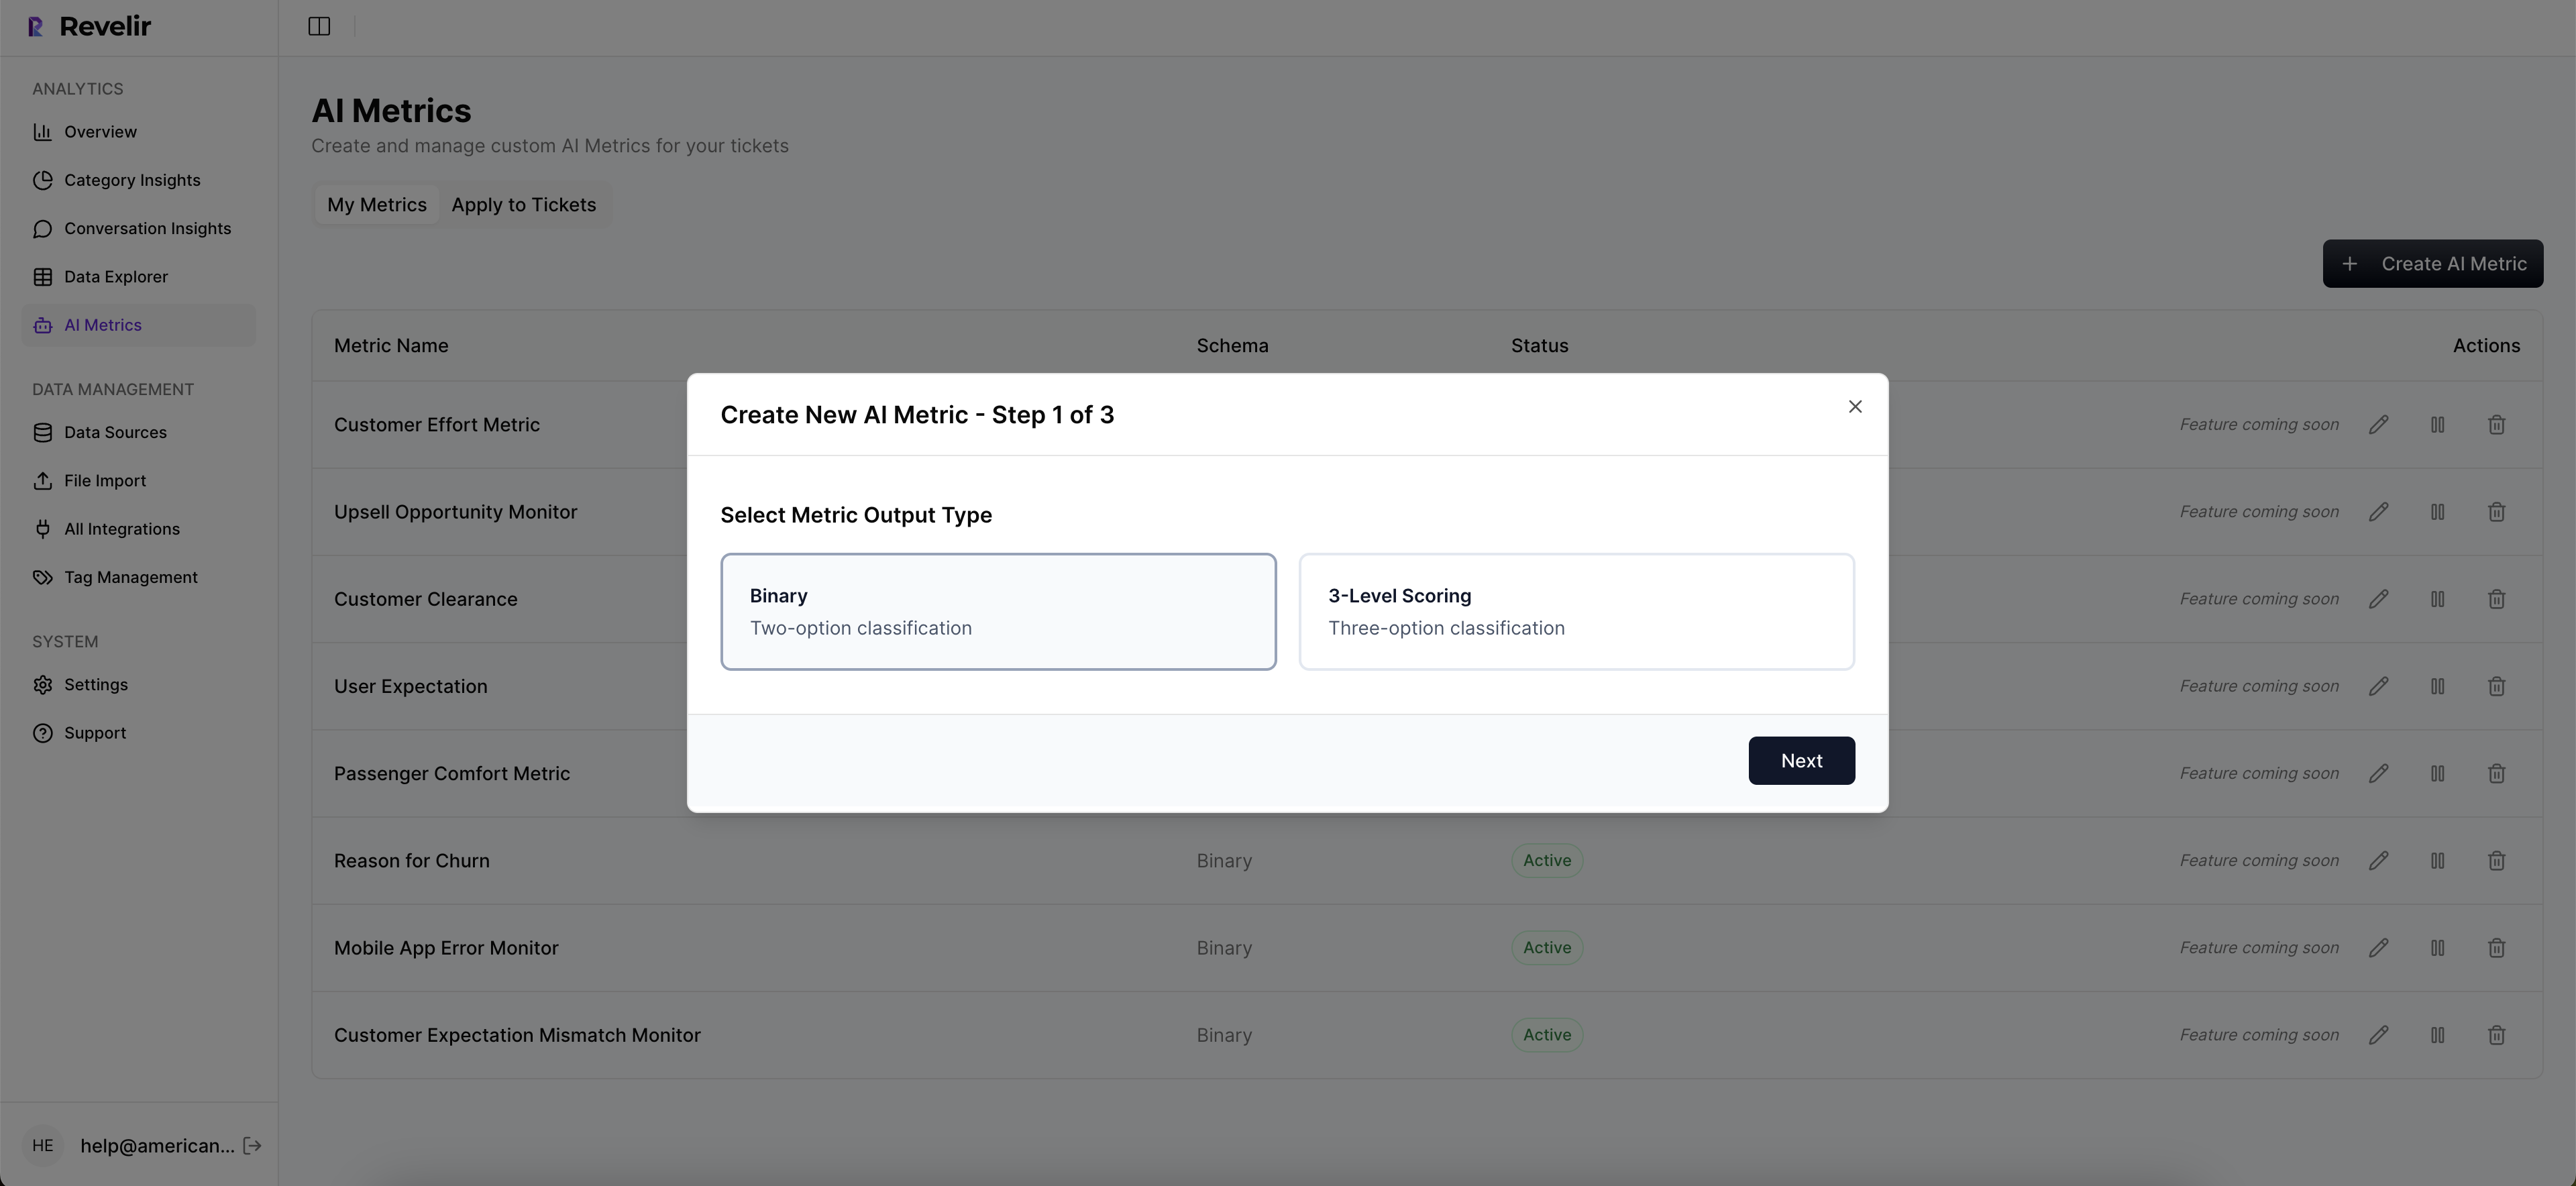
Custom AI Metrics That Match Your Business Language
Out of the box, Revelir AI scores sentiment, churn risk, and customer effort. You can also define custom AI metrics, Upsell Opportunity, Reason for Churn, or domain‑specific classifiers that matter to your org. Revelir scores each conversation and exposes those fields for filtering, grouping, and export across the platform.
This keeps your reporting in your language. More importantly, it anchors accuracy at the right bar: a trustworthy threshold where, if you read a handful of tickets, you’ll say, “Yes, that makes sense.” Patterns hold up, and you can always click into tickets to validate edge cases before you present.
Ready to move from anecdotes to evidence with your own data? Get Started With Revelir AI and see linked, defensible insights in minutes.
Conclusion
If you want faster, defensible decisions, stop sampling and stop arguing with scores. Capture 100% of conversations, structure them into drivers and metrics, and keep a one‑click path to quotes. That’s the workflow that survives budget scrutiny and earns product’s trust. Whether you build it yourself or use a tool like Revelir AI, set a higher bar: evidence, or it didn’t happen.
Frequently Asked Questions
How do I set up Revelir AI with my existing helpdesk?
To set up Revelir AI, you can connect your helpdesk directly or upload a CSV of past tickets. If you're using a platform like Zendesk, simply follow the integration steps to sync your ticket data. Once connected, Revelir will automatically ingest your support conversations, applying AI metrics and tags to each ticket. This means you can start seeing insights in minutes without needing to build classifiers from scratch. If you opt for a CSV upload, ensure your file includes all necessary fields like ticket ID and conversation text to get accurate results.
What if I want to customize the metrics in Revelir AI?
You can easily customize the metrics in Revelir AI to better fit your business needs. Start by defining your own AI Metrics that reflect your specific terminology, such as 'Upsell Opportunity' or 'Customer Effort'. These custom metrics can be configured during the setup process and will be applied consistently across your data. This flexibility allows you to tailor the insights to what matters most for your team, ensuring that the data you analyze aligns with your operational goals.
Can I analyze historical ticket data with Revelir AI?
Absolutely! You can analyze historical ticket data by uploading past conversations or connecting your helpdesk API. Revelir AI processes 100% of the uploaded tickets, ensuring that you have a complete view of your support interactions. Once the data is ingested, you can use the Data Explorer to filter and analyze the historical data by various metrics like sentiment, churn risk, and customer effort. This allows you to identify trends and drivers over time, making it easier to address ongoing issues.
When should I validate AI outputs in Revelir AI?
It's a good practice to validate AI outputs whenever you notice discrepancies or before making major decisions based on the data. After running analyses in Data Explorer or using the Analyze Data feature, take the time to drill down into specific tickets using Conversation Insights. This allows you to review the full transcripts and ensure that the AI-generated metrics align with the actual conversations. Regular validation helps maintain trust in the insights and ensures that your team is acting on accurate information.
Why does Revelir AI emphasize 100% conversation coverage?
Revelir AI emphasizes 100% conversation coverage because sampling can lead to biased insights and missed signals. By processing all support conversations, Revelir ensures that every critical piece of feedback, frustration cue, or churn mention is captured. This comprehensive approach allows teams to pivot confidently across their data, making informed decisions based on complete evidence rather than partial views. It transforms customer support data into actionable insights that can drive improvements in product and customer experience.