

Most teams don’t have a data problem. They have a translation problem. You’ve got thousands of conversations sitting in your helpdesk, a few dashboards, and a pile of anecdotes. Still, when someone asks “What’s driving churn risk right now?”, the room pauses. Everyone has a piece. Nobody has the whole picture with proof.
Here’s the thing. You can’t sample your way to confidence on high‑stakes calls. You need metrics computed from 100% of conversations and the receipts to back them up. Numbers you can pivot. Quotes you can show. So when budget and roadmaps collide, you’re not arguing lore—you’re pointing to evidence.
Key Takeaways:
- Stop sampling. Compute metrics across 100% of conversations to eliminate bias and blind spots
- Pair every aggregate with traceable evidence (tickets and quotes) to earn fast buy‑in
- Convert text into structure: raw tags → canonical tags → drivers → AI metrics
- Standardize analysis with repeatable Data Explorer views and grouped analyses
- Validate quickly with conversation drill‑downs; aim for “makes sense” accuracy, not perfection
- Operationalize ownership, exports, and a quarterly taxonomy review so insights stick
Why Sampling And Score Watching Keep Teams Stuck
Sampling and score watching keep teams stuck because they mask the “why.” You need full‑coverage metrics plus traceable quotes to move from plausible to provable. When every chart opens to the tickets behind it, debates shrink and decisions speed up. Example: negative sentiment spikes tied to “Billing” with three representative quotes.

What Happens When Dashboards Meet Anecdotes?
When dashboards meet anecdotes, trust fractures. Charts show direction; anecdotes show texture. Alone, neither survives the first “Show me.” Together—if linked—they create momentum. The missing link is traceability. If you can pivot a metric and immediately open the tickets, the room shifts from skepticism to action.
We see the same pattern across CX programs. A leader points at a volume spike; someone else counters with a handful of painful tickets. Both are “right,” neither is sufficient. Evidence is the bridge. You want the chart to say “Onboarding friction up 22%,” and the next click to reveal the exact quotes that make leaders nod. Broad benchmarks remind us why this matters—expectations are high and rising, as shown in SuperOffice’s customer experience statistics.
Why Should Leaders Demand 100 Percent Coverage?
Leaders should demand 100% coverage because partial views breed bad calls. Sampling trades speed for confidence, and that’s a terrible trade when churn risk, escalations, and roadmap priority are on the line. With full coverage, patterns stabilize. Blind spots shrink. You stop arguing representativeness and start sequencing fixes.
It’s usually the quiet patterns that sampling misses—onboarding hiccups, policy friction, subtle UX regressions. Those are the ones that compound if ignored. Full‑population analysis takes the guesswork out of segmentation too. You can slice by tier, product area, or timeframe without worrying whether the cohort is thin or skewed. That’s how you turn “We think” into “Here’s what to fix first.”
Ready to skip the sampling wars and see the workflow in one place? Take a look at a working example and See How Revelir AI Works.
The Real Bottleneck Is Unstructured Conversations, Not A Lack Of Data
The real bottleneck isn’t data; it’s unstructured conversations. Surveys, manual reviews, and BI dashboards each solve part of the problem. None reliably convert raw text into decision‑ready metrics at scale. The fix is an analysis layer that turns transcripts into tags, drivers, and AI metrics you can filter, group, and validate.

What Traditional Approaches Miss
Surveys give you standardized scores. Manual reviews give you nuance. Dashboards give you roll‑ups—once the data is structured. But support conversations don’t arrive as clean fields. They show up as messy text full of frustration signals, workarounds, and hints at churn. Without a way to structure that text reliably, your reporting tops out at volume and CSAT.
This is where teams typically stall. They run ad‑hoc analyses, patch together spreadsheets, and still end up debating the sample. Or they lean on a sentiment widget and get a “down 8%” headline with no drivers attached. You don’t need more sources; you need a conversion layer from words to metrics that leadership recognizes and trusts.
How You Turn Unstructured Text Into Decisions
Start by structuring. Let AI generate raw tags for discovery, then map those into a compact set of canonical tags and drivers that make sense to leadership and product. Add AI metrics—sentiment, churn risk, customer effort—plus one or two custom business metrics. Now you can filter, group, and drill down with speed.
What changes in practice? You can answer real questions quickly: “What drove negative sentiment last month?” “Which drivers show the highest density of churn risk among enterprise accounts?” And you can validate in minutes by opening the underlying tickets. Instead of shipping generic fixes, the work gets sharper because the evidence is specific.
The Hidden Costs You Pay With Manual Reviews And Black-Box Metrics
Manual reviews and black‑box metrics quietly drain time, money, and credibility. Sampling costs hours and still misses signals. Score‑only tools create direction without drivers. And when no one can click to see the quotes, stakeholders hesitate. The compounding effect is delayed fixes, escalations, and rework.
Let’s Pretend You Sample Ten Percent
Let’s pretend you handle 1,000 tickets a month. You sample ten percent at three minutes each. That’s five hours for a partial view that can miss churn signals. To review everything at that pace would take 50 hours—time no team has. Meanwhile, sentiment dipped and nobody can explain why beyond a hunch.
Those lost weeks translate into churn, escalations, and frustrating rework. Engineering ships band‑aids based on thin evidence. CX runs a generic apology campaign. Nothing moves the number because the root cause wasn’t clear. It’s not that the team is lazy. It’s that the method is slow and biased. The result is expensive drift.
What A Quarter Of Delay Really Costs
A quarter of delayed fixes compounds across the business. Missed early signals become escalations. Escalations crowd the backlog. Backlog pressure creates burnout. Burnout hurts quality. Quality issues generate more volume—and around we go. If even a small cohort of top‑tier accounts churns, you’ve just erased the budget for the improvements you needed.
Here’s a sobering angle: better customer experience correlates with measurable revenue impacts, as documented in Harvard Business Review’s analysis of CX value. You don’t need perfection; you need trustworthy, auditable signals that move discussion time into decision time. That’s the margin that buys you quarters back.
Still measuring CX by reading tea leaves? There’s a faster way to get credible answers. See the full workflow and Learn More.
When You Need Proof, Not Opinions
You need proof when the stakes are high and time is tight. Proof looks like grouped metrics tied to the exact tickets and quotes behind them. With that, you can calm incidents, brief leadership, and point product to the right fix without a week of back‑and‑forth. Example: isolating “account access” for enterprise customers with three quotes that tell the story.
The 3 A.M. Incident No One Saw Coming
An outage hits. Social pings light up. You don’t need a retrospective tomorrow; you need clarity now. With full coverage and grouped views, you isolate the driver, pivot by customer tier, and pull representative quotes for leadership in minutes. The room calms because the numbers and the words align.
We’ve all sat in the fire drill where opinions fly and time slips away. The teams that move faster aren’t guessing better; they’re looking at a complete, structured dataset and jumping straight into the conversations that matter. That’s how you separate noise from signal under pressure and avoid wasting an entire morning on speculation.
How Do You Move The Room From Debate To Decision?
Bring a one‑two punch. First, a grouped view that quantifies drivers by severity and volume. Second, a tight set of representative quotes linked from that view. Decisions accelerate when the numbers and the narrative point to the same place—and when anyone can click to audit the examples.
Nobody’s checking their belief at the door without evidence. When you can say “Billing drives 34% of negative sentiment among new customers” and open three tickets that read like the summary, resistance drops. You’re not asking for trust; you’re showing your work. That changes the tone of the meeting.
The Workflow: From Tickets To Decisions In 7 Steps
A reliable workflow turns messy text into decisions you can defend. Define the decisions and KPIs first, then ingest, structure, analyze, validate, and operationalize. Each step builds confidence and speed. Example: standard views you reuse monthly and drill‑downs you can open in seconds with quotes ready for leadership.
Step 1: Define Decisions, KPIs, And Evidence You Need
Start with the decision you must support and what leadership counts as evidence. If the KPI moves, what will change? Which quotes would make the problem vivid? Write that acceptance criteria down. Align with product, CX, and success on the questions that matter so your analysis targets decisions, not trivia.
Then get specific. “What’s driving negative sentiment among new accounts?” “Which drivers carry the highest churn risk in enterprise?” These become your first saved views and grouped analyses. You’re not just reporting numbers—you’re generating the evidence you’ll need to move work onto the roadmap responsibly.
Step 2: Ingest And Normalize Conversations With A Field Mapping Checklist
Decide whether you’ll connect Zendesk for ongoing sync or start with a CSV for a fast pilot. Confirm required fields: ticket ID, created date, transcript, requester, existing tags, and any business metadata you plan to filter on. Load the data and sanity check counts, date ranges, and a quick sentiment overview.
It sounds basic, but correctness here saves you headaches later. If the time window is off or a transcript column is blank, everything downstream wobbles. Clean in, clean out. Once it’s flowing, new or updated tickets can be ingested continuously so your dataset stays current without manual exports.
Step 3: Configure Hybrid Tagging And Map Raw To Canonical
Let AI generate raw tags first. That’s your discovery layer—high‑resolution signals you wouldn’t think to catalog manually. Then map those raw tags into a compact set of canonical tags and drivers leadership recognizes. Consolidate duplicates. Align names with your internal language so reporting reads naturally.
Now audit counts by tag and driver. Are you gaining clarity without losing useful detail? If a canonical tag is a catch‑all, split it. If you’ve got ten variants of the same thing, merge them. Over time, the system should learn these mappings so future tickets roll up cleanly and dashboards stay trustworthy.
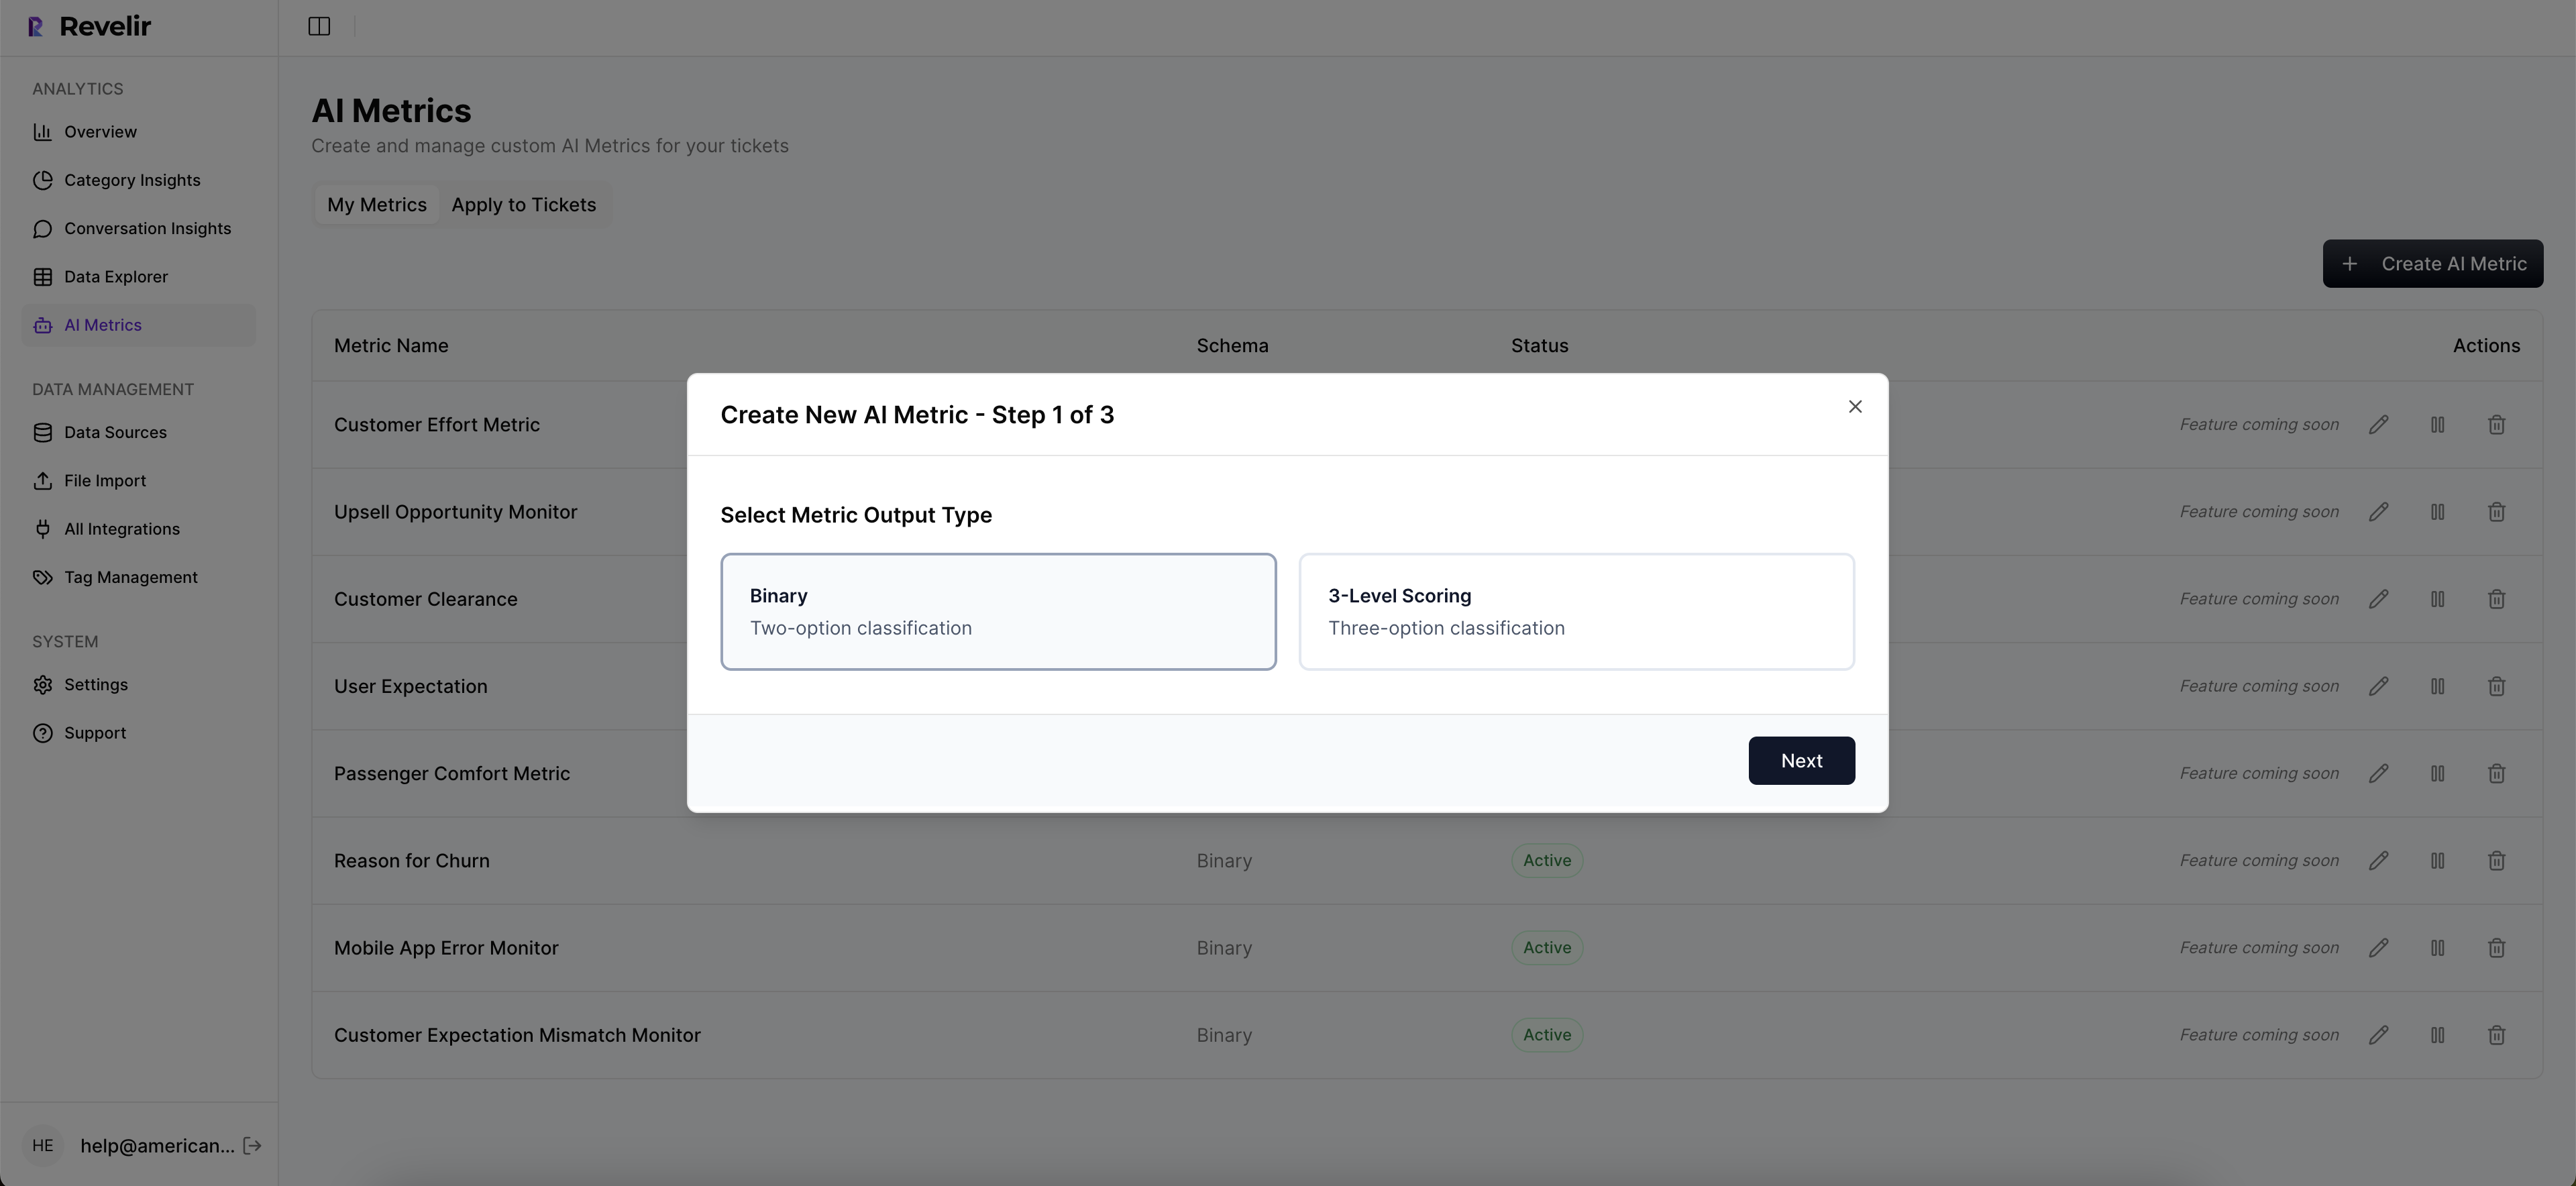
Step 4: Enable Core AI Metrics And Define One Or Two Custom Metrics
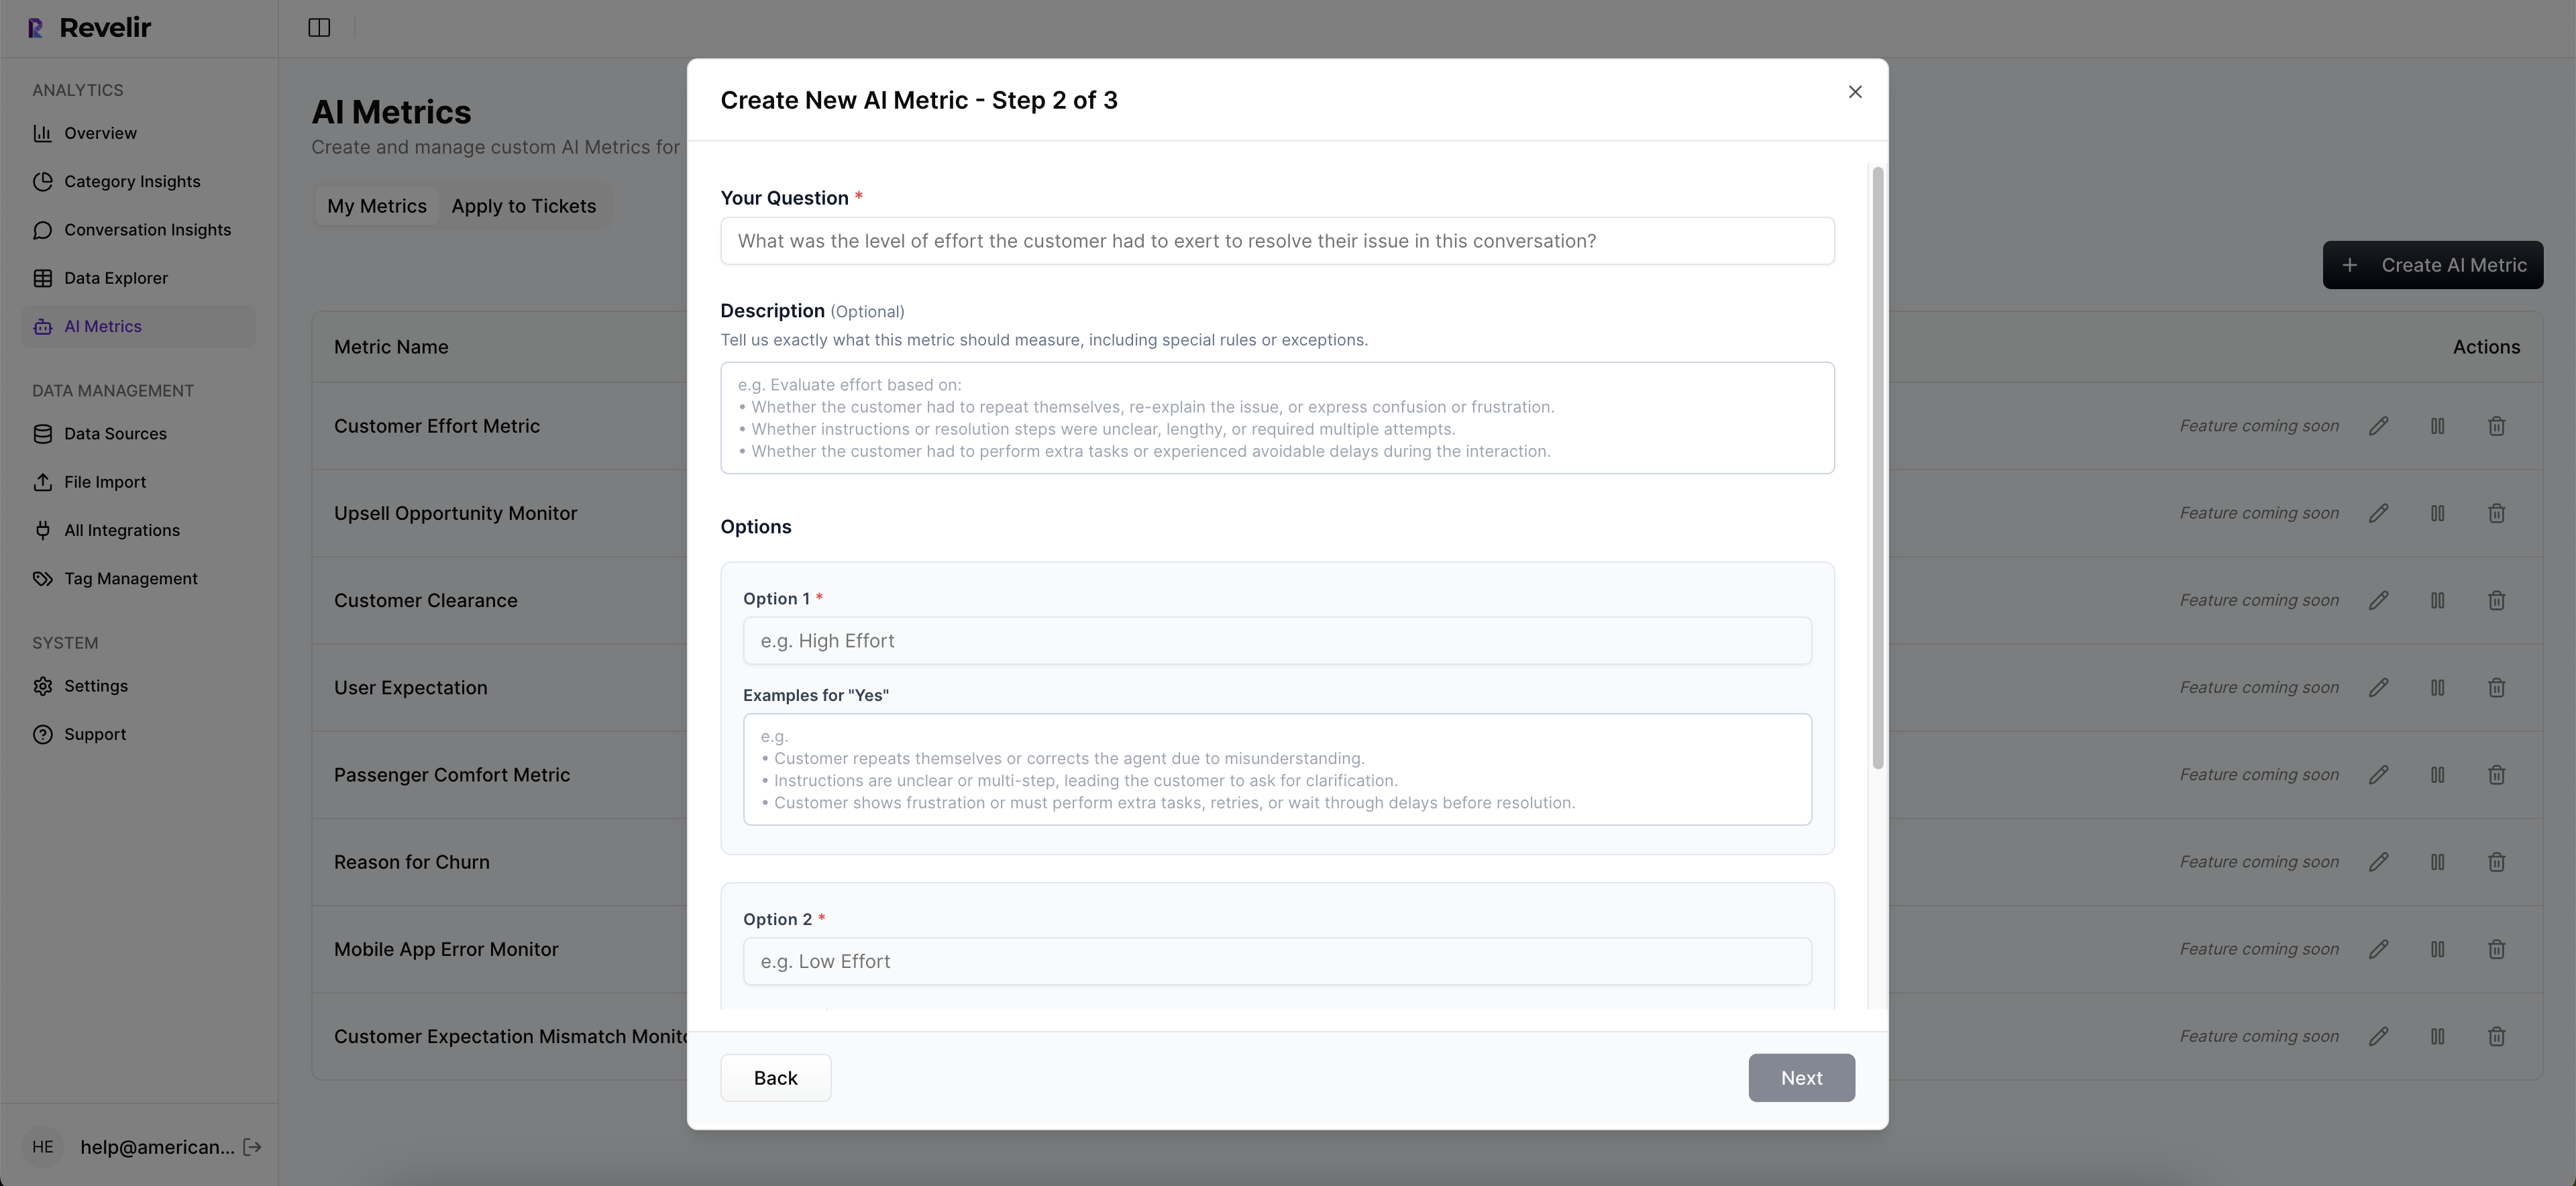
Turn on sentiment, churn risk, and customer effort (when there’s enough back‑and‑forth to support it). Then define one or two custom metrics that reflect your business language—reason for churn, upsell opportunity, expectation mismatch. Be explicit: question, allowed values, and how edge cases should behave.
You’re aiming for a “makes sense” accuracy threshold, not perfection. If you read a handful of tickets and the metrics align with what a human would say, you’re there. Document expectations with a few example tickets per value so reviewers calibrate the same way and your stakeholders trust the outcome.
Step 5: Build Repeatable Data Explorer Views And Analyze Data Workflows
Create saved views for your top questions. Examples: negative sentiment by driver in the last 30 days; churn risk by canonical tag for enterprise accounts; high effort by driver. Use grouped analyses to quantify patterns and interactivity to click into segments for validation.
Consistency matters. Document the filters, grouping, and columns used in your recurring reviews. The goal is to cut analysis time and eliminate “how did you get that number?” conversations. When patterns shift, you’ll know whether it’s real or a filter change, and you’ll be able to show the evidence either way.
Step 6: Validate With Conversation Insights And Set Acceptance Criteria
Adopt a lightweight human check for high‑impact segments. Sample five to ten tickets and confirm the tags and metrics make sense. Note edge cases and refine taxonomy or definitions where needed. Define your acceptance threshold—e.g., reviewer agreement and coherence between grouped results and examples.
Validation is where trust is earned. You’re not looking for gotchas; you’re looking for consistency that holds up in the room. When you can open a segment and the first few tickets feel like the summary, you can move forward confidently and spend your time on decisions, not arguments.
Step 7: Operationalize Exports, Ownership, And Quarterly Taxonomy Review
Assign owners for tags and custom metrics. Document saved views and who runs them. Schedule a quarterly taxonomy review to merge duplicates, add new themes, and retire stale categories. Use the API export to feed your BI stack so leadership sees the same metrics where they already look.
Close the loop with a leadership‑ready view that pairs grouped metrics with two or three representative quotes. When decision‑makers can see volume, severity, and the words customers used—without a scavenger hunt—you’ll skip a week of defensive meetings and fund the fix faster.
How Revelir AI Automates The Workflow End To End
Revelir AI turns raw support conversations into evidence‑backed metrics with full coverage and traceability. It ingests tickets, structures them with raw and canonical tags plus drivers, applies AI metrics (including custom ones), and gives you a pivot‑table‑like workspace with drill‑downs to the exact conversations and quotes behind every chart.

Revelir AI starts with ingestion. Connect Zendesk for ongoing sync or upload CSVs for a fast pilot. Either way, every ticket is processed—no sampling—so patterns stabilize and early signals aren’t missed. You get a current, complete dataset without manual exports, which matters when leadership asks for the latest picture at 9 a.m.
Then comes the hybrid tagging system. Revelir AI generates raw tags for discovery and lets you map them into canonical tags and drivers that leadership understands. Over time, those mappings are remembered, so reports get cleaner while you retain the ability to spot new, emerging issues. That’s structure without losing nuance.
In the analysis layer, Data Explorer and Analyze Data do the heavy lifting. Filter by sentiment, churn risk, effort, drivers, and your custom AI metrics. Run grouped analyses to quantify patterns, then click straight into Conversation Insights to validate with transcripts and AI summaries. This is how you move from question to answer—then to examples—in minutes, not days.
Evidence is built‑in. Every metric and chart links back to the exact tickets and quotes that generated it. When someone asks “Show me,” you can. That’s how Revelir AI unwinds the trust issues that sink black‑box tools and replaces sampling debates with action.
Custom AI metrics let you quantify your language—reason for churn, upsell opportunity, expectation mismatch—without building classifiers from scratch. And when you need to share broadly, you can export metrics via API to feed your BI dashboards, keeping executives aligned to the same, verifiable measurement layer.
If your current state looks like sampling, stitched spreadsheets, and slow decisions, this is the lift. Fewer blind spots, faster validation, and metrics that hold up under scrutiny. Want the short path from transcript to decision? Get Started With Revelir AI. Curious first? See How Revelir AI Works.
Conclusion
Sampling and score‑watching feel responsible until they don’t. The moment someone asks “Why should we fund this over roadmap work?”, plausible isn’t enough—you need proof. Full‑coverage metrics with traceable evidence move you from anecdotes to action. Structure the text, validate quickly, and make the examples visible. Do that, and your CX program stops reporting and starts deciding.
Frequently Asked Questions
How do I connect Revelir AI to my helpdesk?
To connect Revelir AI to your helpdesk, start by selecting the integration option in your Revelir dashboard. If you're using Zendesk, simply follow the prompts to authenticate your account. Once connected, Revelir will automatically ingest your historical tickets and ongoing updates, ensuring you have the latest data for analysis. If you prefer, you can also upload a CSV file of your tickets as an alternative method. This setup allows Revelir to process 100% of your conversations, providing you with comprehensive insights without manual effort.
What if I want to create custom metrics in Revelir AI?
You can create custom metrics in Revelir AI by going to the metrics configuration section. Here, you can define metrics that reflect your specific business needs, such as 'Upsell Opportunity' or 'Reason for Churn.' After defining these metrics, Revelir will apply them consistently across your dataset, allowing you to analyze conversations with your unique context in mind. This flexibility helps ensure that the insights you gather are directly relevant to your team's objectives.
When should I validate insights from Revelir AI?
You should validate insights from Revelir AI whenever you notice significant trends or anomalies in your data. For example, if you see a spike in negative sentiment tied to a specific driver, it's a good practice to drill down into the Conversation Insights feature. This allows you to review the actual tickets and ensure that the AI-generated metrics align with the context of the conversations. Regular validation helps maintain trust in the insights and ensures that your decisions are based on accurate information.
Can I filter tickets by customer segments in Revelir AI?
Yes, you can filter tickets by customer segments in Revelir AI using the Data Explorer feature. Simply apply filters based on customer attributes, such as plan type or account status. This allows you to analyze specific segments, like your high-value customers, and identify any unique issues they may be facing. By isolating these segments, you can gain deeper insights into their experiences and tailor your support strategies accordingly.
Why does Revelir AI emphasize evidence-backed metrics?
Revelir AI emphasizes evidence-backed metrics because they provide a reliable foundation for decision-making. By processing 100% of your support conversations, Revelir eliminates the biases that come from sampling. Each metric is traceable to the original conversations, allowing teams to validate findings with real quotes. This transparency fosters trust among stakeholders and enables faster, more informed decisions based on concrete evidence rather than anecdotal reports.