

Most teams can rattle off CSAT and NPS. Fewer can back a roadmap decision with the exact tickets and quotes that caused the number to move. That’s the gap. Score tiles tell you something’s wrong. Evidence-backed metrics tell you what to fix first — and why it will matter.
If you’re tired of meetings where everyone argues about anecdotes, you’re not alone. It’s usually the same story: a spike hits, people skim a handful of tickets, confidence wobbles, and priorities stall. The fix isn’t more dashboards. It’s turning every conversation into traceable, fix-ready metrics your product team trusts on sight.
Key Takeaways:
- Prioritize with four fields: volume, negative sentiment rate, high-effort rate, churn-risk rate
- Stop sampling; process 100% of tickets so patterns hold up in the room
- Use a hybrid tagging system (raw tags → canonical tags → drivers) for clarity and discovery
- Tie every chart to the exact tickets and quotes that produced it
- Validate quickly: click from grouped metrics straight into transcripts to confirm fit
- Shift meeting time from speculation to scoping the fix and measuring the impact
Why Score Tiles Without Evidence Keep Teams Spinning
Score tiles without traceability keep teams stuck because they don’t explain what’s driving pain or how to fix it. The solution is evidence-backed metrics that connect every chart to the exact tickets and quotes. This approach reduces debate and accelerates product decisions; think “Billing policy confusion caused 34% of negative sentiment” with three verified quotes.
The Metrics That Actually Matter For Prioritization
Most score tiles are nice to glance at and useless to act on. What moves a roadmap are four fields, computed per issue: volume, negative sentiment rate, high-effort rate, and churn-risk rate. Those fields point to severity and scale. They turn “customers are frustrated” into “this driver is both frequent and painful.”
When each metric rolls up from 100% of conversations — not a sample — you get a defensible view you can pivot by driver, segment, or time window. The conversation changes. We’re not debating taste or anecdotes; we’re confirming a pattern and deciding what to fix. One caveat: if you can’t trace a metric to the exact tickets and quotes, it shouldn’t drive priority. That’s where teams get burned.
Tie these fields to the stories your leadership needs to hear. If a driver is small but spiky in churn risk among enterprise accounts, it might outrank a higher-volume annoyance. If negative sentiment drops after a fix, you should see it at the driver level — not just a generic CSAT bump. The four fields make that nuance obvious.
Why Sampling And CSAT Tiles Stall Product Decisions
Sampling looks responsible on paper and slippery in practice. You get partial truth and endless debates about representativeness. CSAT tiles flag dissatisfaction but hide the “why,” so teams default to generic answers — more help docs, more training — instead of addressing root causes. Now you’re working hard without moving the needle.
Full-population processing flips the workflow. You pivot by driver, segment, or timeframe with statistical confidence, then click into the exact conversations to validate. Meetings shrink from “do we trust this?” to “what’s the scope and timeline?” That’s how you collapse decision cycles from weeks to days. And when patterns shift next week, you’ll see it quickly, not in next quarter’s survey.
If you want a quick external check, look at Gainsight’s 2025 guide to CX metrics. The theme is consistent: scores are inputs, not answers. The answer is the driver-level story backed by real customer words.
What Is Evidence-Backed CX And Why Now?
Evidence-backed CX means every chart can be traced to the tickets and quotes that produced it. Not “we think,” but “here’s the pattern, here are the examples.” Transparency turns contested metrics into shared reality. It also lowers the cost of alignment with finance and product because anyone can audit a claim in two clicks.
Why now? Ticket volumes keep climbing, and expectations are higher. Sampling and survey-only programs introduce risk you can’t absorb — missed churn signals, slow fixes, frustrating rework. Evidence-backed methods use full coverage and traceability to shrink uncertainty. And yes, tools like Revelir AI make that bar achievable without a six-month data project.
Ready to see the method applied to your data? Teams prefer a quick look over theory. See how Revelir AI works.
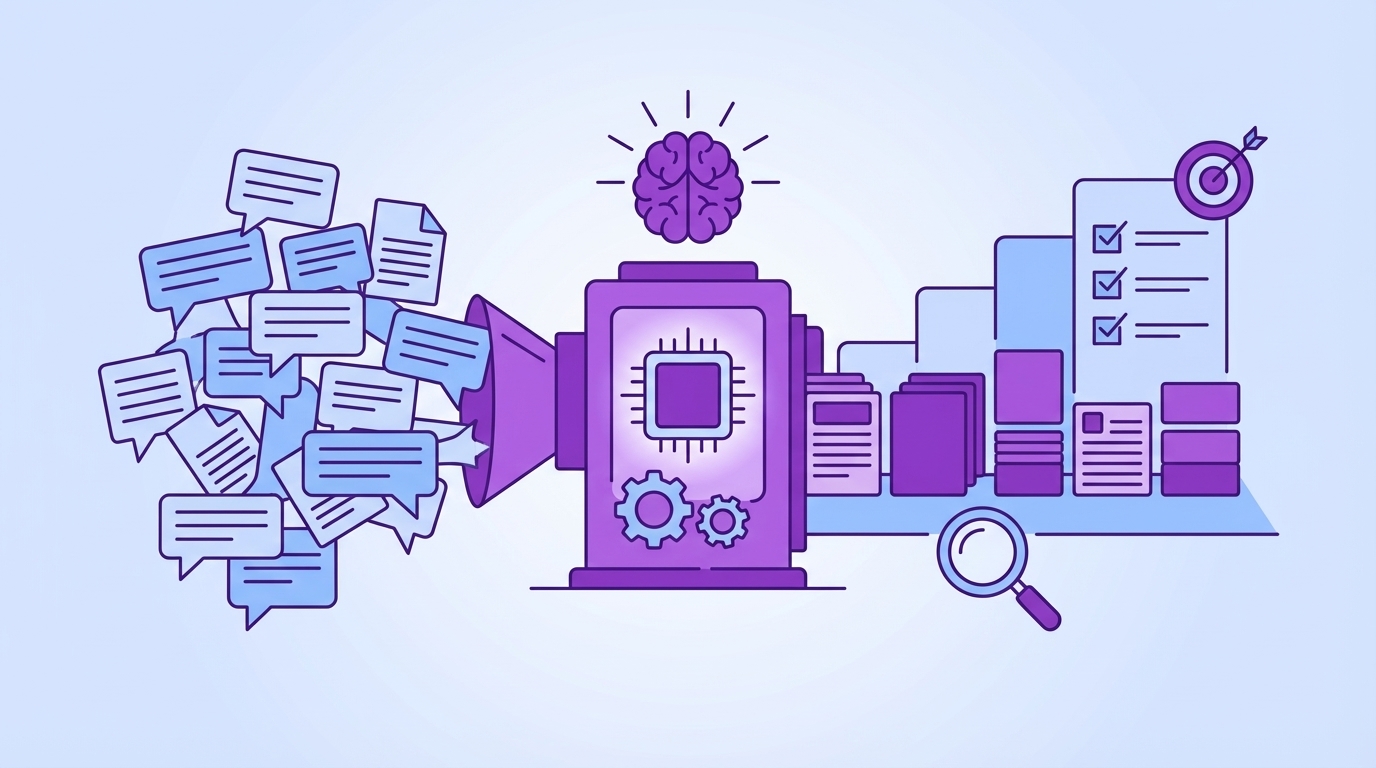
The Real Bottleneck Is Unstructured Support Data
The bottleneck isn’t a lack of data; it’s that conversation text isn’t structured for analysis or trust. You need a layer that converts transcripts into raw tags, canonical tags, drivers, and metrics you can pivot — then links findings to the source tickets. Without that, BI dashboards visualize guesses.

What Traditional Approaches Miss In The Ticket Queue
Manual reviews catch nuance but crumble at volume. You can read ten tickets well; you can’t read ten thousand without bias and delay. Surveys normalize scores across cohorts, but unsolicited product feedback lives in the transcript, not a radio button. Basic sentiment tools label tone and stop short of “what to fix.”
What’s missing is the structured layer between messy text and the dashboards people trust. It should capture a high-resolution view (raw tags), a business-ready summary (canonical tags), and an executive lens (drivers). And it should compute core metrics per ticket so you can move from anecdotes to patterns in minutes, not weeks.
Even the best BI stack needs structured inputs. If your tickets aren’t translated into consistent fields, you’re left with exports, VLOOKUPs, and a lot of “we think.” This is where the breakdown usually begins — not in the dashboard, in the data layer. As Hanover Research notes on measuring CX, reliable metrics flow from reliable definitions and data hygiene.
The Hidden Complexity Of Tags, Drivers, And Trust
Helpdesk tags drift. Teams add new ones during incidents, forget to retire old ones, and end up with a thicket that undermines reporting. The practical fix is a hybrid: let AI generate granular raw tags for discovery, then map them to a small set of canonical tags you actually use in leadership conversations. Roll those canonicals into drivers like Billing, Onboarding, and Performance.
This isn’t just taxonomy hygiene. It’s how you maintain trust. If a VP asks “show me where this came from,” you should click from a driver-level metric to the exact tickets and quotes in seconds. No copy-paste doc, no cherry-picking. No traceability, no buy-in. With it, tough findings survive scrutiny, and priorities move.
Nobody’s checking every tag every day. That’s the point. The system should learn your mappings over time and reduce redundancy, not explode it. Keep the top-level categories stable and let the raw tags adapt as customer language changes. You want discovery without chaos and reporting without drift.
How Do You Turn Free Text Into Decisions?
You build a repeatable pipeline. Ingest transcripts plus key metadata (account, plan, timestamps, channel). Generate granular raw tags, map them to canonical tags, and associate them with drivers. Compute sentiment, effort, and churn risk per ticket, plus a small set of custom business metrics. Now you can group, compare, and validate.
Validation is where decisions get unlocked. Click from an aggregate into the slice, skim summaries, and pull two or three representative quotes. If the examples match the pattern, you have a decision; if not, refine mappings or metrics. Then prioritize with a simple scoring model that blends volume and severity, ship the fix, and watch the metrics move.
The goal isn’t a perfect taxonomy on day one. It’s a system that creates clarity fast, survives executive questions, and gets smarter as you learn. Iteration beats over-engineering.
The Costs You Pay When Insight Arrives Late Or Biased
Delayed or biased insight drains time, budget, and credibility. Manual sampling eats hours, misses signals, and breeds debate. The downstream effect is rework: wrong fixes, growing escalations, and burnout. Quantify the waste, and the cost of a proper metrics layer looks small in comparison.
The Time Sink Of Sampling And Manual Tagging
Let’s put numbers on it. Sampling 10% of 1,000 monthly tickets at three minutes per ticket burns five hours for a partial view. Reviewing 100% would cost 50 hours — time no team has. Meanwhile, manual tags drift, and you spend more cycles wrangling definitions than solving problems.
That partial view invites argument. Is the sample representative? Did we miss quiet but important patterns? Instead of deciding, you’re defending. Multiply that by every spike, and it’s a constant tax on your team. And when assumptions collapse, you get frustrating rework — edits, rebriefs, and delayed fixes nobody has patience for.
Same thing with sentiment-only dashboards. You see the red, but not the reason. Teams chase symptomatic projects — another article, a training refresh — while core product issues linger. Hours go by, metrics don’t move, trust erodes. This is exactly the loop evidence-backed metrics are meant to break.
The Cascading Impact On Churn And Escalations
Let’s pretend a subtle onboarding issue hides for six weeks. Negative sentiment climbs among new accounts. High-effort tickets increase. Churn-risk flags show up in renewal conversations. Product context decays as agents copy/paste workarounds, and backlog grows with escalations.
Now your CSMs are reactive, engineering is firefighting, and leadership is worried about surprises at quarter-end. When you finally find the driver, it’s late — and the fix competes with roadmap commitments. Early detection from full-population metrics de-risks this cascade. You spot it, scope it, fix it, then verify improvement quickly.
If you need the macro reminder: customers churn on experience as much as price. The cost of getting it wrong compounds. See SuperOffice’s round-up of CX statistics for the big-picture stakes.
What Does Rework Cost A 1,000-Ticket Team?
Assume a missed driver triggers two sprints of the wrong work. Eight engineers, two weeks each, at 40 hours per week — that’s 640 hours redirected. Add CX time triaging escalations and leadership cycles spent re-justifying priorities. Even at conservative internal rates, you’ve burned a material budget line.
Compare that to the setup cost of a complete, traceable metrics layer. Ingest the tickets, apply standardized metrics, and establish a click-through validation workflow. The first week you avert a mis-prioritization pays for the effort. The second week you avoid a noisy debate is a bonus. This isn’t theoretical; it’s operational math.
Teams don’t regret structuring their data. They regret waiting until after a miss.
When Trust Breaks, Priorities Stall
Priorities stall when people don’t trust the numbers or can’t see the story behind them. The fix is transparency: charts that click straight into the exact tickets and quotes. That’s how you move the room from “prove it” to “ship it.”
The 3pm Roadmap Review That Goes Sideways
You present a trend. Someone asks for examples. You scramble for screenshots and cherry-picked quotes. Trust erodes, and the prioritization slot you needed evaporates. We’ve all been there.
Now imagine you open a driver-level chart, click the number, and show three representative quotes from the last 14 days. The language matches the driver name. The summaries line up with the metric. Heads nod. The discussion shifts to effort and timeline, not credibility. That’s the difference traceability makes.
If you’re relying on a stitched-together doc, you’re always one “show me where this came from” away from losing the room. Evidence-backed workflows change the tone entirely.
What Happens When The Room Asks, “Show Me Where This Came From?”
If there’s no direct line from metric to transcript, the conversation stalls. People want to see reality, not a proxy. With traceable metrics, you click into a filtered set, scan summaries, and surface two or three quotes that describe the issue in the customers’ words.
Agreement forms quickly. It’s not that friction disappears — prioritization is still trade-offs — but you’re arguing about scope, not source. For broader context on moving beyond score worship, see Medallia’s perspective on evolving past NPS-only thinking. The pattern holds: story plus evidence accelerates decisions.
The Operational Playbook For Evidence-Backed CX Metrics
An operational playbook turns principles into muscle memory. In practice, you ingest everything, create a hybrid tagging system, compute core metrics, and validate by clicking from aggregates to transcripts. That’s it. Simple on paper, durable in a busy week.
Tag Precisely, Then Map To Canonical Tags And Drivers
Start with AI-generated raw tags to capture the messy, granular language of customers. Don’t present raw tags to leadership; use them for discovery. Group similar raw tags into a small set of canonical tags that reflect your business language. Then roll those canonicals into drivers like Billing, Onboarding, and Performance.
Over time, the system learns your mappings. You’ll see cleaner categories, fewer duplicates, and more stable reporting. When a new pattern appears — say, confusion around trial extensions — you can discover it via raw tags and quickly fold it into an existing canonical tag and driver. Discovery without chaos; clarity without stagnation.
A small tip: refresh mappings monthly. Use a short review to merge near-duplicates and retire obsolete tags. It keeps your analysis sharp without adding overhead.
Metricize Sentiment, Effort, Churn Risk, And Custom Signals
Compute sentiment for every ticket — not because a score is the answer, but because it helps quantify severity. Add Customer Effort and Churn Risk to capture the operational and revenue implications. Keep custom AI metrics tight: one or two that mirror your language, like “Reason for Churn” or “Expectation Mismatch.”
The goal is a balanced view. Volume tells you where issues cluster. Negative sentiment and high effort tell you which issues feel worst. Churn-risk flags tell you where revenue is at stake. Combine them, and you can rank fixes credibly across segments. After you ship, you should see those metrics move in the affected drivers.
Use a simple rating to start. If needed, layer a weighting model with stakeholders so everyone understands the trade-offs. Clear math beats loud opinions.
How Revelir AI Automates Evidence-Backed Prioritization
Revelir AI converts 100% of your support conversations into structured, traceable metrics you can trust. It handles the heavy lift — full coverage, hybrid tagging, and per-ticket metrics — then gives you fast pivots and one-click validation. The outcome is fewer debates, faster fixes, and measurable impact where it counts.
Full-Coverage Processing With Raw And Canonical Tags Mapped To Drivers
Revelir AI processes every ingested ticket — no sampling — and generates granular raw tags for discovery. You map these raw tags into canonical categories and associate them with higher-level drivers like Billing or Onboarding. As mappings stabilize, Revelir AI remembers them, so future tickets roll up cleanly without manual rework.

The benefit is complete visibility with a taxonomy that evolves as customer language shifts. This eliminates blind spots that create late discoveries, rework, and those 3pm “we missed it” moments. It’s how you avoid the 50-hour review problem and the 640-hour rework bill that show up when insight arrives late.
Data Explorer And Conversation Insights For Fast, Traceable Validation
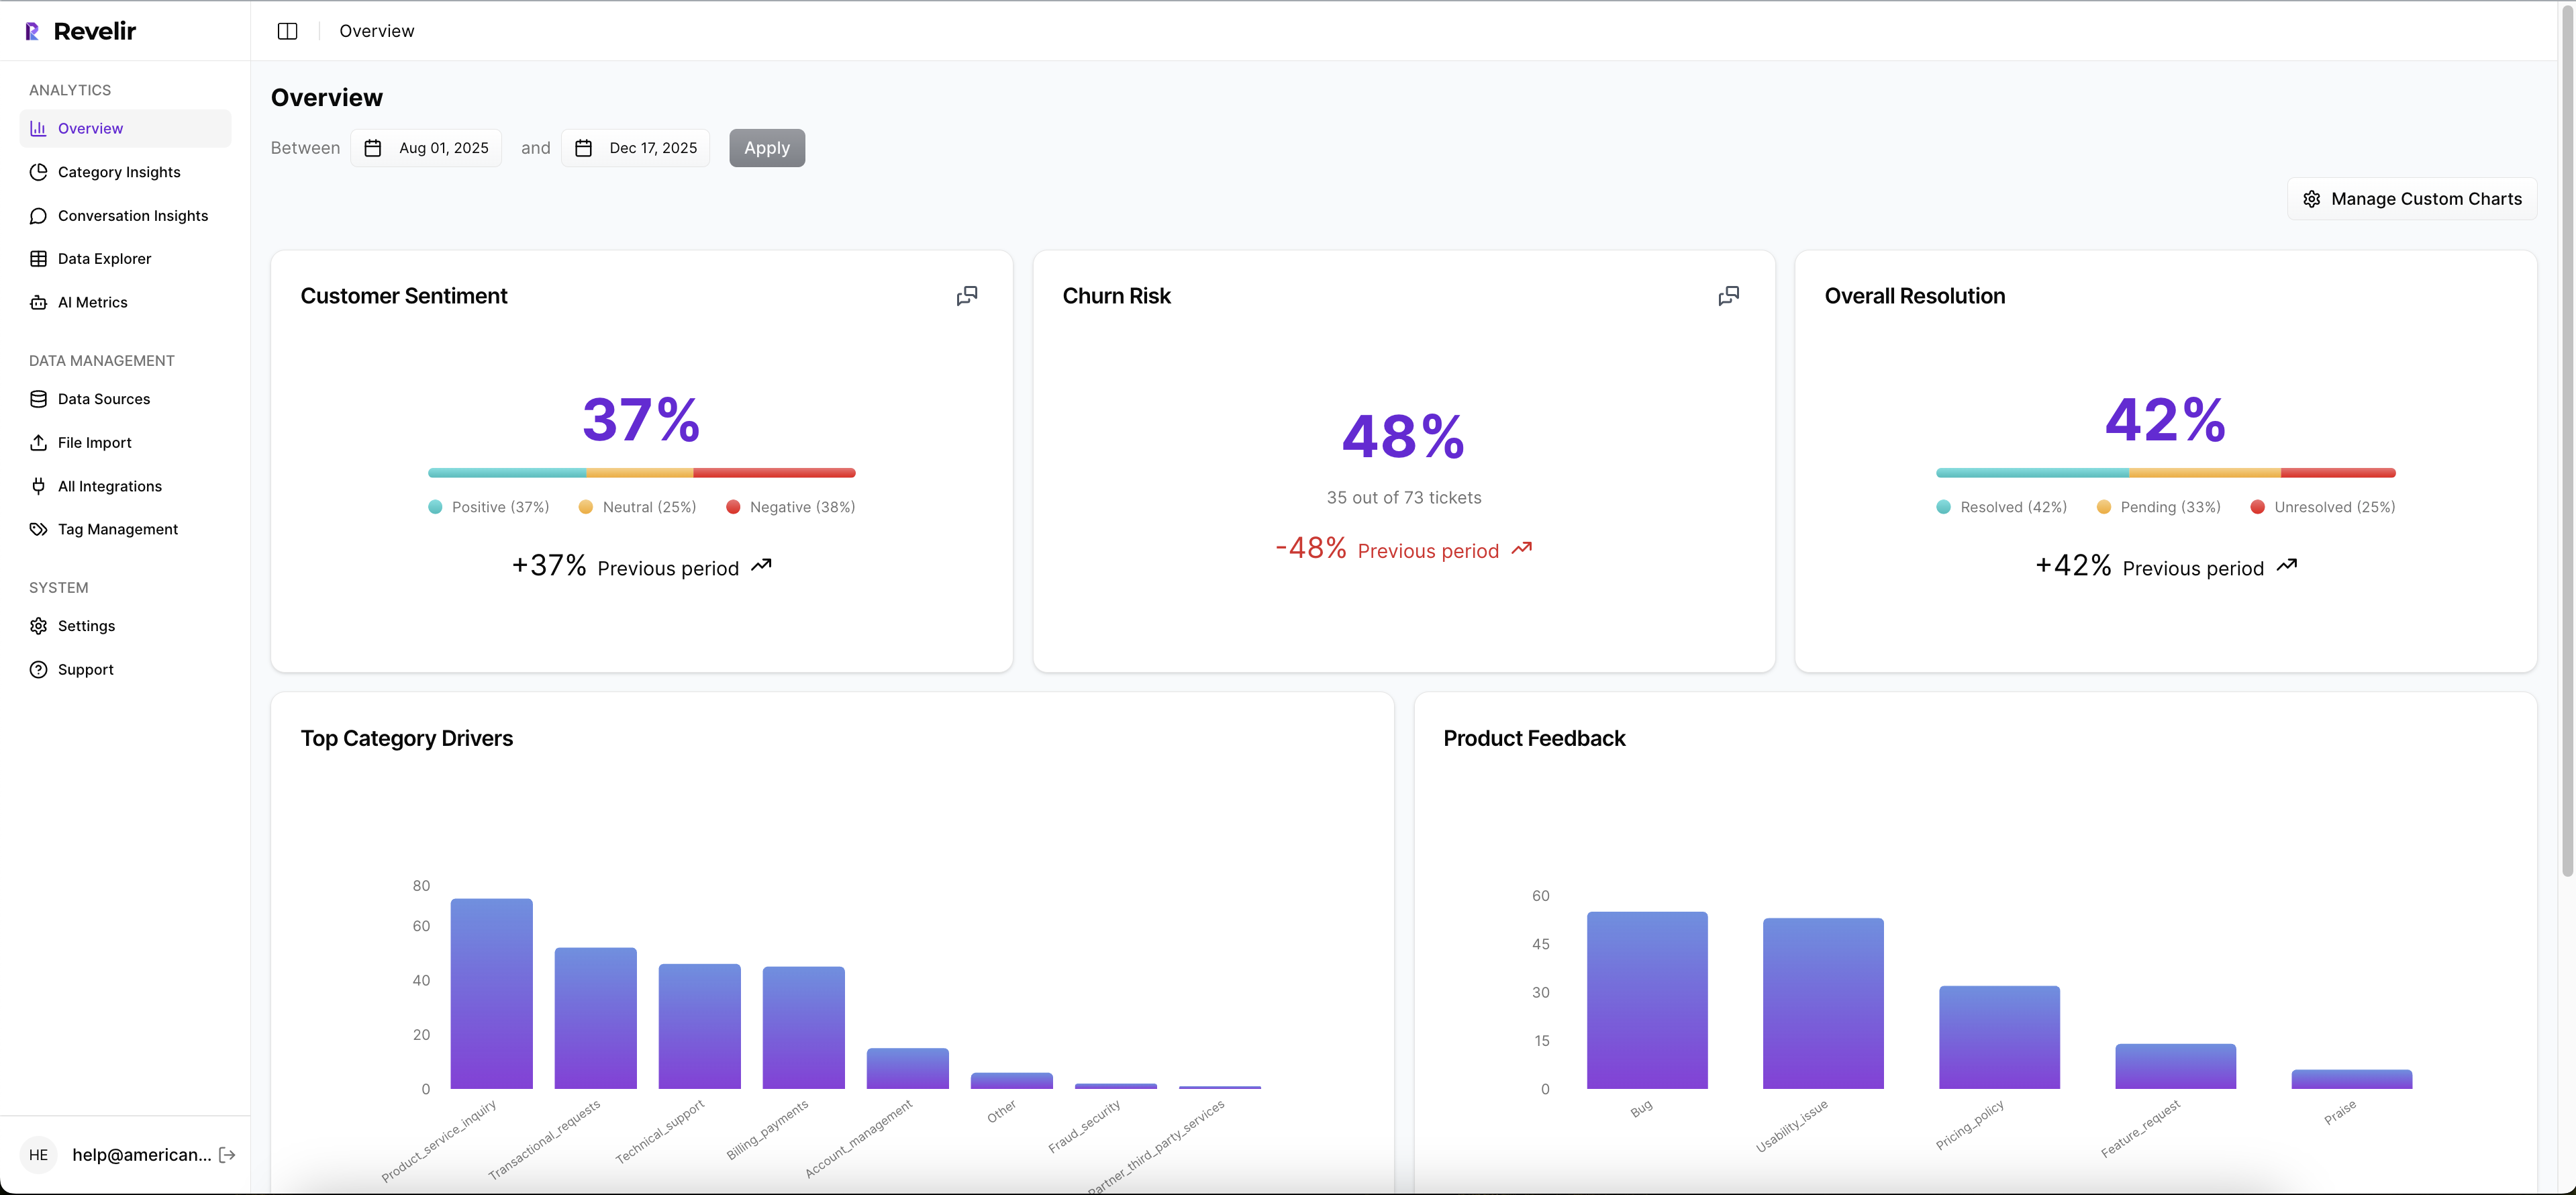
Day to day, you work in Data Explorer — a pivot-table-like workspace built for tickets. Filter by sentiment, churn risk, drivers, or segments; add columns; and run grouped views in minutes. From any metric or slice, click straight into Conversation Insights to see transcripts, summaries, and the exact metrics per ticket.

This is where Revelir AI earns trust. Every chart ties to the evidence. CX leaders can pull representative quotes for product in seconds. Product managers can verify a driver before adding it to the backlog. The loop from “pattern” to “proof” is one or two clicks — which cuts meeting time and accelerates decisions materially.
If you want to see that flow on your own data, it’s quick to try. Connect a helpdesk or upload a CSV, and you’ll get verifiable insights in minutes. Learn More
Conclusion
You don’t need more dashboards. You need metrics that stand up in the room. When 100% of tickets become traceable, fix-ready signals — volume, negative sentiment rate, high-effort rate, churn-risk rate — you stop arguing and start prioritizing. Build the hybrid tagging layer, validate by clicking into transcripts, and let the evidence lead the roadmap. Revelir AI makes that workflow the default.
Frequently Asked Questions
How do I connect Revelir AI to my helpdesk?
To connect Revelir AI to your helpdesk, start by selecting the integration option in your Revelir dashboard. You can choose to connect directly to platforms like Zendesk or upload a CSV file of your past tickets. If you're using Zendesk, follow the prompts to authenticate your account, and Revelir will automatically pull in your ticket data. This process allows you to begin analyzing your support conversations and generating insights quickly, often within minutes.
What if I want to customize metrics in Revelir AI?
You can easily customize metrics in Revelir AI by defining your own AI Metrics that reflect your business language. Navigate to the settings section where you can create metrics like 'Customer Effort' or 'Reason for Churn.' This flexibility allows you to tailor the insights to your specific needs, ensuring that the metrics generated align with what matters most to your organization. Once set up, these custom metrics will appear in your Data Explorer for analysis.
Can I validate insights from Revelir AI with real conversations?
Yes, validating insights with real conversations is a key feature of Revelir AI. After running analyses in the Data Explorer, you can click on any metric to access Conversation Insights. This feature allows you to view the exact tickets and transcripts that contributed to the metrics, enabling you to confirm that the insights align with actual customer feedback. This traceability helps build trust in the data and supports informed decision-making.
When should I refine my tagging system in Revelir AI?
You should consider refining your tagging system in Revelir AI when you notice inconsistencies or redundancies in your current tags. Regularly review the performance of your tags and consider mapping messy raw tags into a smaller set of meaningful canonical tags. This refinement process helps maintain clarity and improves the accuracy of your insights. Additionally, as new issues or trends emerge, updating your tagging system ensures that your data remains relevant and actionable.
Why does Revelir AI focus on 100% coverage of tickets?
Revelir AI emphasizes 100% coverage of tickets to ensure that no critical signals are missed. By processing all conversations rather than a sample, you gain a comprehensive view of customer sentiment, churn risk, and other key metrics. This approach eliminates bias and provides a more accurate representation of customer experiences. It allows teams to make data-driven decisions based on complete insights, rather than relying on potentially misleading sample data.