
Most onboarding problems are hiding in plain sight. They’re in your support conversations, word for word, describing exactly where new customers get stuck, how long it takes, and what they tried before giving up. Scores hint at the issue. Quotes show you the fix.
Here’s the thing most teams don’t want to admit: sampling and score-watching feel responsible, but they delay learning. You don’t need more dashboards. You need evidence, drivers tied to real conversations, so you can walk into the room and say, “Here’s what’s breaking onboarding, who it’s affecting, and what we’ll fix first.”
Ready to get started? Learn More.
Key Takeaways:
- Use support conversations to pinpoint onboarding blockers faster than surveys or dashboards
- Stop sampling, analyze 100% of conversations and attach quotes to every insight
- Structure raw text into drivers, canonical tags, and AI metrics (sentiment, effort, churn risk)
- Quantify TTV impact by cohort, then validate patterns with representative tickets
- Prioritize fixes by impact × severity × effort and measure pre/post changes
- Shift meetings from anecdotes to evidence by making quotes visible on demand
Why Support Conversations Are Your Fastest Path To Fixing Onboarding
Support conversations reveal onboarding friction faster than surveys because they capture unsolicited, in-the-moment obstacles. Scores signal a dip, but they rarely tell you which step broke or why. When you anchor insights to exact quotes, prioritization gets easier, for example, “account access loops for new enterprise trials.”
What Is Onboarding Friction And Why Do Quotes Beat Scores?
Onboarding friction is any barrier that slows a new user’s path to first value. Scores can flag a problem, but they don’t name the step or the wording that created confusion. Quotes do. They show the mis-click, the misunderstood field, the broken import, clear enough to route a fix this week.
It’s usually not a mystery. It’s buried in threads about login resets, permission missteps, or CSV formats. The customer told you what hurt. You just didn’t have a way to aggregate those moments without losing the specifics. When insights are grounded in quotes, product doesn’t argue the “why.” They see it. And act.
If you need a refresher on the common traps, see user onboarding friction. Use it as a reference point, then validate with your own tickets.
Why Sampling And Score Watching Fall Short
Sampling and score-watching feel efficient. They aren’t. Sampling blinds you to rare-but-critical blockers; score trends trigger debates without pointing to fixes. Meanwhile, subtle drivers, onboarding copy, field names, import prerequisites, only show up in the conversations themselves.
Let’s pretend you sample 10% of 1,000 tickets. Five hours later, you’ve got a partial view and a stack of assumptions. Nobody’s checking whether the missed 90% contains the real churn signal. Same thing with scores: “Sentiment down” tells you nothing about the permission path causing high-effort setup for enterprise admins. Full coverage changes the conversation from guessing to knowing.
The Real Root Cause Of Missed Onboarding Signals
Teams miss onboarding signals because they reduce rich conversations to abstract numbers and tiny samples. Manual audits capture nuance but don’t scale; surveys produce tidy scores but miss unsolicited context. The blockers, login loops, import confusion, permission gaps, live inside threads, not dashboards.

Why Do Traditional Approaches Miss Root Causes?
Traditional approaches optimize for neatness over truth. Surveys compress language into a number. Sentiment-only tools flatten intent. Manual reviews catch nuance, but collapse under volume. The result is partial visibility that hides setup pitfalls your new users describe in plain English.
The real problem isn’t a lack of data; it’s unstructured data. Without a consistent way to tag drivers and measure effort or churn risk, teams default to exports, ad hoc spreadsheets, and best-guess narratives. That gets you to “we think,” not “here’s exactly what’s breaking for new enterprise trials on step three.”
Unstructured Text Is The Bottleneck
Raw conversations are messy. Different phrasing, varied contexts, multiple actors. If you don’t convert that text into a structured, queryable layer, you can’t pivot by cohort, product area, or timeframe with confidence. You’re stuck reading tickets by hand and hoping you catch the pattern.
Structure unlocks speed. Translate conversations into drivers, canonical tags, and AI metrics like sentiment, effort, and churn risk. Now you can pivot by segment, isolate what’s spiking, and drill into representative tickets to validate edge cases. If you want methods for extracting friction from conversations, this walkthrough on identifying friction points from calls and interviews is a helpful complement, then automate it across 100% of tickets.
The Hidden Costs Of Guessing Where Onboarding Breaks
Guessing costs more than you think. You burn time sampling, miss early signals, and ship generalized fixes. Meanwhile, silent blockers erode TTV and nudge new customers toward churn. The compounding effects hit engineering capacity, support morale, and revenue.
Engineering Hours Lost And Frustrating Rework
Let’s pretend you handle 1,000 tickets a month. Sampling 10% at three minutes each is five hours for a partial view. To read them all at that pace would be 50 hours. Nobody has that, so teams punt to “good enough,” ship generic help docs, and hope.
Here’s the bill: rework. Engineering builds a fix for the wrong problem because the insight lacked evidence. CX writes extra macros that don’t move TTV. Leadership reviews slide decks without quotes and pushes decisions out a week. Guessing burns cycles you can’t afford. Evidence shortens the loop from “we think” to “we fixed it.”
TTV Slippage Increases Churn Risk
Time to value isn’t a metric; it’s the clock your new customers feel. If onboarding friction adds days or weeks, adoption lags and expansion fades. You pay twice, once in support effort and again in missed revenue. It’s usually preventable if you see friction early and tie it to exact quotes.
Anchor the analysis in numbers and context. Baseline TTV by cohort. Track effort and churn risk alongside drivers. When you fix copy on a setup step, you should see TTV drop and related ticket volume decline. For measurement ideas, this overview of customer onboarding metrics is a solid starting point, then validate changes against your own conversation evidence.
What It Feels Like When Onboarding Goes Sideways
Onboarding pain has a signature. Confused tickets pile up, trials stall, and leaders ask for clarity you can’t produce fast enough. Without evidence you can trace, meetings devolve into anecdotes and opinions. The loudest story wins. Until tomorrow’s louder one shows up.
What Happens When A New Logo Stalls In Week One?
You see a spike in access or import issues. Sales pings you. The trial clock is ticking. Everyone wants a root cause and a plan. But nobody can point to the exact moments customers got stuck, across 100% of conversations, with quotes that product will accept.
You don’t need a war room. You need a driver view tied to transcripts. “Account access loops are 38% of negative sentiment among new enterprise trials; here are three tickets showing exactly where it fails.” That’s how you secure a small fix this sprint and protect the renewal conversation six months from now.
You Want Proof, Not Anecdotes
Executives ask where a number came from. PMs ask to see examples. Finance asks for expected TTV impact. If you can pivot from aggregate to quotes in seconds, those questions get answered in one pass. Alignment gets easier. Decisions get faster.
Not all friction is bad, by the way. There’s productive “speed bumps” that increase activation quality. The literature on positive onboarding friction offers useful nuance, keep the beneficial steps, remove the accidental ones. Evidence lets you do both with precision.
A Practical Workflow To Detect And Fix Onboarding Friction From Support Conversations
A practical workflow starts with clear cohorts and baselines, moves to full-coverage ingestion and structuring, then ends with prioritized fixes validated by quotes. You’re turning noise into decisions. From there, iterate weekly.
Step 1: Define Cohorts, Success Metrics, And TTV Baselines
Start with reality. Define cohorts: trials, new paid, enterprise. Align on success markers like “first value action” and “time to first outcome.” Baseline TTV for each so you can measure improvements where they matter, not the blended average that hides risk.
This is where you switch from “we think” to “we’ll prove it.” Agree on the fields you’ll use for segmentation (plan, region, product area). Capture pre-change ticket volumes by driver. Then set target deltas so any fix, copy, checklist, small UX tweak, can be evaluated against objective movement in TTV and related ticket counts.
Step 2: Ingest And Normalize 100% Of Onboarding Conversations
Bring in all the tickets. Not a sample. Normalize the fields you’ll need later: cohort labels, plan tier, product area, channel. The payoff is speed. When friction spikes, you’re not cleaning data, you’re analyzing it.
Full coverage ends the representativeness debate. It also catches quiet problems early, the setup step only a subset hits, the permission nuance only enterprise admins see. If you want a quick checklist of what to measure, skim this piece on AI measures for onboarding friction, then bind each measure to quotes in your own data.
Want to see the full-coverage approach in action using your tickets? See how Revelir AI works (https://tryrevelir.com, https://https://tryrevelir.com).
Step 3: Auto Tag And Extract Friction Drivers With Evidence Backed Quotes
Convert text to structure. Use drivers and canonical tags to label issues like account access, billing, imports, or permissions. Add AI metrics, sentiment, effort, churn risk, so you can rank drivers by severity and volume. Then drill into three representative tickets per driver to capture quotes that make the problem undeniable.
Interjection. Don’t overdo the tagging taxonomy on day one. Start with a handful of business-ready categories, then refine. The key is traceability. Every number should point to the transcript behind it. When you present “Onboarding friction is spiking due to imports,” the quotes do the heavy lifting. If you need prompts that yield actionable quotes, here are great VoC questions for onboarding friction you can adapt to your reviews.
How Revelir AI Operationalizes The Onboarding Feedback Loop
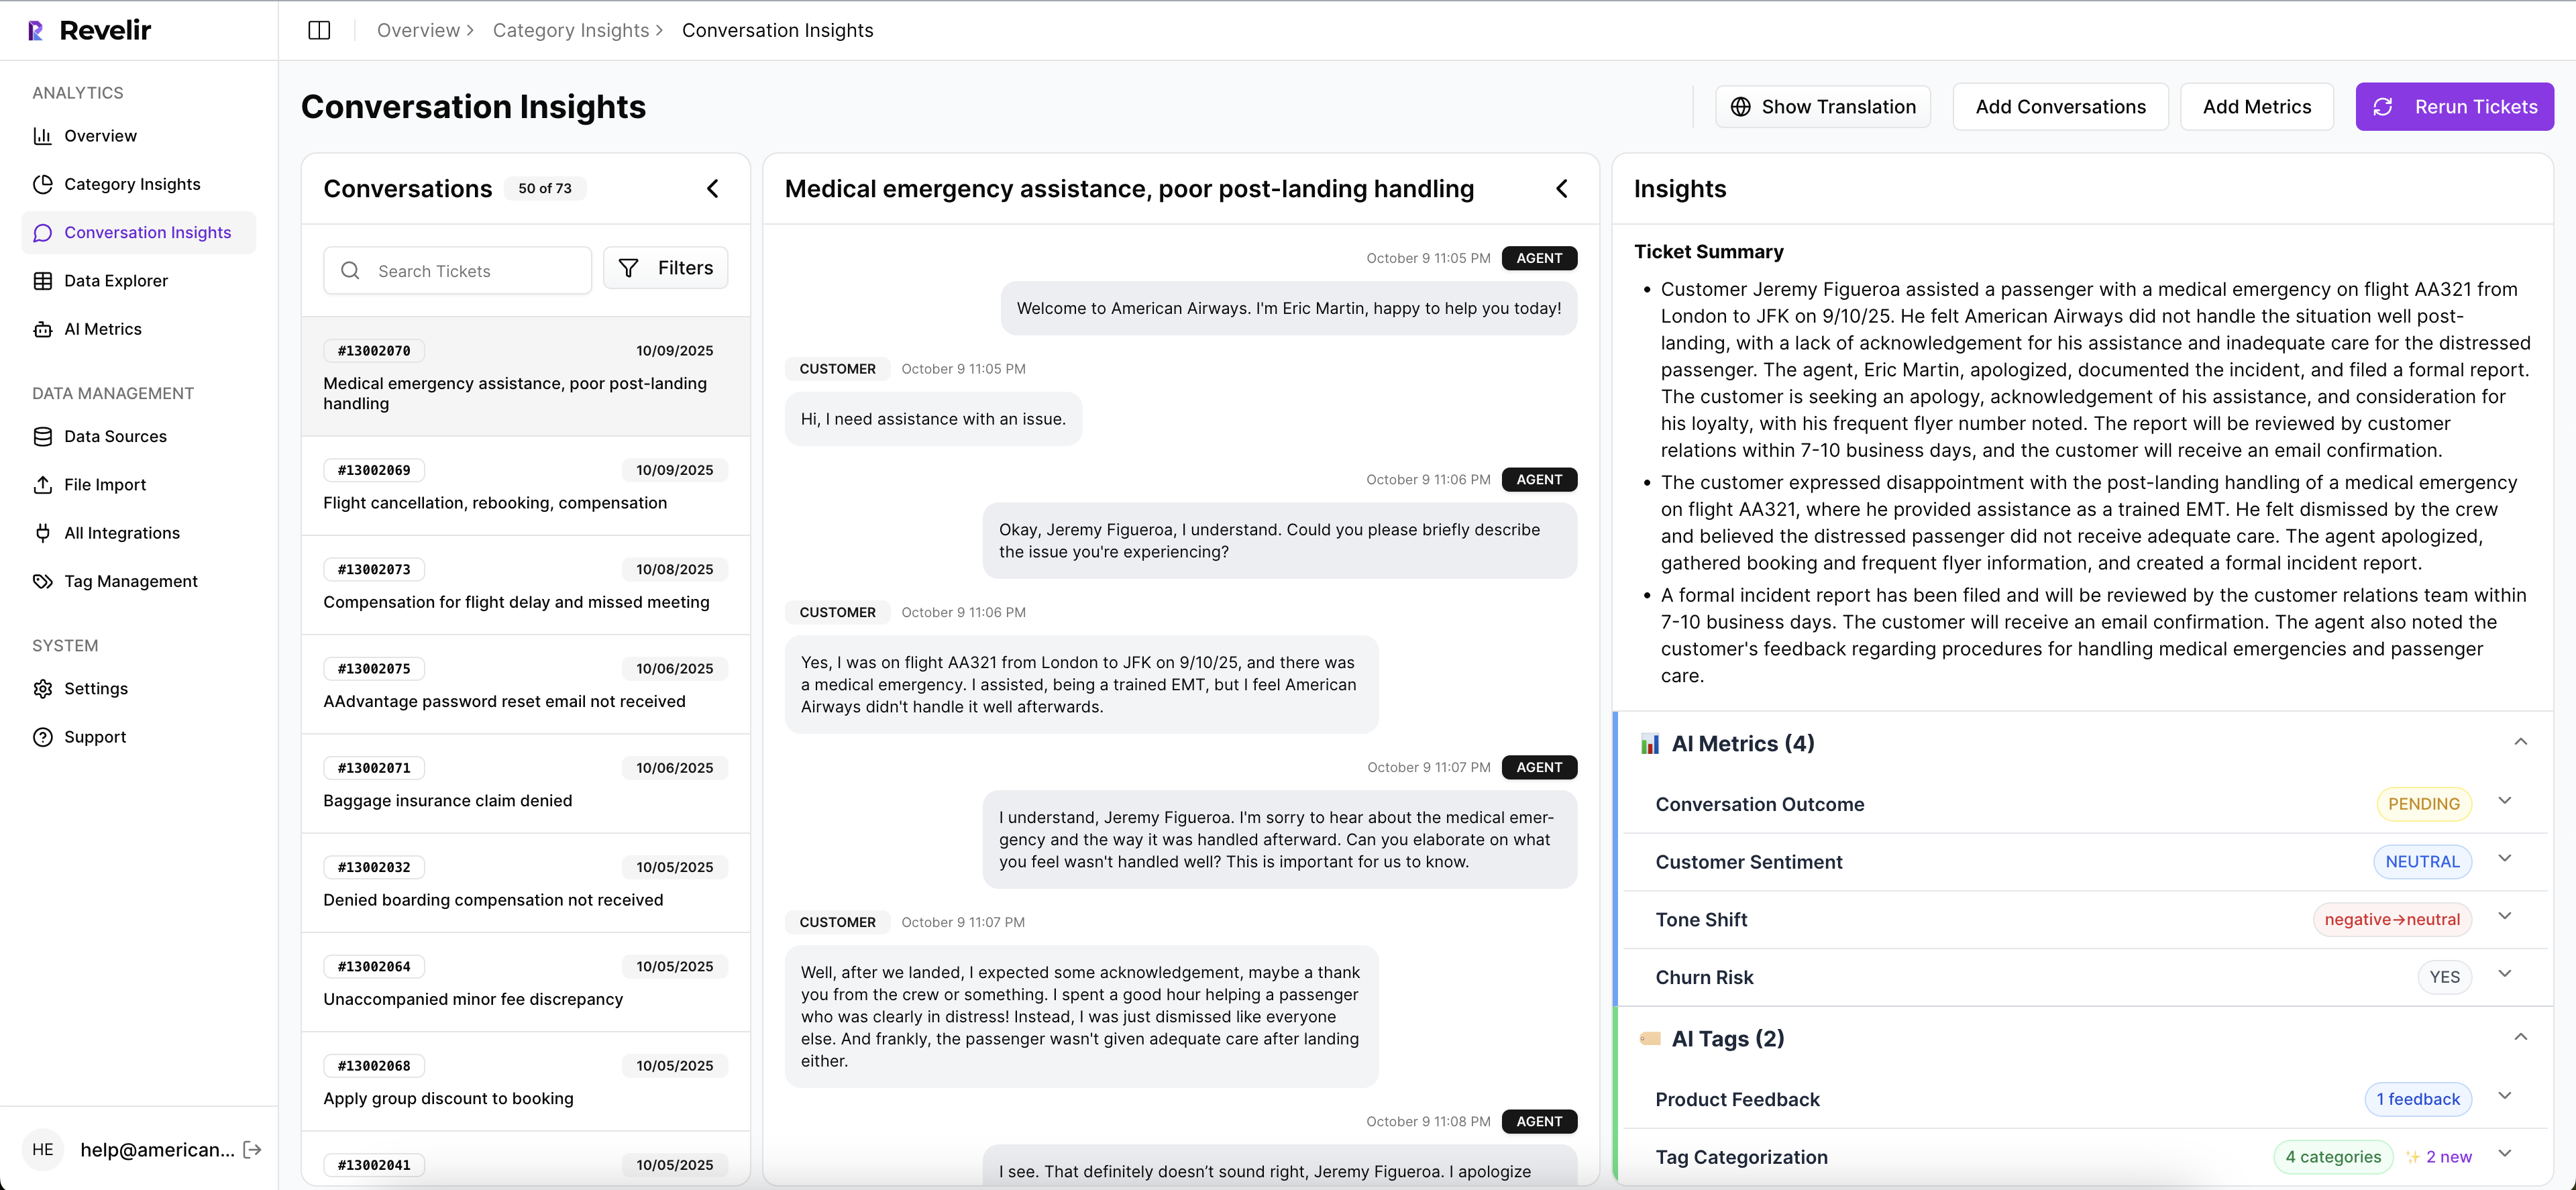
Revelir AI turns 100% of your support conversations into structured, evidence-backed onboarding insights. It processes every ticket, structures the text, and makes the source quotes visible by default. You move from gut feel to decisions grounded in transcripts.
Full Coverage Processing, No Sampling Needed
Revelir AI analyzes 100% of conversations automatically, so you avoid sampling bias and catch early signals you’d otherwise miss. That matters for onboarding, where rare-but-costly blockers can tank a trial. Early detection prevents escalations, reduces rework, and keeps TTV from slipping.

This is the “coverage” side of trust. When someone asks, “Are we sure?” you’re not waving a sample, you’re showing the full population. It short-circuits the endless debate about representativeness and gets you back to prioritizing what to fix first.
Data Explorer For Cohorts, Drivers, And Severity
Data Explorer is where you work day-to-day. Filter by cohort or plan, slice by sentiment or churn risk, then group by driver or canonical tag. Click Analyze Data to see severity distributions at a glance, effort, churn risk, sentiment, by driver. Then drill straight into the conversations behind any number.

Revelir keeps this fluid. Add or remove columns (drivers, canonical tags, AI metrics). Save views for weekly reviews. The result is a pivot-table feel for tickets that lets you say, “New paid customers are hitting access loops; 42% of negative sentiment ties to permissions,” with one click into examples.
Evidence Backed Traceability That Earns Buy In
Every aggregate in Revelir links to the underlying transcripts via Conversation Insights. You get AI summaries, the assigned tags and metrics, and the exact quotes you’ll use in meetings. This is how you collapse the “show me proof” question from a day of prep to ten seconds.
Here’s why it matters. The costs we covered, rework, escalations, TTV slippage, thrive in ambiguity. Revelir makes the evidence visible, so product trusts the signal, CX moves faster, and finance sees the business impact. Want to move your onboarding review from anecdotes to evidence this month? Learn More.
Conclusion
Onboarding doesn’t fall apart because you lack data. It falls apart because the best data, what customers actually said, stays unstructured and hard to trust. When you analyze 100% of conversations, turn them into drivers and metrics, and keep quotes attached, you stop guessing. You shorten TTV, reduce escalations, and ship fixes with confidence. That’s the move from “we think” to “we know,” and it’s how onboarding gets measurably better.
Frequently Asked Questions
How do I analyze support conversations for onboarding issues?
To analyze support conversations for onboarding issues, start by using Revelir AI's Data Explorer. First, filter your dataset by relevant tags or categories associated with onboarding. Next, run an analysis on metrics like sentiment or churn risk to identify patterns. For example, you might find that a significant number of negative sentiments are linked to specific onboarding steps. Finally, drill down into individual tickets to validate your findings with real quotes from customers, which can provide context and clarity on the issues they faced.
What if I want to prioritize fixes based on support data?
To prioritize fixes using support data, you can use Revelir AI's Analyze Data feature. Start by selecting the metrics you want to analyze, such as sentiment, churn risk, or customer effort. Group the results by canonical tags or drivers to see which issues are most prevalent. For instance, if you discover that billing issues have high churn risk and negative sentiment, those should be prioritized for fixes. This structured approach allows you to focus on the most impactful problems first.
Can I connect Revelir AI to my existing helpdesk system?
Yes, you can connect Revelir AI to your existing helpdesk system, such as Zendesk. This integration allows Revelir to automatically ingest support tickets and analyze them without any manual exports. Once connected, Revelir processes 100% of your conversations, tagging them with relevant metrics like sentiment and churn risk. This ensures you have a complete view of your support data, enabling you to make data-driven decisions quickly.
When should I validate insights from support data?
You should validate insights from support data whenever you identify significant trends or anomalies. For example, if you notice a spike in negative sentiment regarding a specific feature, use Revelir AI's Conversation Insights to review the underlying tickets. This step helps ensure that the metrics align with actual customer feedback. By validating insights this way, you can confidently present findings to your team and prioritize actions based on real evidence from customer conversations.
Why does Revelir AI emphasize evidence-backed metrics?
Revelir AI emphasizes evidence-backed metrics because they provide a reliable foundation for decision-making. Unlike traditional methods that rely on sampling or subjective interpretations, Revelir analyzes 100% of support conversations, linking insights directly to customer quotes. This transparency builds trust among stakeholders, as they can see the exact conversations that inform the metrics. By focusing on evidence, teams can prioritize fixes effectively and address the root causes of customer issues.