

Most teams track churn with point-in-time stats. Volume. CSAT. A single “churn risk” label on a ticket. Useful, sure. But it’s like reading one frame of a movie and guessing the ending. You miss the slope. And churn is a slope.
If you’ve ever felt blindsided at renewal, this is why. The story lived across three tickets, two after-hours replies, one escalation hop, and a tone that slid from measured to clipped. That’s a trajectory. You don’t need a PhD model to see it. You need to assemble the timeline, watch the trend, and act early while the customer is still talking to you.
Key Takeaways:
- Track trajectories (sequences) instead of only snapshots to catch churn weeks earlier
- Start with five interpretable signals: reopens, sentiment slope, escalation depth, message imbalance, and latency drift
- Normalize messy support timelines so the sequence reflects reality, not tooling quirks
- Demand traceability from every alert back to transcripts to earn cross-functional trust
- Measure lift with lead time and precision-at-k so you know it’s worth the playbook change
Why Snapshot Metrics Miss Early Churn Risk
Snapshot metrics miss early churn risk because they ignore the order and timing of events. The warning lives in the slope of sentiment, the frequency of reopens, and the length of the escalation chain. Teams spot risk earlier when they evaluate sequences across 100% of conversations and preserve links to the exact quotes.
What Are Conversation Trajectories And Why Do They Matter?
A conversation trajectory is the sequence of events across a ticket (or series of tickets): who said what, when it was said, how sentiment shifted, and how status changed along the way. Think reopen timestamps, message order, response latency, and escalation depth. The pattern, not the point, is the signal.
Why it matters is simple: customers don’t churn because of one sentence. They churn because the experience drifts the wrong way and no one notices the drift. Trajectories let you measure the direction and speed of that drift. When slopes go south and reopens compress, you have a window to intervene before the “we’re evaluating alternatives” email lands.
Why Conventional Flags Fire Late
Conventional flags lean on static fields and per-ticket summaries. They fire when a conversation goes obviously bad or after an agent tags it as “risk.” Helpful, but late. By the time the last ticket looks terrible, the account team is already negotiating from behind.
When you analyze every conversation and preserve traceability to transcripts, you replace anecdotes with evidence. That matters in the meeting. It also moves the clock. Sequence features like rising reopen rate or deepening escalations tend to shift days earlier than end-of-ticket labels, giving CX and product time to make a move that actually changes the outcome.
Where Should You Look First?
Start with signals that combine interpretability and lift. You want features your team can explain and your leaders can trust. Reopen frequency across a rolling window, sentiment slope over message order, and escalation depth check both boxes. Add message imbalance and latency drift to capture urgency and friction.
Then prove it. Sequence models consistently beat aggregate-only baselines because order encodes intent. See the ACM research on sequence signals outperforming aggregates. You don’t need heavy modeling to benefit. Simple rules on well-constructed sequences go a long way when you can show the transcripts behind them.
Ready to skip the theory? See the end-to-end flow in minutes. See How Revelir AI Works.
What Your Existing Dashboards Do Not Show You
Existing dashboards overlook the order and spacing of events, so they flatten different stories into the same score. Without sequence, you can’t separate a one-off spike from a downward spiral. Trajectory features restore the missing dimension and expose pressure building before it hits revenue.
What Do Traditional Metrics Overlook?
Traditional metrics focus on counts and end states: ticket volume, CSAT averages, SLA attainment, one-label sentiment. They answer “how much” and “what now,” but not “how did we get here.” Two conversations with identical CSAT can have opposite trajectories, one recovered gracefully; the other limped to a close.
That difference is operationally huge. A recovered experience doesn’t predict churn. A limping one does. If your data can’t tell those apart, your risk radar is blind. That’s why “we were surprised” shows up at renewal. It wasn’t random. It was a slow slide you didn’t measure.
The Hidden Complexity Inside Event Sequences
Support tooling fragments stories. Tickets merge. Status flips. Parent-child relationships hide context. If you analyze raw events as-is, you’ll model the tool, not the customer’s experience. The fix is normalization. Stitch by account and issue, then rebuild a single timeline using message timestamps and consistent state transitions.
Sessionize with a gap, say 36–48 hours of inactivity, to distinguish bursts from new episodes. This keeps a tense thread intact while avoiding false continuity across unrelated issues. For context on how behavioral sequences improve risk modeling when properly sessionized, see this PLoS ONE study on behavioral sequences and risk modeling.
Why Traceability Is Non-Negotiable
Every alert should click straight to the exact conversations and moments that produced it. Not a screenshot. The transcripts. When product asks “show me where it escalated,” you should land them on the handoff message with quotes that explain why.
That’s how trajectory analytics earns trust, especially when the signal points toward uncomfortable fixes like pricing, policy, or entitlements. Without traceability, the room debates methodology. With it, they discuss solutions. That’s the whole point.
The Real Cost Of Late Detection
Late detection compresses your options and inflates costs. You burn time on escalations, overtime, and high-stakes recovery instead of earlier, calmer fixes. Teams reduce these costs by tracking trajectory signals that fire 14–30 days ahead and measuring precision and lead time, not just recall.
Let’s Pretend We Wait For Renewal Calls
Let’s pretend an enterprise account opens three negative-leaning tickets in 30 days. No one ties them together. Renewal is 21 days out. The churn-risk classifier finally flips after a terse final message. The CSM has a week to recover. Not ideal.
Now flip it. You detect a steepening sentiment slope at the second ticket plus a shrinking response window and a new escalation hop. That’s your trigger 28 days out. Seven extra days doesn’t sound like much, but it’s the difference between “we did what we could” and “we shipped a workaround, briefed product, and aligned on a make-good.” Measure it. Track median lead time, precision at k, and the real cost of false positives using methods like those laid out in this NIH methods paper on predictive feature evaluation. Then pick thresholds that buy you time without creating alarm fatigue.
Still triaging this manually? You don’t have to. Learn More.
When Risk Sneaks Up On Your Team
Risk often hides in polite threads that tighten over time. Reopen intervals shrink, replies get shorter, and messages spill into off-hours. When those patterns co-occur, the probability of churn rises. Catch them at the second signal, not the seventh.
When Your Largest Customer Reopens The Same Issue Three Times
The first reopen is cordial. The second includes an executive CC. The third hits at 7:42 pm with a one-line “Any update?” That sequence combines rising reopen frequency with latency drift and a tone shift that’s subtle but real. You feel it in your gut. Now quantify it so the system feels it, too.
If your alert fires after the second reopen and a measurable slide in per-message sentiment, your team can swarm before the “we need to talk” email. This isn’t guesswork. Dialogue research shows sentiment dynamics and frustration cues align with escalation behavior; see the ACL study on sentiment dynamics in dialogue. The key is pairing those cues with traceable evidence so you can walk product to the exact moment the conversation turned.
A Practical New Way To Use Conversation Trajectories
A practical approach starts with five simple, interpretable signals and a validation loop. Use your existing data. Favor rules you can explain. Optimize for earlier lead time and credible precision so the playbooks you trigger are worth the effort.
Signal 1: Reopen Frequency Across Rolling Windows
Compute reopens per account or issue over a 7–30 day window. Count status transitions from solved to open, grouped by ticket or account, then roll up by time window. You’re looking for rising frequency and shrinking time between reopens, classic signs of unresolved friction.
Calibrate thresholds against historical renewals. If the top decile of reopeners correlates with churn, that’s a clean starting point. Alert when frequency crosses that band and time between reopens shrinks. Always link the alert to the most recent two or three transcripts so a human can verify in seconds.
Signal 2: Sentiment Slope Over Message Order
Extract message-level sentiment and fit a simple slope over time within a session. A flat negative is different from a falling trend; the latter implies deterioration, not just dissatisfaction. Window functions in SQL can compute per-conversation slopes and a rolling median by account.
If you lack message-level sentiment, approximate with negative cue counts in summaries or tags. It’s not perfect. It doesn’t need to be. The rule is a tripwire, not a verdict. Validate quickly by sampling in your transcript view. When the slope and reopen frequency both trigger, your precision typically jumps.
Signal 3: Message Imbalance Between Customer And Agent
Count tokens or messages by speaker. A widening imbalance, multiple customer pings before an agent response or repeated “any update?” notes, often signals urgency or confusion. Implement with simple aggregates and a lag to capture response gaps.
Watch for false positives: long-form agent updates can look imbalanced but be productive. That’s why you combine imbalance with sentiment slope or latency drift for alerts. When co-occurrence is the rule, your triggers get both earlier and calmer.
How Do You Tune And Validate Thresholds?
Split historical accounts by renewal outcomes. For each signal, compute precision at k and median lead time. Prefer rules that fire 14–30 days before renewal and meet your acceptable false-positive cost. You can add lightweight sequence patterns (simple event n-grams) to capture repeats like open → pending → open.
Only reach for complex models when rules stop improving. And when you do, keep traceability. The target isn’t a black-box AUC; it’s a system your team trusts under deadline pressure. For deeper evaluation patterns on survival and lead-time framing, this PLoS ONE article on survival and lead-time evaluation is a helpful reference.
How Revelir AI Operationalizes Trajectory Signals End To End
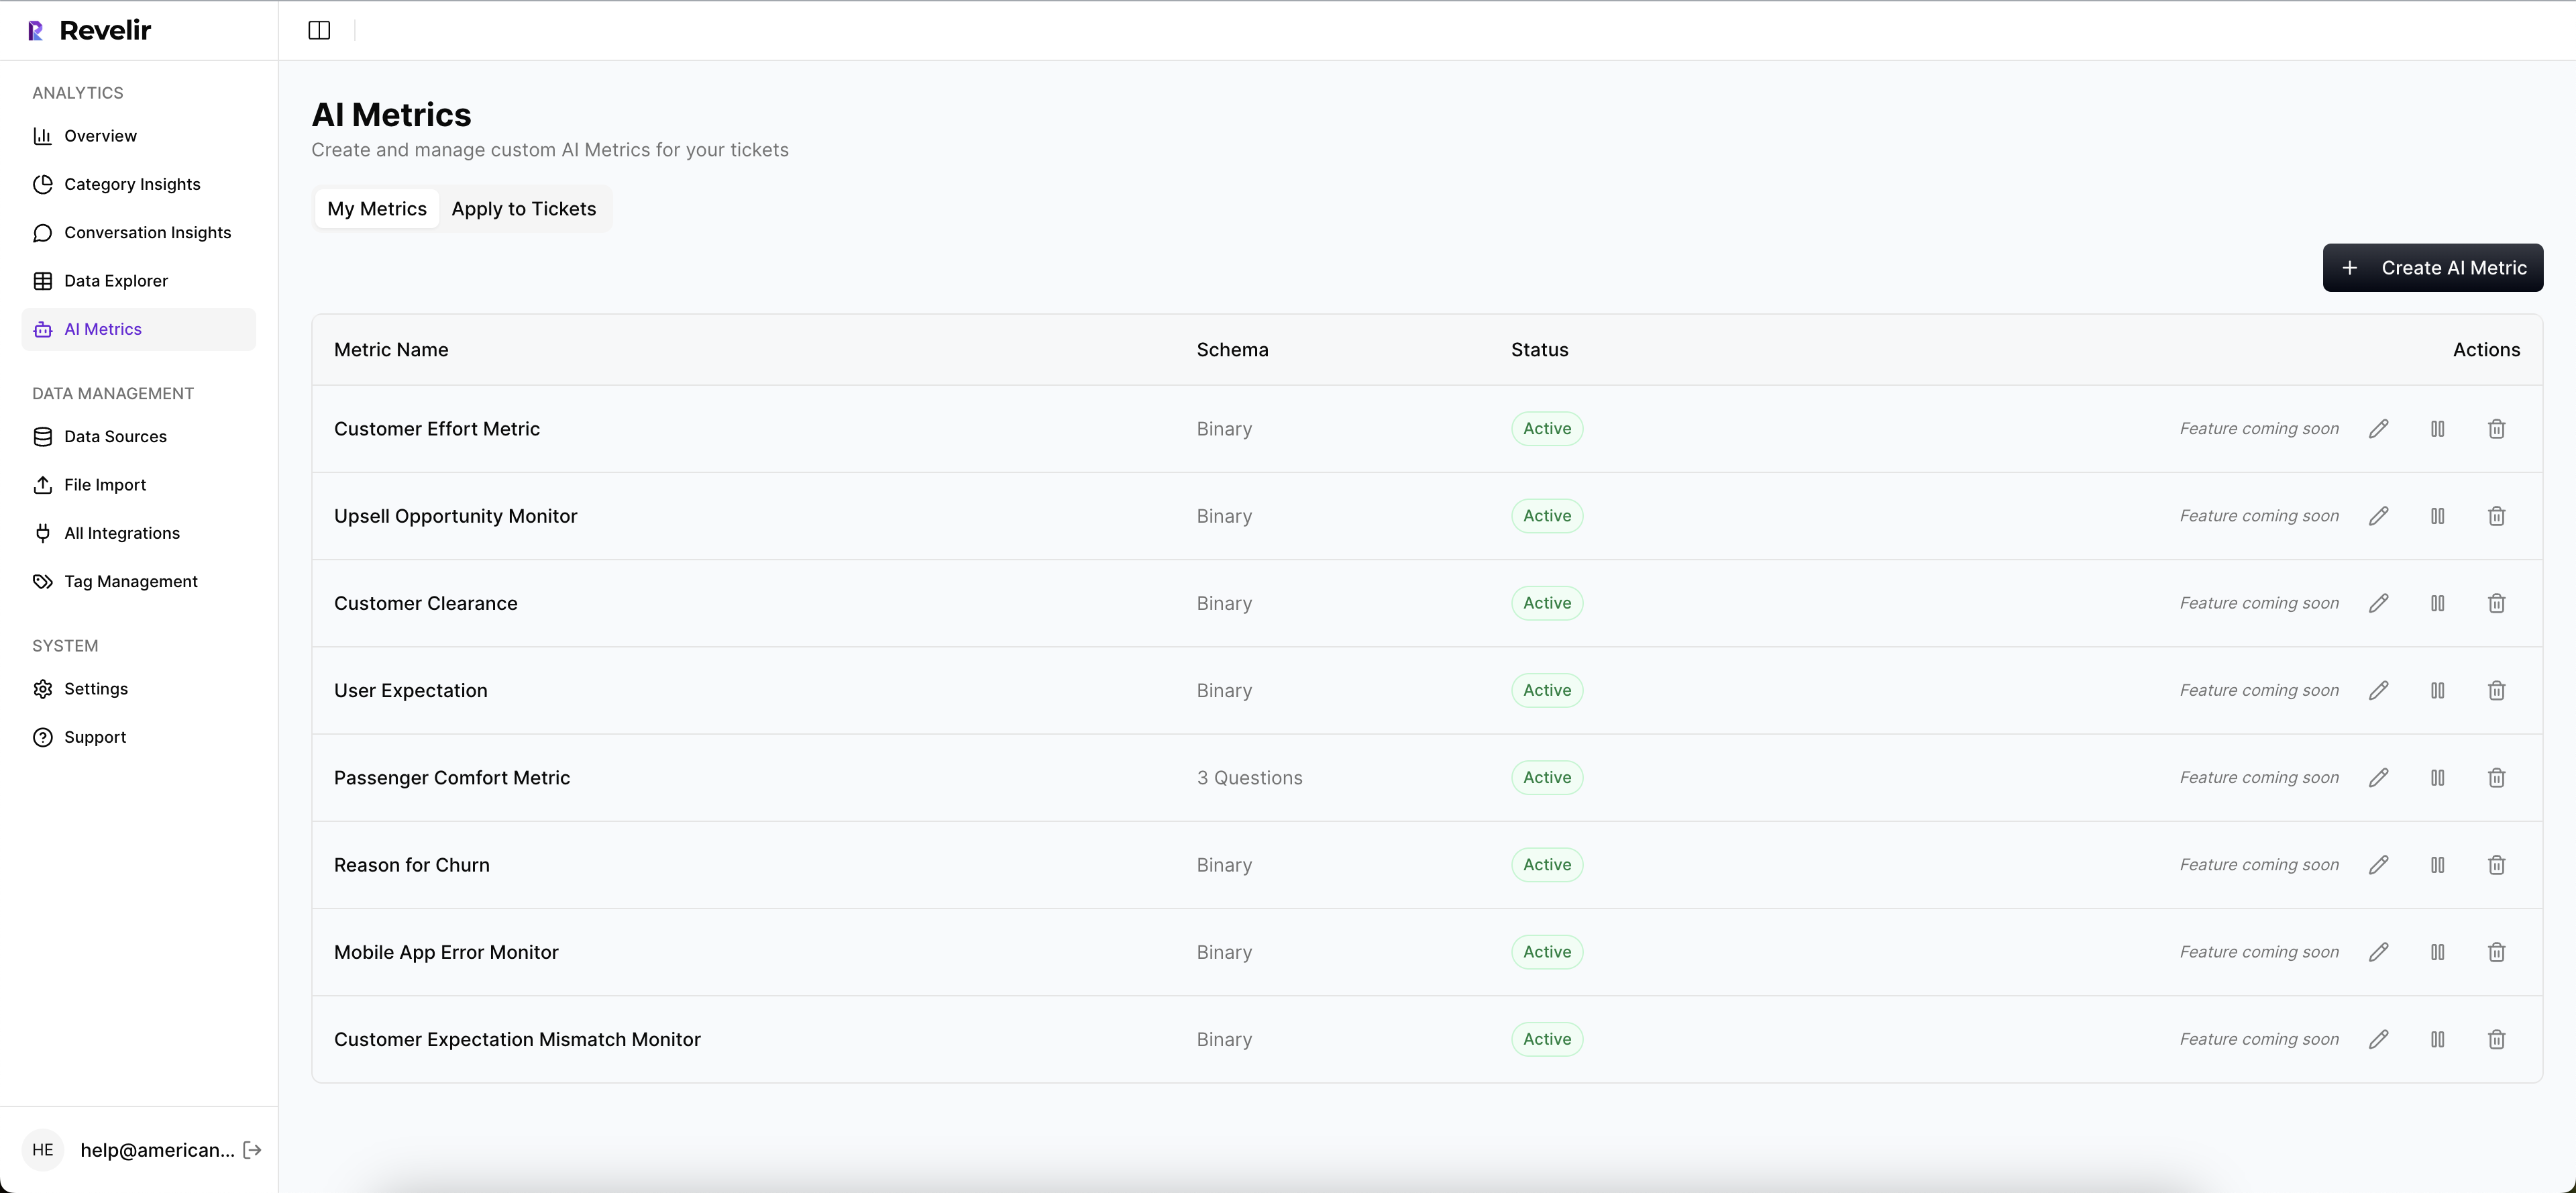
Revelir AI turns trajectory signals into daily practice by combining full-coverage processing, custom metrics, fast analysis, and one-click evidence. You define the signals; the platform makes them filterable, groupable, and traceable so teams can act without spreadsheets.
Signal 4: Resolution Latency Drift Implemented In Revelir AI
Track time from customer message to agent reply, and time from open to solved across sessions. Store both, and their drift, as a Custom AI Metric so you can filter by “latency drift = rising” in Data Explorer and group by drivers in Analyze Data. Now you can see, for example, that refunds are slowing specifically for enterprise accounts.
The benefit isn’t the number. It’s the visibility. You spot growing delay in a category, click into Conversation Insights, and read the moments where tooling or policy caused the stall. That closes the loop from metric to quote in one or two clicks, which is exactly where trust comes from.
Signal 5: Escalation Chain Length Implemented In Revelir AI
Represent escalations as handoffs or status hops and persist chain length alongside sentiment and churn risk. In Data Explorer, slice by plan tier to surface high-risk accounts with long chains. Then use Conversation Insights to verify exactly where the handoff created friction.
This metric is incredibly interpretable. “Three hops” is plain English. More importantly, it’s actionable. Cut the chain by assigning ownership earlier, providing a documented workaround, or getting product involved once instead of three times. Fewer 3 am escalations. Fewer firefights.
Operationalizing Trajectory Analytics With Data Explorer And Traceability
Day to day, you filter by your trajectory metrics, combine with churn risk, and group by drivers. Save views for weekly reviews so the same lens shows up in leadership meetings. When a rule fires, click straight into the underlying conversations to confirm the pattern. You move from alert to evidence in seconds.

Revelir supports this flow end to end: 100% coverage across uploaded or ingested tickets, Custom AI Metrics you define in your own language, Analyze Data for fast aggregations, and Conversation Insights for quote-level validation. If you need broader reporting, export metrics via API so BI shows the same numbers you trust. This is how you reduce late-detection costs. More lead time, higher precision, less debate.
Let’s make this real in your stack, not a slide. Get Started With Revelir AI (Webflow)
Conclusion
Snapshots tell you if a moment was bad. Trajectories tell you whether the story is bending the wrong way, and early enough to change it. Start with five signals your team can explain. Tie every alert to transcripts. Measure lead time and precision, not just recall. When the system stands up to “show me,” people act. That’s how you keep customers, not just count complaints.
Frequently Asked Questions
How do I analyze churn risk in Revelir AI?
To analyze churn risk in Revelir AI, start by opening the **Data Explorer**. Use the filters to select 'Churn Risk = Yes' to isolate tickets that show potential churn signals. Next, click on **Analyze Data** and choose 'Churn Risk' as your metric. Group the results by 'Driver' or 'Canonical Tag' to see which issues are most associated with churn. This will help you identify key areas to address and prioritize follow-ups with at-risk customers.
What if I need to track specific customer segments?
If you want to track specific customer segments in Revelir AI, you can use the filtering options in **Data Explorer**. Filter by customer metadata, such as 'Plan = Enterprise' or any other relevant segment. Once filtered, you can analyze metrics like sentiment and churn risk specifically for that group. This allows you to understand how different segments are experiencing your service and where improvements may be needed.
Can I validate insights with real conversation examples?
Yes, you can validate insights in Revelir AI by using the **Conversation Insights** feature. After running an analysis in **Data Explorer**, click on any segment count to jump directly into the filtered view of conversations. Here, you can read the full transcripts, review AI-generated summaries, and inspect the assigned metrics. This helps ensure that the patterns you see in the data align with actual customer experiences.
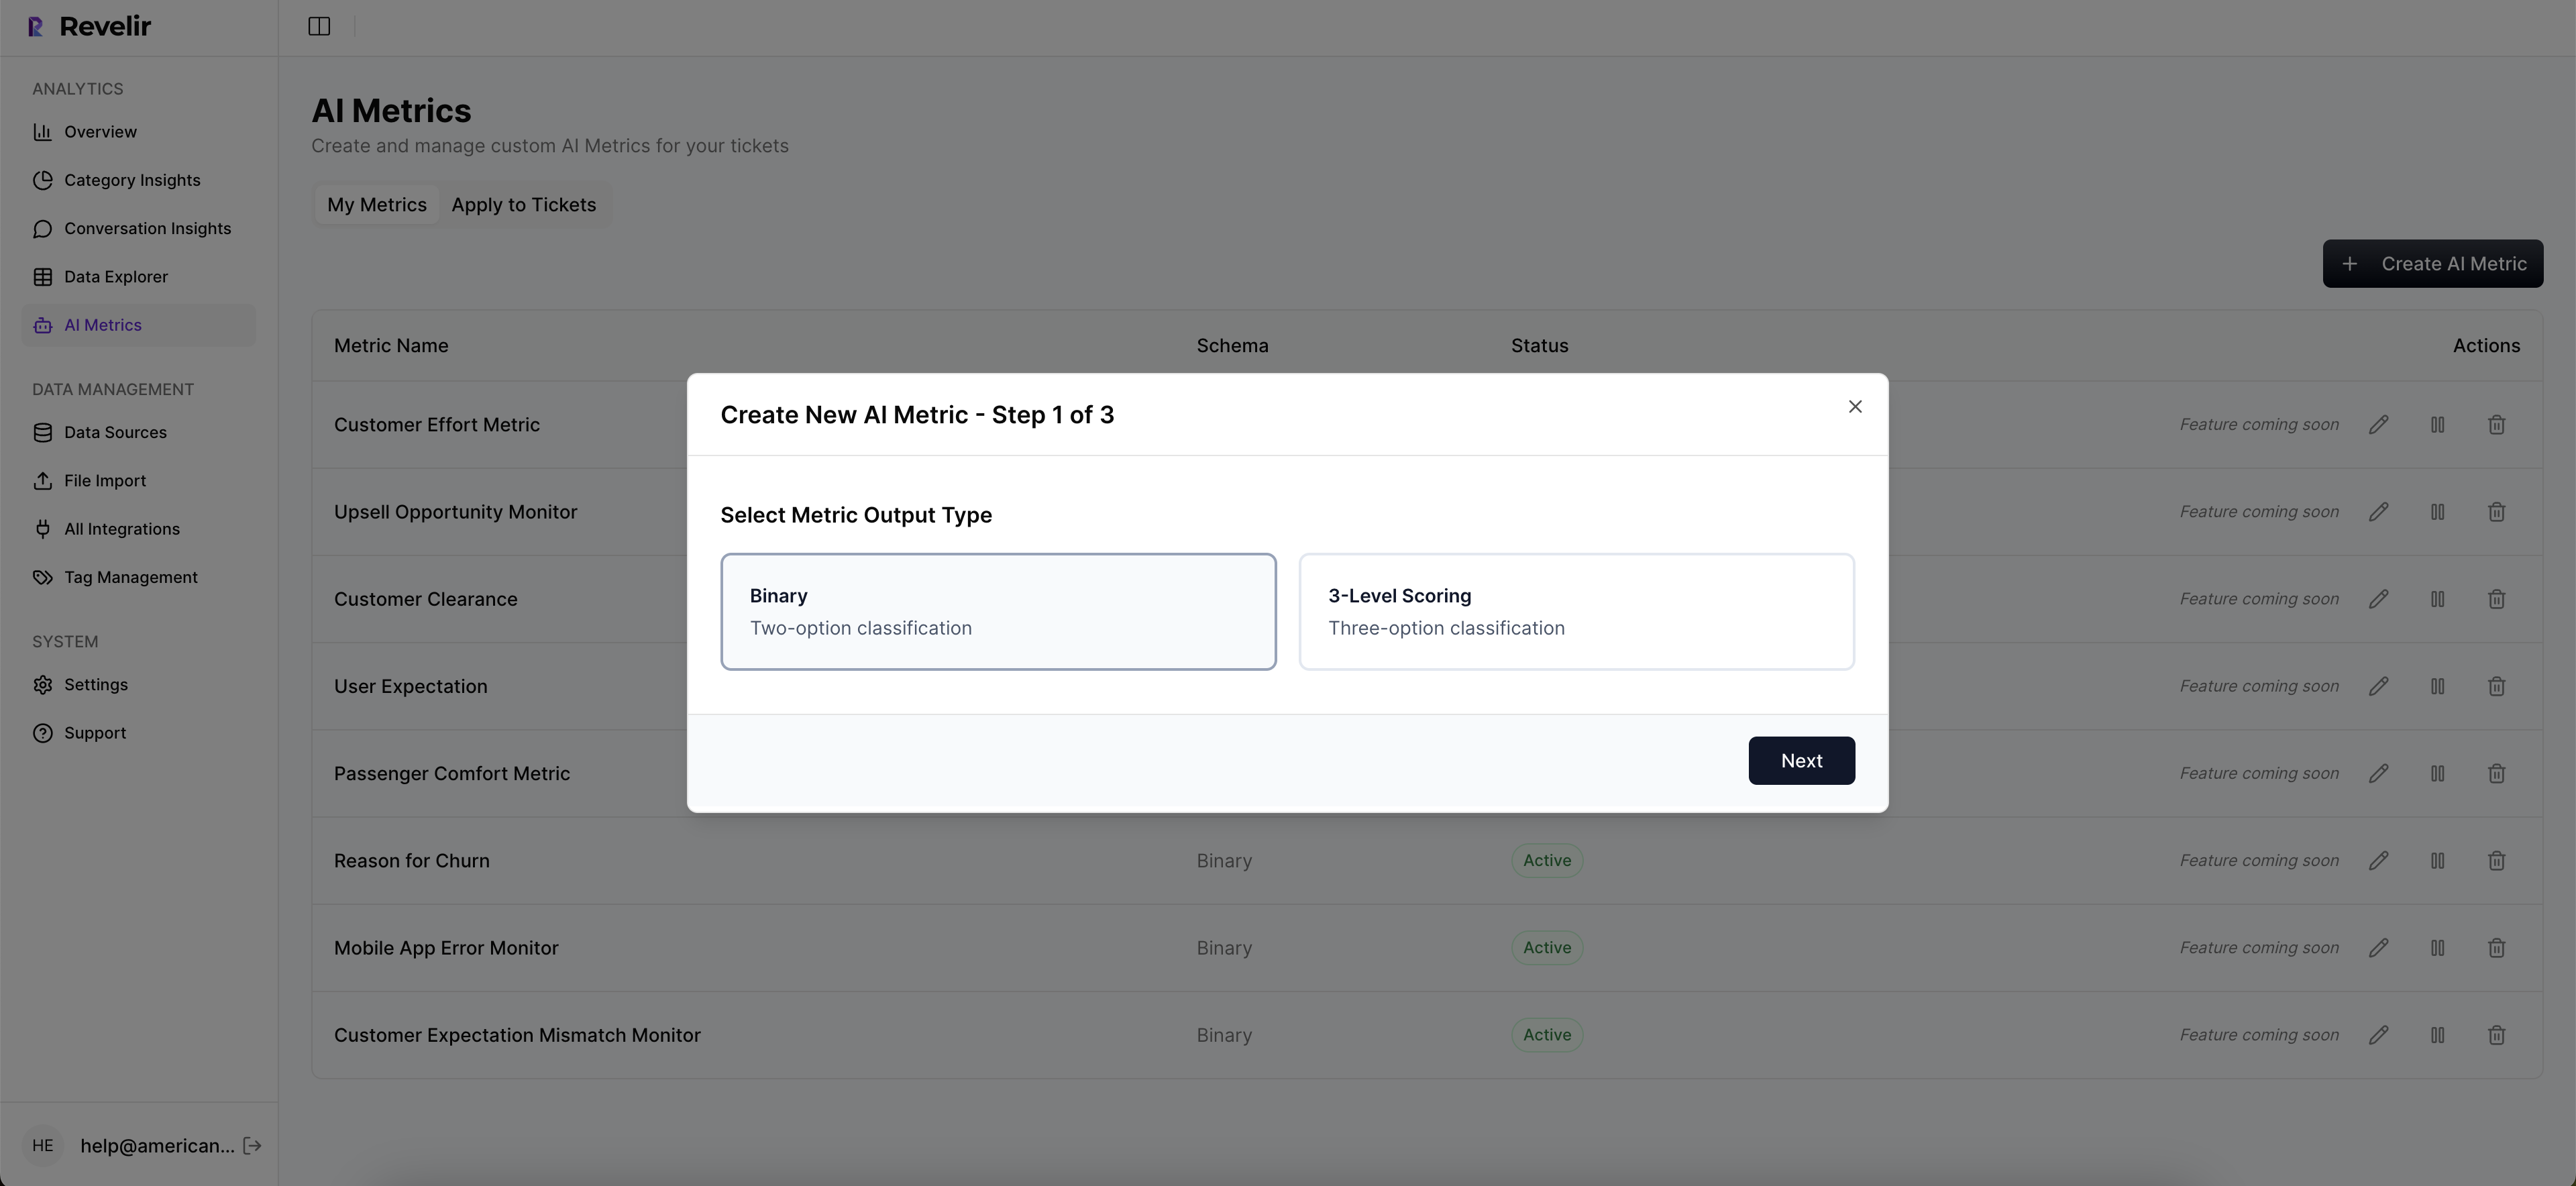
When should I use custom AI metrics?
You should consider using custom AI metrics in Revelir AI when you want to track specific aspects of customer interactions that are unique to your business. For example, if you want to measure 'Upsell Opportunity' or 'Reason for Churn', you can define these metrics in the system. Custom metrics can provide deeper insights tailored to your operational goals, allowing you to make more informed decisions based on the specific needs of your customers.
Why does tracking conversation trajectories matter?
Tracking conversation trajectories is crucial because it allows you to see the sequence of events and sentiment changes over time, rather than just isolated snapshots. This approach helps you identify early signals of churn risk by analyzing patterns across multiple interactions. Revelir AI enables you to assemble these timelines, making it easier to act proactively while the customer is still engaged, ultimately improving retention and customer satisfaction.