

Static ticket sentiment looks scientific on a dashboard. One label, one number, one color. But support conversations don’t move in straight lines. They wobble. They escalate, cool off, problem-solve, and resolve. If you compress that into a single score, you’re not measuring experience—you’re measuring a moment.
Here’s the thing. Most teams know this in their gut but still ship reports with a single sentiment label per ticket. Why? It’s easy, it’s available, and nobody’s checking where the number came from. The cost is subtle but brutal: false alarms, misdirected product fixes, and leadership fatigue when the “big spike” turns out to be early noise that resolved well.
Key Takeaways:
- Static ticket sentiment overcounts early negativity and hides successful recoveries
- Stage-aware, turn-level signals produce ticket labels that match real customer experience
- Downweight volatile early turns; upweight resolution and post-resolution signals
- Build an evaluation set with stage labels and traceable examples before you deploy anything
- Replace sampling and score-watching with full coverage and click-through evidence
- Use pivots and drill-downs to move from pattern to transcript—fast—before escalating
Why Static Ticket Sentiment Gets Priorities Wrong
Static ticket sentiment gets priorities wrong because conversations change meaning as they progress. Early frustration often becomes relief after a clear workaround or refund, and that swing matters more than the initial spike. Stage-aware, turn-level scoring produces a final label that reflects the end-state customers actually remember.

The single label trap
Treating a whole ticket as positive or negative ignores how conversations evolve across hours or days. Opening turns commonly contain venting; mid-threads carry uncertainty; late turns resolve. When you collapse this into one label, you’ll overweight the loud part and underweight the outcome. That’s how you end up with “negative” tickets that finished on a thank-you.
It shows up in planning. A dashboard flags “negative sentiment,” the room infers failure, and product burns a sprint on fixes that won’t move retention. Meanwhile, the tickets that actually ended unresolved get drowned out by volume. You’re not wrong to care about the signal—you’re just listening at the wrong time.
This is solvable. Assign sentiment at the turn level, then aggregate with weights that favor later turns and documented outcomes. You’ll see the spike for what it is: a stage in the journey, not the destination.
Why turn-level shifts change the story
Turn by turn, tone shifts with agent quality, new information, and policy flexibility. A confident update flips anxiety into understanding. A refund flips frustration into relief. If your model treats each turn as equal, polarity whiplash cancels out and the final label lands somewhere meaningless—usually “negative.”
Recency matters. So does outcome. A neutral final customer message after a documented fix is not the same as a neutral opener with no path forward. Add stage and outcome context, then use decay so the last two or three customer turns carry more weight than the opener. You’ll stop chasing ghosts and start seeing recoveries.
Do this well and your alerting changes. Fewer false alarms. Fewer walk-backs. More tickets marked negative because they really failed, not because they started hot and ended fine.
What is conversation‑stage sentiment?
Conversation‑stage sentiment combines per-turn polarity with stage labels like opening, triage, troubleshooting, escalation, resolution, and post‑resolution. You score each turn, assign a stage, then aggregate with weights that favor late turns and successful outcomes. The result is a ticket‑level label aligned to the customer’s final experience.
There’s academic backing for this approach. Stage-aware, longitudinal scoring has been shown to reduce misclassification in multi-turn dialogs, as described in NSF-supported longitudinal conversation sentiment research. You don’t need a lab to use the idea—you just need the stages, the weights, and a way to validate with real transcripts.
Ready to see the difference with your own data? See how Revelir AI works.
The Real Structure of Support Conversations
Support conversations follow stages that change the meaning of similar phrases. “Still not working” in triage signals open investigation, while the same words during resolution can signal failure. Stage labels provide the context that turns noisy polarity into actionable sentiment.
Stages define context, not just topic
A complaint isn’t a topic—it’s a journey. Opening is discovery. Triage is hypothesis. Troubleshooting is iteration. Escalation changes risk. Resolution and post-resolution tell you if the fix stuck. Without stage context, your model treats “please try again” the same way whether it’s the first attempt or the fourth after an escalation.
Define a stage schema that mirrors how your team works. Keep it simple enough for consistency and specific enough to capture risk inflection points. You can start with six: opening, triage, troubleshooting, escalation, resolution, post‑resolution. What matters is not perfection—it’s having a shared lens that lets you interpret sentiment with the right expectation for the moment.
Once you have the schema, everything sharpens. You’ll stop confusing effortful progress for failure and start recognizing language that signals recovery or breakdown.
What traditional approaches miss
Most document-level sentiment classifiers assume independent texts, not role-based dialogues with goals. They don’t know who’s speaking, whether context changed, or if an outcome is in sight. They flatten nuance, which is how they misread healthy troubleshooting friction as negativity.
It’s usually not the model’s fault; it was trained on the wrong unit of work. A ticket isn’t a document—it’s a sequence. Without explicit stage signals, your classifier can’t separate “we’re still trying step two” from “we’re stuck on step four after escalation.” That gap inflates negatives and sends your team searching for product fixes when the issue is procedural.
If you want the model to understand conversations, teach it the structure of conversations. Roles, turns, stages, outcomes. Then sentiment starts to make sense.
How do stages interact with sentiment?
Stages act like priors that shape how you weigh each turn. Opening and triage are volatile, so you down‑weight them. Resolution and post‑resolution carry outcome signals, so you up‑weight them. Escalation introduces risk and should influence confidence, routing, and any follow-up review.
There’s plenty of evidence that multi-turn context changes evaluation difficulty and meaning; see this peer‑reviewed overview of multi‑turn evaluation challenges. Practically, you don’t need a fancy architecture on day one. You need turn polarity, stage labels, and a simple aggregation that respects where you are in the journey—and who is speaking at the end.
The Hidden Costs of Noisy Ticket Labels
Noisy ticket labels waste time, misdirect engineering, and erode trust in your reporting. Misclassification turns recoveries into “failures,” and sampling hides the rare but costly breakdowns. Quantify the cost, then fix the scoring so your priorities match reality.
Misprioritization that burns cycles
Let’s pretend 30% of tickets open hot but end with a clean fix and a neutral or positive final customer turn. A static classifier stamps them “negative” and your dashboard lights up. Product spins up a “fix the sentiment” initiative that targets the wrong problem. Engineering ships changes that don’t move retention. Everyone wonders why the needle didn’t budge.
Meanwhile, the truly unresolved threads—late-stage escalations with no closure—aren’t prioritized because they were fewer in count and blended into the same negative bucket. That’s the misprioritization tax. It’s not a rounding error; it’s weeks of effort that could have gone to issues that actually hurt renewals.
Stage-aware sentiment flips this. You’ll see unresolved negativity separated from recoveries, so the roadmap chases problems that actually burn trust.
Measurement gaps that hide false negatives
Sampling and score-watching create a false sense of certainty. If you review 10% of 1,000 tickets at three minutes each, that’s five hours for a partial view that can miss exactly the failure pattern you need to catch. Scale that to 100% and you’re at 50 hours—time you don’t have. So teams compromise and debate representativeness instead of acting.
Score-only dashboards don’t tell you why. They can’t tie a spike to a stage or a driver, and they can’t separate “productive friction” from “we never solved it.” That’s how false negatives hide in plain sight. You think all negatives are the same; they aren’t.
Full coverage with stage context changes the math. Now the outliers pop, and you can drill into exactly the threads that failed to resolve.
What a proper evaluation looks like
Build a gold set at the ticket level with stage labels and final outcomes before you ship anything. Measure ticket F1, precision, and recall per class, and pay special attention to negative→neutral flips on resolved tickets. That’s where most static models stumble. Compare cohorts over time and run significance tests so you know improvements are real, not noise.
Make every metric traceable to example tickets. If someone asks “show me,” you click into transcripts. It’s not academic overkill—it’s how you earn trust. If you want a quick primer on tradeoffs in sentiment practice, this practical overview from Thematic is a useful reference when aligning stakeholders on what “good” looks like.
Want a faster path to auditability without wrangling spreadsheets? Learn More.
The Frustration You Feel When The Dashboard Lies
A red spike that later turns out to be fine is more than a reporting error—it’s a credibility hit. Every walk-back makes it harder to rally the room next time. The fix isn’t “better caveats.” It’s labels that match the journey, not the loudest moment.
The escalation that derails your afternoon
You see a spike, call a huddle, and mobilize. Two hours later you discover most of those threads ended with successful resolutions and calm customer closes. Now you’re unwinding urgency, and the team is annoyed. Leadership is less patient next time. This is preventable.
When sentiment respects stages and outcomes, your alerts fire for unresolved failures, not for early volatility. You’ll still move fast—just on the right things. Your afternoon stays intact. More importantly, your credibility does too.
Who trusts a metric they cannot audit?
If a metric can’t be traced to the ticket-level evidence, the meeting stalls at “show me.” People don’t argue with quotes. They argue with abstractions. Build transparency into the workflow so anyone can open the transcript, see the stage timeline, and confirm the final label matches the end of the story.
Once the room can audit the number, debates shift from “is this real?” to “what do we do?” That’s the point.
A Practical Workflow For Conversation-Stage Sentiment
A practical workflow starts with a clear stage schema, then extracts turn-level signals you can trust, and aggregates them with recency and outcome in mind. You don’t need a research lab—just disciplined setup, validation, and a way to click from chart to transcript.
Define stages and write annotation instructions
Start with stages that mirror your process: opening, triage, troubleshooting, escalation, resolution, post‑resolution. Write concise guidelines for each with positive and negative examples, plus edge cases like multi-issue threads and handoffs. Make “final customer turn + documented fix” explicit so labelers know what to prioritize.
Pilot with 50–100 tickets. Measure inter‑rater agreement so you’re not fighting definition drift later. Expect to revise the schema once; it’s normal. The goal is consistency, not perfection. Once your raters align, the model has a fighting chance to learn what “good” looks like.
Keep the rubric short. People remember clear rules, not encyclopedias.
Extract turn‑level signals that matter
For each turn, capture who’s speaking, polarity, intensity, and the presence of resolution phrases. Normalize greeting/closing fluff and handle negation carefully—“not helpful” isn’t “helpful.” Add structural features like time gaps, turn index, and escalation indicators. That’s your minimum viable context.
Domain language matters. Build a small lexicon of resolution cues—“credit applied,” “verified fix,” “access restored”—sourced from your transcripts. Train polarity on your domain examples rather than borrowing off-the-shelf lexicons that don’t understand your product or policies. You’ll get fewer false positives from polite but unhappy enterprise customers.
This is where accuracy jumps without complexity. Right features, right data.
Aggregate with outcome‑aware weighting and recency
Use a weighted scheme that prioritizes what happened near the end and what outcome was recorded. Down‑weight opening and triage turns; up‑weight resolution and post‑resolution. Add a positive offset for resolved tickets where the final customer turn is neutral or positive. Add a negative offset for unresolved or escalated endings.
Build rule-based fallbacks for short tickets and missing stages so the model degrades gracefully. Then test on escalation-heavy subsets to ensure you’re not masking real failures as “progress.” Want to ground your measurement approach? This guide to measurement reliability is a good companion when you’re deciding thresholds and agreement criteria.
How Revelir AI Operationalizes This End To End
Revelir AI turns this methodology into a daily workflow by processing 100% of tickets, generating core metrics, and linking every chart to the exact transcripts behind it. You get structured fields for sentiment, churn risk, effort, tags, and drivers, plus the click-through evidence to keep everyone aligned.
Full coverage, metrics engine, and traceability working together
Revelir AI ingests your support conversations via helpdesk integration or CSV and processes 100% of them—no sampling. Each ticket gets core AI Metrics like Sentiment, Churn Risk, and (when applicable) Customer Effort, along with AI-generated raw tags that roll up into canonical tags and drivers. In practice, you can pivot by driver or tag to see where negative sentiment clusters, then click a count to open Conversation Insights for the exact tickets.
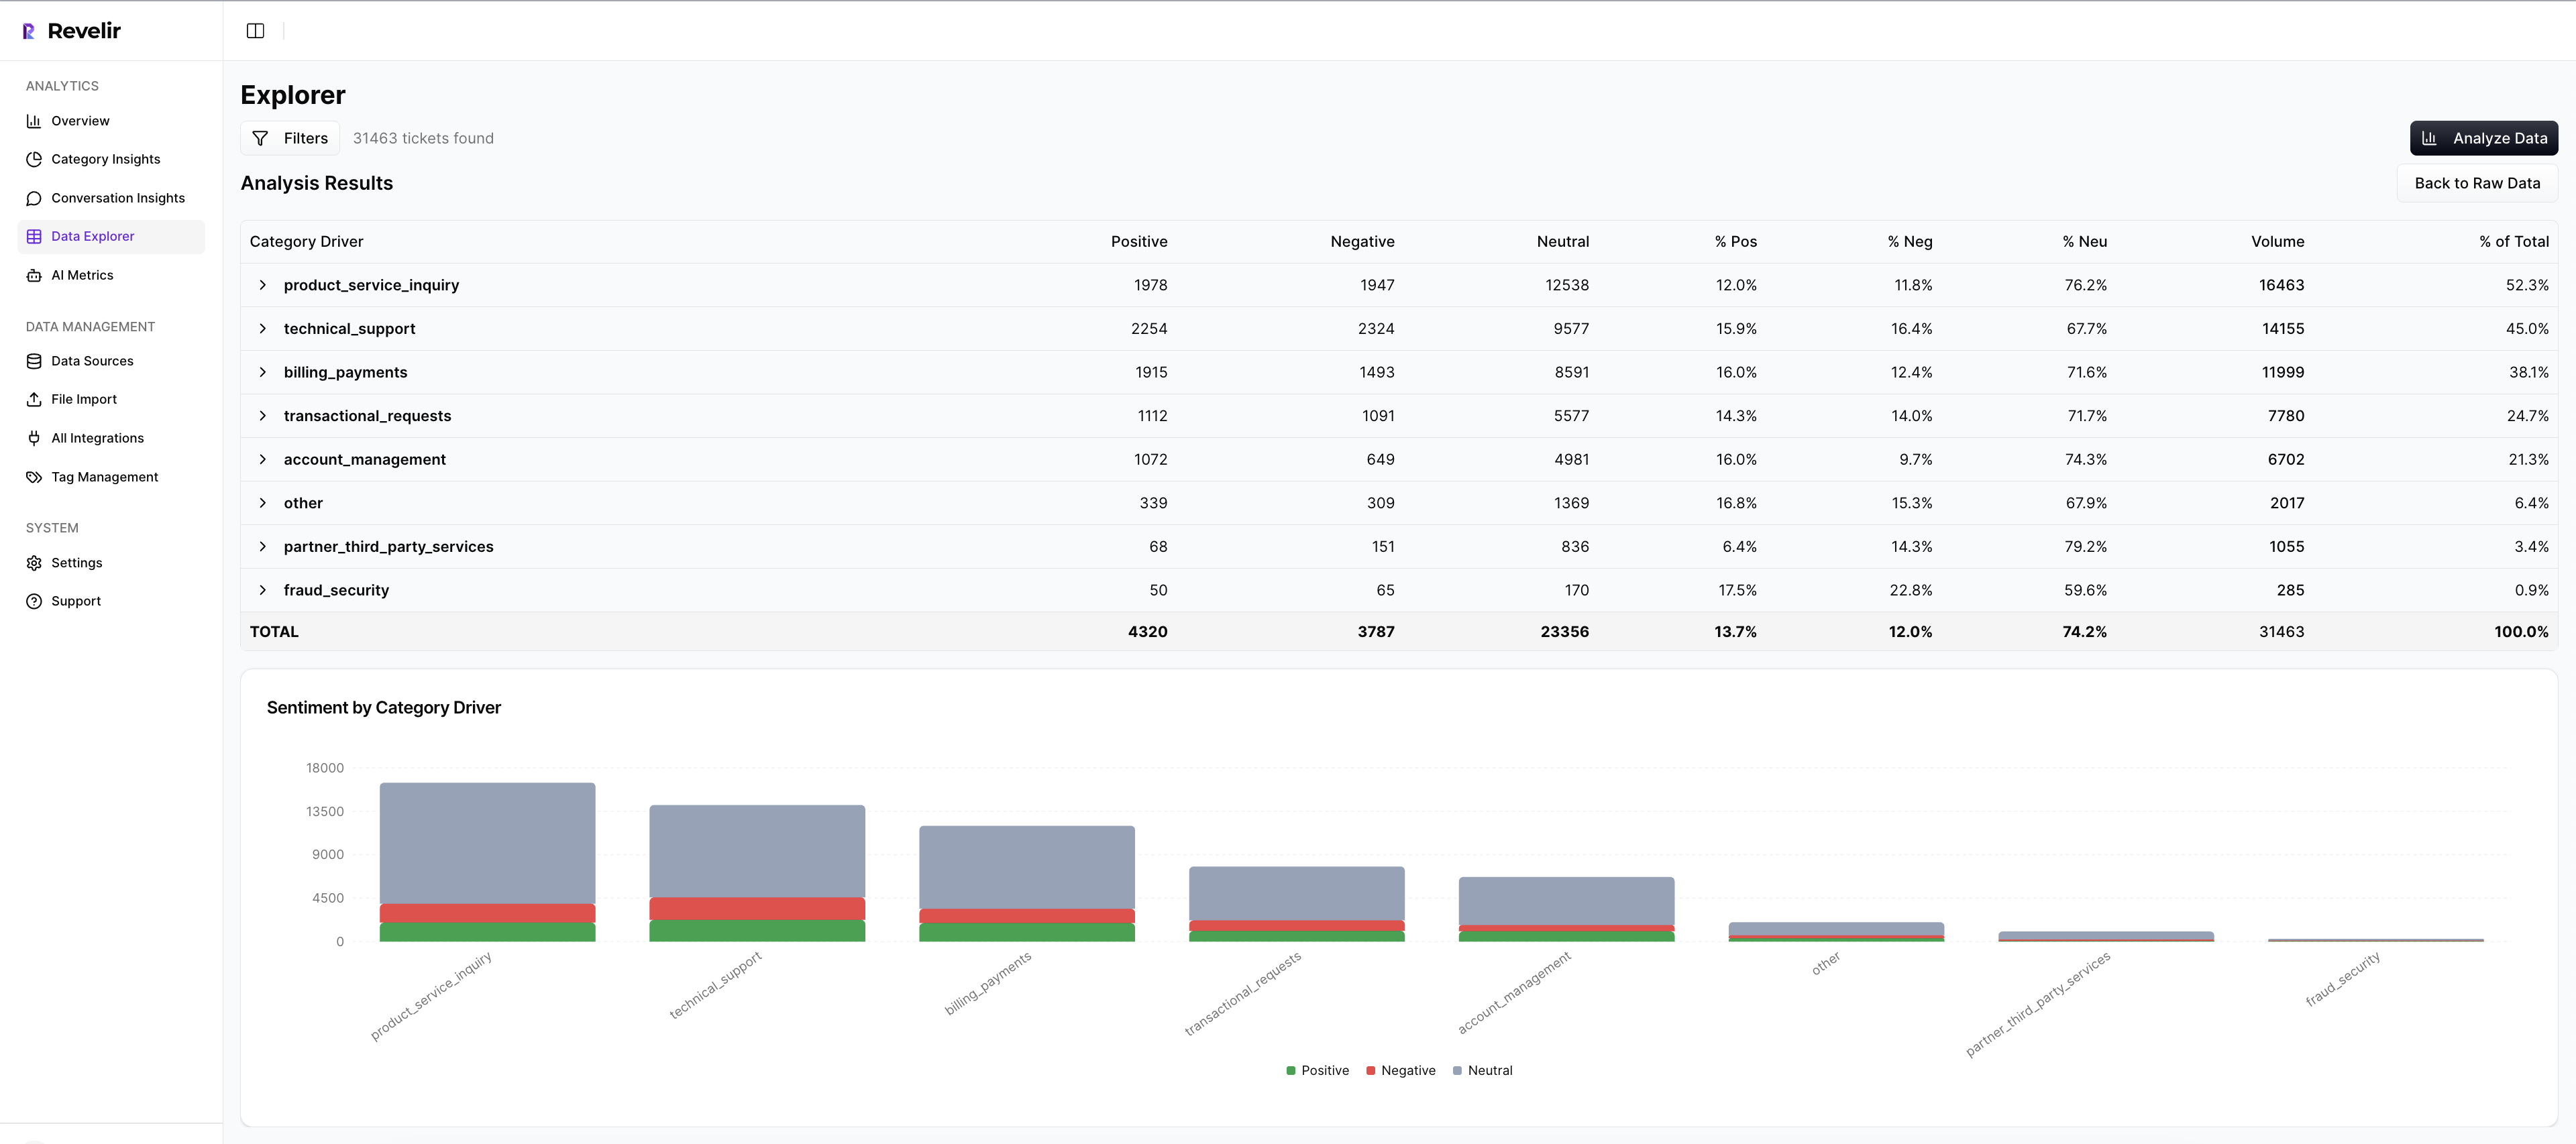
That click-through matters. It’s how you avoid the “show me the example” stall and validate that late-stage turns and outcomes match the top-line label. Data Explorer acts like a pivot table for tickets, while Analyze Data groups metrics by drivers or categories so you can see patterns in seconds. The moment something looks off, you’re one click from the transcript, the AI summary, and the metrics attached to that ticket.
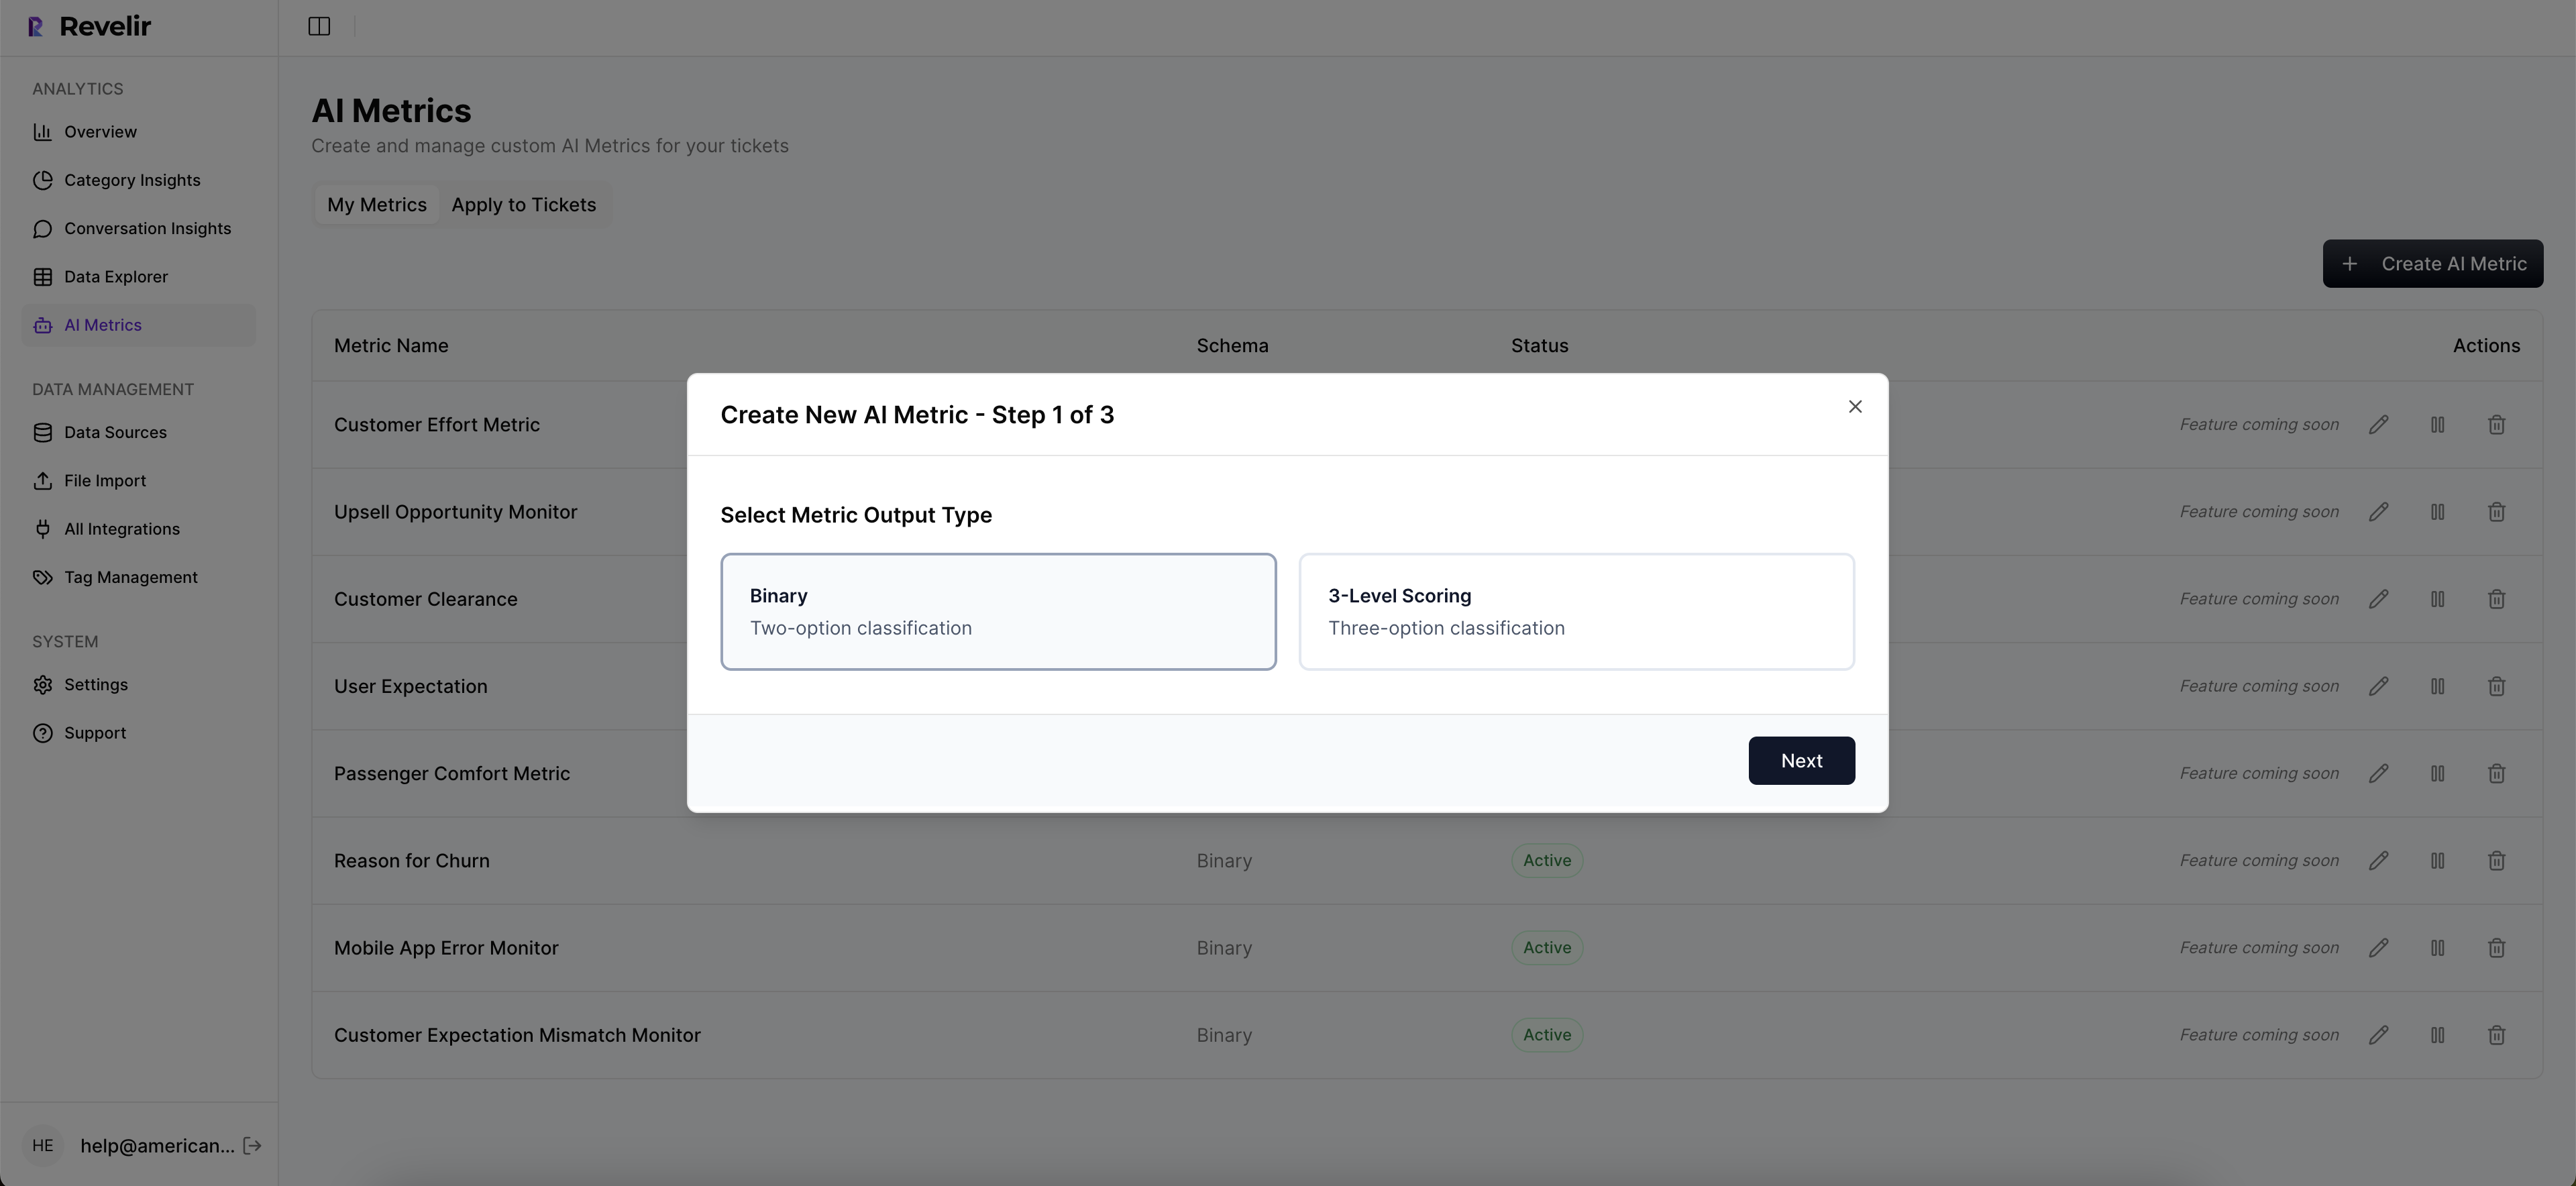
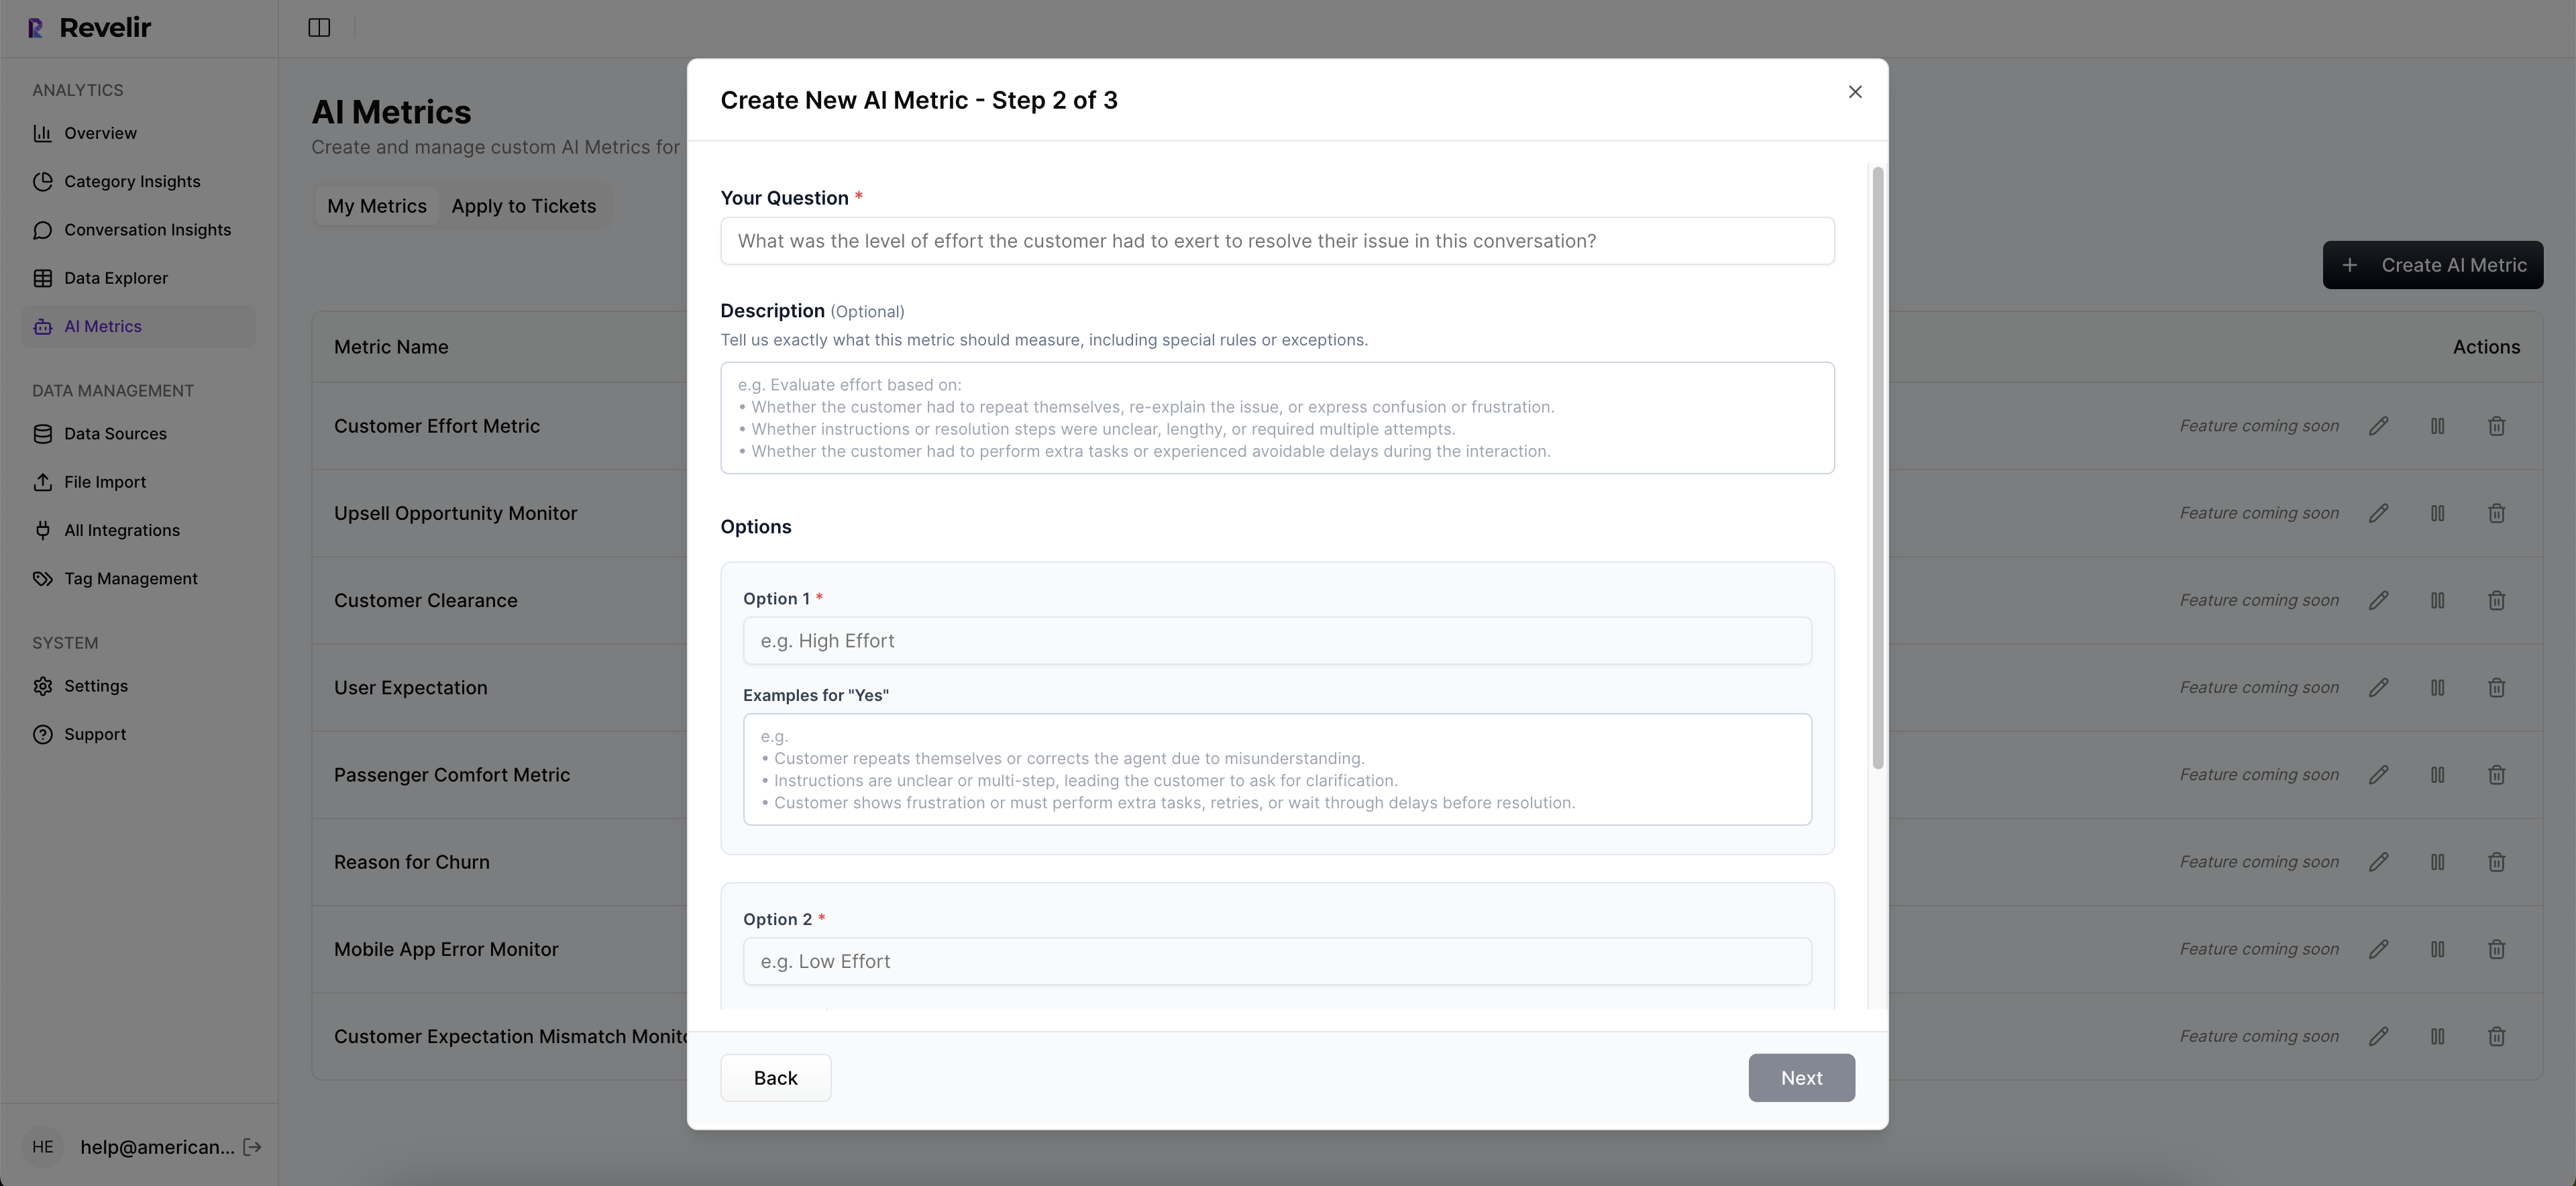
Revelir AI also supports Custom AI Metrics you define—so you can add your stage schema, escalation presence, and a final stage-aware sentiment label as first-class fields. Now stage, outcome, and sentiment live side by side for slicing, trend tracking, and leadership reporting. This is how you eliminate the misprioritization tax we walked through earlier and replace sampling debates with evidence-backed decisions.
If you want to validate this on your own data without rebuilding pipelines, it’s straightforward. Load a slice, define the stage and outcome metrics, and let Revelir AI score every conversation using your definitions. Then use saved views in Data Explorer to monitor segments like unresolved tickets, escalation-heavy threads, or drivers with high churn risk signals. When you present the findings, you can jump from trend to transcript in one move—no fragile spreadsheets.
Want to see the workflow end to end with your team’s questions in mind? See how Revelir AI works.
Conclusion
Static sentiment tells the loudest part of the story. Stage-aware sentiment tells the truth at the end of it. When you score turns, add stage context, and weight for recency and outcome, your “negative” label finally means “this failed,” not “this started hot.” That shift protects your roadmap from phantom fixes, your afternoons from false alarms, and your credibility in the room where trade-offs are made.
The playbook is clear: define stages, capture the right signals, aggregate with outcome in mind, and insist on traceability from chart to quote. Whether you build it or use a tool to operationalize it, the result is the same—better priorities, fewer surprises, and decisions backed by evidence instead of anecdotes.
Frequently Asked Questions
How do I analyze negative sentiment trends over time?
To analyze negative sentiment trends using Revelir AI, start by opening the Data Explorer. Apply filters for the date range you're interested in, then filter by sentiment to select 'Negative'. Next, use the Analyze Data feature to group by 'Category Driver' or 'Canonical Tag'. This will help you see which specific issues are causing negative sentiment over time. You can also click on the numbers in the results to drill down into the underlying tickets for more context. This approach ensures you get a comprehensive view of the sentiment trends and can identify actionable insights.
What if I want to track churn risk for specific customer segments?
To track churn risk for specific customer segments in Revelir AI, first, use the Data Explorer to filter tickets by customer segment, such as 'Plan = Enterprise'. Then, apply an additional filter for 'Churn Risk = Yes' to isolate high-risk accounts. After filtering, click on the Analyze Data button and select 'Churn Risk' as the metric to analyze. Group by 'Driver' or 'Canonical Tag' to understand which issues are most associated with churn risk in that segment. This method allows you to prioritize follow-ups and address potential issues proactively.
How do I validate insights from my analysis?
Validating insights from your analysis in Revelir AI is straightforward. After running an analysis in the Data Explorer, click on any segment count to access the Conversation Insights. This will show you the list of conversations behind the metric, including full transcripts and AI-generated summaries. Review these conversations to ensure that the patterns you observed in the analysis match the actual customer feedback. This step is crucial for building trust in your insights and ensuring that your decisions are based on solid evidence.
Can I create custom metrics for my specific needs?
Yes, you can create custom metrics in Revelir AI to match your specific business needs. To do this, navigate to the settings where you can define your custom AI Metrics. Specify the criteria and possible values for your metrics, such as 'Upsell Opportunity' or 'Reason for Churn'. Once defined, these custom metrics will be computed for each conversation and made available in the Data Explorer. This flexibility allows you to tailor the insights to your unique operational context and strategic goals.
When should I use the Analyze Data feature?
You should use the Analyze Data feature in Revelir AI whenever you need to answer specific questions about your customer support data. For example, if you're trying to understand what drives negative sentiment or identify high-effort interactions, this feature allows you to group and analyze metrics like Sentiment, Churn Risk, or Customer Effort Metric. It’s particularly useful for spotting trends and patterns that require deeper investigation. Running these analyses regularly can help you stay on top of customer sentiment and operational issues.