

You don’t lose customers in a spreadsheet. You lose them in the threads where people hint, hedge, and finally say, “We’re not getting value.” Scores react to that story. Conversations write it. If you’re only sampling tickets and tracking CSAT/NPS, you’re late and you’re guessing.
Here’s the hard part. Churn intent is seldom explicit. It shows up as frustration loops, repeated contacts, policy pushback, and “let’s pause renewal” whispers. That’s why conversation-first churn modeling matters. You start with transcripts, not scores. You anchor every insight to examples, not vibes. Decisions get faster because evidence ends arguments.
Key Takeaways:
- Build churn detection from complete transcripts, then corroborate with CSAT/NPS
- Prioritize traceability over marginal accuracy, click from metrics to quotes
- Use a hybrid tag system (raw + canonical + drivers) to stabilize features
- Quantify the real costs of sampling and score-only dashboards
- Operationalize with slice-level monitoring and auditable examples
- Let AI do the coverage; humans verify a handful for “does this make sense?”
Why Your Churn Strategy Lives Inside Conversations, Not Scores
Churn strategy belongs inside transcripts because that’s where risk emerges as language, not a lagging score. Full-population analysis catches early signals, frustration cues, downgrade talk, policy friction, that surveys miss. For example, a login loop across three tickets won’t tank CSAT yet, but it’s a churn accelerant you can stop.

Seeing Signals Your Surveys Can’t
Surveys are tidy. Conversations are messy and revealing. Real churn intent is scene-setting: “We’re pushing go-live,” “Billing feels off,” “We keep getting locked out.” You’ll miss that nuance in small samples and trailing scores. You won’t miss it when every ticket is processed and labeled.
That’s the point. Commit to 100% coverage so low-volume, high-severity patterns don’t hide. Use conversation metrics, sentiment, churn risk, effort, raw tags rolled into canonical tags and drivers, as your system of record. Then corroborate with CSAT/NPS. Scores are helpful. They’re not the strategy. As HBR’s work on effort underscores, lower friction beats delight when it comes to loyalty, and you only see friction by reading the room, not the score alone. See Stop Trying to Delight Your Customers and Zendesk on Customer Effort Score.
Treat Transcripts As Your Source Of Truth
If your process starts in a BI tool instead of the queue, you’re optimizing downstream. Start upstream. Treat transcripts as first-class data. Parse the full thread. Attach plan tier, region, channel, and product area. Let AI generate raw tags, then stabilize them into canonical tags and drivers leaders recognize.
Now traceability matters. When the CFO asks, “Where’d this 18% churn-risk spike come from?” you click the metric and open three tickets in seconds. No scramble. No stitched doc. Just quotes that make the trend real. That’s how you keep trust while you iterate.
Ready to skip the theory and see it live on your data? See how Revelir AI works.
Reframing The Problem: Optimize For Evidence, Not Just Accuracy
The real problem isn’t model accuracy in a vacuum. It’s the lack of verifiable evidence attached to every claim. Without examples you can open in the room, your “AUC 0.91” won’t move a roadmap. Leaders fund proof they can read.

Fix Labeling By Grounding It In Tickets
Most churn projects label by renewal outcome and stop. That’s useful, but it ignores why churn risk surfaced in the first place. Instead, derive labels directly from conversation evidence. Mark explicit churn mentions, refund requests, downgrade talk, unresolved-contact streaks, and escalation chains. Tie each label to ticket IDs and timestamps. Keep label provenance alongside the model.
This makes reviews practical. When a slice-level metric looks odd, say, high churn risk in onboarding for Enterprise, you click into three representative tickets. Product sees the exact message where “value stalled” shows up. CX sees the loop causing effort. Everyone sees the same story and the same receipts. Trust goes up. Rework goes down.
Build A Hybrid Feature Store That Leaders Can Trust
A stable feature store is part data, part language. Use raw tags for discovery, they surface emerging issues humans don’t think to tag. Then consolidate to canonical tags and drivers for clarity and reporting. Blend in sentiment and effort. Add embeddings for nuance, but never at the cost of traceability.
This hybrid lets you evolve without breaking trend lines. When language shifts (“seat limits” becomes “usage cap”), update mappings so future tickets roll up cleanly. Keep a small set of custom metrics for domain specifics, “reason for churn,” “expectation mismatch,” “downgrade risk.” Rerun grouped analyses and validate with examples. The goal isn’t perfect labels. It’s consistent, auditable, “makes sense” patterns leaders will act on.
The Costs You Cannot See Until You Measure With Evidence
Sampling and score-watching feel efficient until they don’t. The costs show up as missed signals, meeting detours, and generic fixes that don’t stick. By the time the score moves, the decision window closed.
The Quarter You Miss Churn Signals
Let’s pretend you handle 1,200 tickets a month. You sample 10% at three minutes each. That’s six hours monthly and still a partial view. The critical pattern, low-volume, high-severity onboarding friction in Enterprise, slips by. Two preventable churns later, the cost dwarfs the “saved” analysis time.
The ripple effects are worse. You launch broad “improve CSAT” campaigns because the score dipped, not because you know why. Engineering picks the wrong fix. CX carries the escalations. Finance starts asking harder questions. Evidence-backed coverage breaks that cycle because the signals are visible early and traceable to quotes, not vibes.
The Rework Tax Without Receipts
No receipts, no green light. You present a churn-risk trend. Someone asks for examples. The meeting stalls, and the next week is a scramble to compile transcripts. You redo the analysis to match the anecdotes. It’s frustrating rework, and it burns trust.
When every metric links to real tickets, review becomes quick verification. Open three conversations, read the summaries, and align. The difference shows up in cycle time and confidence. You’re not arguing about representativeness. You’re deciding a next move the room believes.
Still dealing with sampling and ad-hoc evidence hunts? There’s a simpler way. Learn More.
When Risk Hides In The Queue, Humans Feel It First
You know the feeling. Slack pings at 3am. A CSM flags “concerning language.” These moments aren’t rare; they’re the system telling you where to look. Give yourself a way to see it early and show it clearly.
The 3am Incident No One Saw Coming
An enterprise account hits a login loop. Three tickets in a week. Sentiment goes negative, effort spikes, and the customer starts asking about contract terms. In a volume dashboard, it blends into noise. In a conversation-first view, the pattern lights up under Account Access and Onboarding drivers.
Then the fix is obvious. Filter by plan tier, open three transcripts, capture the blocked step, and route a targeted change. You avoid the fire drill and the Monday finger-pointing because the evidence is already on screen, attached to the exact conversations that made the metric move.
When Your Biggest Customer Hints At Leaving
Big customers rarely say churn. They ask sideways questions and go silent. Raw tags catch the semantics. Canonical tags group the signals leaders understand. Churn risk flips to “Yes,” and your CSM opens a verified thread of quotes to guide outreach.
That’s the difference between guessing and acting. You intervene with context instead of “just checking in.” You propose specific remediation backed by the words they used. And you measure the outcome in reduced effort and improved sentiment the following week.
Build A Conversation-First Classifier With Traceable Evidence
A defensible churn model is simple to describe and easy to audit. Define label rules you can show, features leaders understand, and review workflows that click into real tickets. Accuracy matters. Receipts matter more.
Define Churn Signals And A Labeling Strategy You Can Defend
Start with a hierarchical plan. First, explicit churn statements (“we’re canceling,” “not renewing”). Second, proxy signals (refund requests, downgrade discussions, “paused rollout”). Third, operational context (repeated unresolved contacts, escalation chains, multi-ticket effort spikes). Store label provenance, ticket IDs, timestamps, rules triggered, next to each example.
This creates a shared rubric across CX, product, and data science. In model review, you’re not debating abstract thresholds; you’re reviewing concrete excerpts. When stakeholders ask “show me,” you do. In less than a minute. It’s how you keep alignment as the model evolves.
Ingest And Normalize Transcripts Without Losing Context
Parse the full message thread, not just the last reply. Preserve speaker roles, timestamps, and channel. Attach known fields, plan tier, region, product area, so you can do slice-level checks later. Deduplicate and normalize tags while keeping raw variants for discovery.
Keep a consistent transcript format for embeddings and sequence features. Store summaries for fast scanning. This balance lets you move between macro patterns and micro evidence without rebuilding pipelines each time a question changes. It’s how you answer “what’s going on” and “show me where” in the same session.
Engineer Features Leaders Understand (And You Can Explain)
Blend three layers. One, language features: embeddings and keyphrase hits to capture nuance. Two, structured signals: sentiment, effort, canonical tags, and drivers to anchor reporting. Three, behavioral counts: negative-sentiment streaks, multi-contact unresolved windows, number of escalations per account.
Keep a feature dictionary that maps each model feature to plain-English descriptions and example tickets. Short sentence, clear meaning. “Three contacts without resolution in five days, Enterprise plan.” You’re not just building a model. You’re building shared understanding.
For handling class imbalance and thresholding, align the math to the moment. Calibrate for intervention capacity and audit decisions during reviews. See scikit-learn guidance on class imbalance for practical levers. And when you document how it works, borrow from Google’s Model Cards for Model Reporting to make assumptions and limitations explicit.
How Revelir AI Powers Evidence-Backed Churn Modeling End To End
Revelir AI processes 100% of tickets, turns conversations into auditable metrics, and lets you pivot from aggregate to transcript in one click. You get coverage, clarity, and receipts, without building classifiers from scratch.
Full-Coverage Ingestion And An Auditable Metrics Layer
Revelir connects via Zendesk or CSV to ingest complete transcripts, historical and ongoing, so your view is comprehensive, not sampled. Every conversation is enriched with raw tags, canonical tags, drivers, sentiment, churn risk, and effort. You can filter by any of these fields immediately.

The audit trail is built in. From any grouped metric, say, churn risk by onboarding driver, you click the count and open Conversation Insights to read the exact tickets. That traceability keeps stakeholders aligned. It also shortens reviews because the proof is attached to the number, not living in a separate doc you have to assemble.
Data Explorer And Analyze Data For Trusted Validation
Most of the day-to-day work happens in Data Explorer. You slice by driver, canonical tag, plan tier, or region. You add columns for sentiment, effort, and churn risk. You run Analyze Data to summarize patterns across dimensions, then jump straight into the underlying tickets to verify the pattern “makes sense.”

This pairing, aggregate summaries plus ticket-level validation, replaces meeting detours with quick checks. It’s an audit loop people actually use: see the trend, open the quotes, decide the next step. And because Revelir processes all tickets, your slices hold up when leadership asks for a different cut.
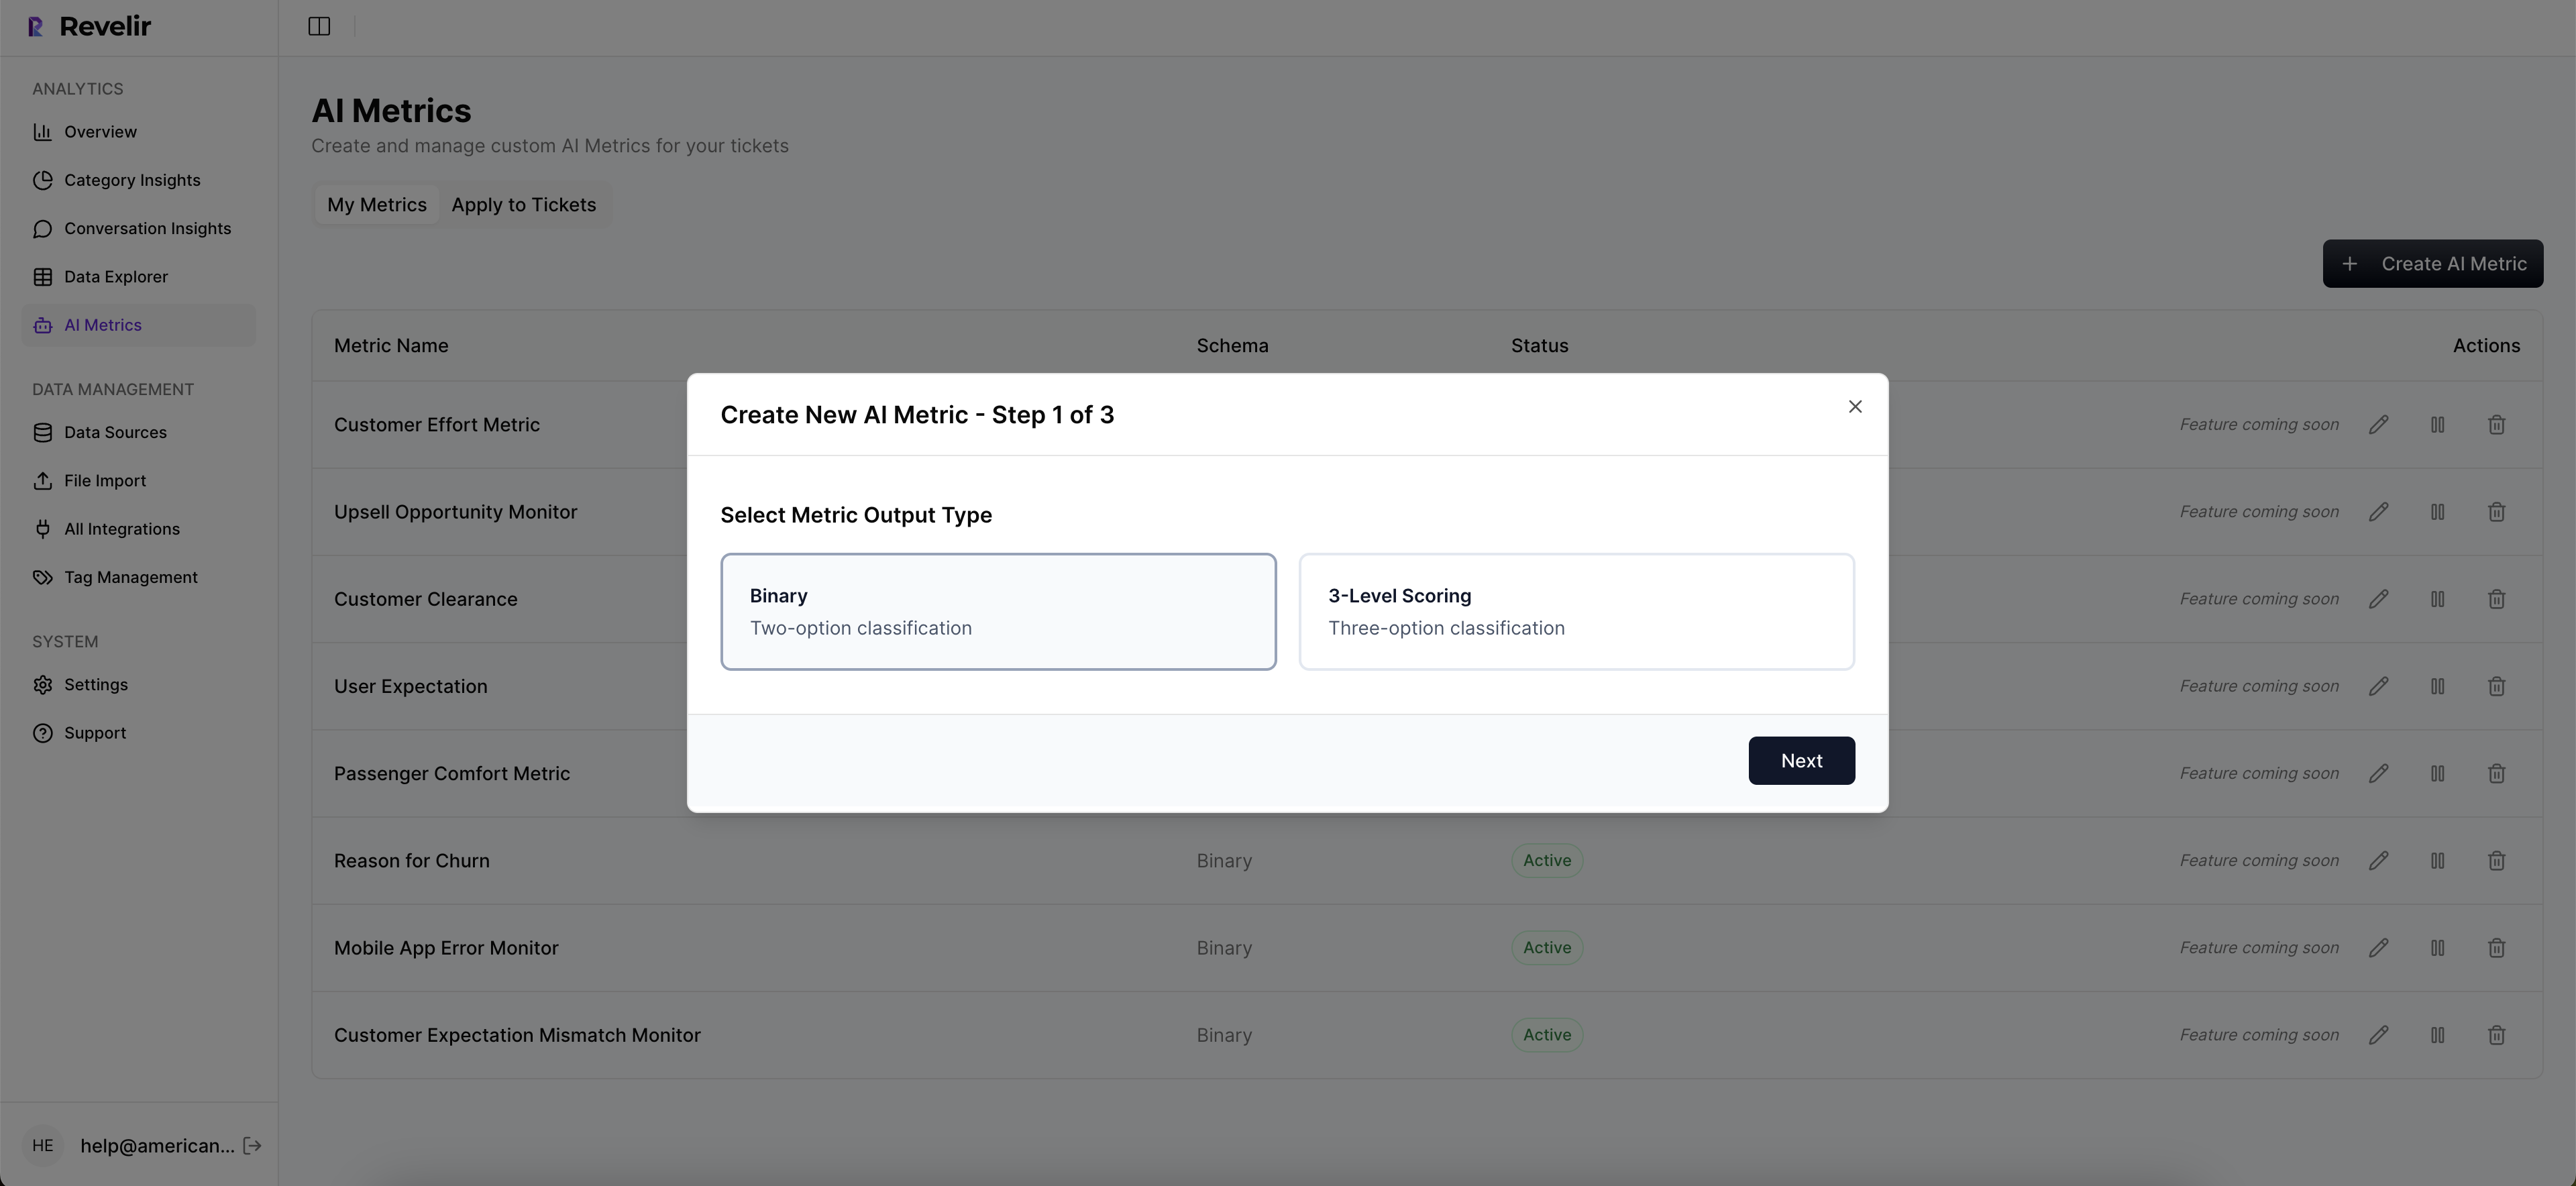
Custom AI Metrics And API Export To Operationalize
Every company’s language is different. Revelir lets you define custom AI metrics, like “reason for churn” or “expectation mismatch”, and apply them consistently across tickets. You can route high-risk accounts, enrich CSM workflows, and push metrics to existing dashboards through export, while keeping the conversation evidence inside Revelir for context.
This is how you move from modeling to operations without losing the receipts. Churn signals trigger action in your stack; model reviews stay grounded in transcripts; and post-change measurements show whether effort and sentiment improved where you targeted them.
Want to see this workflow against your own tickets? See how Revelir AI works. Ready to put it into practice? Get started with Revelir AI (Webflow).
Conclusion
If you want a churn model people trust, start where the risk actually lives: inside conversations. Measure 100% of them. Stabilize language with canonical tags and drivers. Favor traceability over marginally higher scores. Then make the evidence visible, fast.
Do that, and debates turn into decisions. CX, product, and finance stop arguing about anecdotes and start acting on shared proof. That’s the shift. Evidence first. Accuracy that stands up in the room. And a clear path from signal to fix you can verify next week.
Frequently Asked Questions
How do I analyze churn risk effectively?
To analyze churn risk effectively, start by filtering your dataset in Revelir AI. Use the 'Churn Risk' filter to isolate tickets flagged as high risk. Next, click 'Analyze Data' and select 'Churn Risk' as your metric. Group by 'Driver' or 'Canonical Tag' to see which issues are driving churn. This process helps you identify patterns and prioritize follow-ups with at-risk customers. Additionally, you can drill down into specific tickets using Conversation Insights to validate findings with real examples.
What if I want to track customer effort?
If you want to track customer effort, you can use Revelir AI's Customer Effort Metric (CEM). First, ensure your dataset includes sufficient conversational cues. Then, filter for 'Customer Effort' in the Data Explorer. You can analyze which categories generate high effort by grouping tickets accordingly. This will help you pinpoint workflows that may be causing friction for customers, allowing you to make necessary adjustments to improve their experience.
Can I customize metrics in Revelir AI?
Yes, you can customize metrics in Revelir AI to match your business needs. This is done through the Custom AI Metrics feature, where you can define specific metrics like 'Reason for Churn' or 'Upsell Opportunity.' Once defined, these metrics will be applied consistently across your conversations, providing you with tailored insights. This customization allows you to focus on the metrics that matter most to your organization and drive actionable insights.
When should I validate insights with conversation drill-downs?
You should validate insights with conversation drill-downs whenever you notice significant trends or patterns in your data. For instance, if you observe a spike in negative sentiment or churn risk, it's crucial to click into the affected tickets via Conversation Insights. This allows you to read the full transcripts and AI-generated summaries, ensuring that the metrics align with the actual customer experiences. Regular validation helps maintain the accuracy and reliability of your insights.
Why does Revelir AI focus on conversation transcripts?
Revelir AI focuses on conversation transcripts because that's where the true signals of customer intent and frustration reside. Unlike traditional methods that rely on sampling or score-based metrics, analyzing full transcripts allows you to capture early signs of churn risk, such as repeated issues or dissatisfaction. This approach enables you to make data-driven decisions based on real customer feedback, leading to more effective churn strategies and improved customer experiences.