

Most teams treat churn like a renewal event. They wait for the QBR, a dip in usage, or a last‑minute pricing fight to raise their hand. By then, you’re negotiating from behind. The real alarms fire inside your support queue days or weeks earlier, inside the messy, frustrating conversations nobody’s reading end to end.
Here’s the uncomfortable truth. Sampling ten tickets and staring at CSAT curves won’t tell you what to fix. It’s usually the subtle patterns, the login loops, the “still not resolved” back‑and‑forth, the “we’re evaluating alternatives” nudge, that add up to real risk. You need full coverage, repeatable signals, and proof you can show in the room without losing the room.
Key Takeaways:
- Move from sampling and score‑watching to 100% coverage with traceable evidence
- Triage with three inputs: churn risk, effort, and driver/canonical tag, then layer in account value
- Group by drivers to see root causes leadership recognizes (Billing, Onboarding, Account Access)
- Prioritize by volume × severity and segment SLAs by Enterprise, Mid‑Market, SMB
- Close the loop weekly: measure time to first response, time to resolve, and “saved at risk”
- Use a workspace built for this: filter, group, drill into transcripts, and export metrics into your stack
Why Waiting For Renewals Misses The Real Churn Alarm
Churn risk shows up first in support conversations, not renewal calls. Frustration cues, explicit churn mentions, and repeated drivers appear across the whole queue, not a 10% sample. For example, a spike in “account access” loops among enterprise admins is an early alarm you can act on this week.
The trap of sampling and score watching
Sampling feels responsible. It’s not. If you handle 1,000 tickets, reading 10% at three minutes each is five hours for a partial view that still misses the signal hiding in quieter threads. Same thing with score‑watching. A CSAT drop says “something’s wrong,” but not whether onboarding friction or billing changes are the issue.
The bigger problem is confidence. When you can’t trace a claim back to real quotes, you get stuck arguing anecdotes. Executives ask “Show me.” And nobody’s checking the transcript because you can’t get there quickly from the dashboard. The fix is boring but effective: analyze 100% of conversations, compute consistent metrics on each one, and keep the path to evidence one click away.
What is a churn signal you can trust?
A trustworthy churn signal is consistent, repeatable, and anchored to quotes you can open in seconds. You’re looking for a simple pattern: churn risk flagged “Yes,” effort labeled “High,” and a driver that explains the why, Billing, Onboarding, Account Access, not 200 raw tag variants. Then you cross‑check the transcript and nod. It tracks.
This is where disciplined grouping matters. Use drivers and canonical tags to convert messy text into language leaders recognize. Then layer in account value or segment so the triage reflects impact, not just volume. If you want a longer playbook view on early‑warning signals, this framing aligns closely with many churn prevention playbook approaches: clear triggers, immediate actions, and verifiable examples to keep teams aligned. Ready to see this working on your own data? See how Revelir AI works.
From Tickets To Root Causes You Can Action This Week
Root causes emerge when you group by drivers and canonical tags, not when you stare at volume charts. Drivers collapse noise into themes leadership recognizes, and canonical tags clean up the language. For example, “Billing & Payments” with high effort tells you where to look and what to say in the product meeting.

What traditional approaches miss in triage
Volume dashboards don’t tell you what to fix. At best, they tell you where to look. Manual tag hygiene helps, but it’s slow and inconsistent, one agent says “billing,” another says “payment failed,” a third says “fees.” You spend meetings normalizing terms instead of addressing root cause, and the queue keeps growing.
The gap is a structured layer between the raw transcript and the polished report. Drivers and canonical tags do that translation job. They let you say “40% of high‑effort tickets last week were under Billing, mainly fee confusion,” and then click to three representative conversations. It’s a small shift with outsized payoff: less debate, faster fixes, clearer accountability.
Drivers, canonical tags, and effort create operational context
Drivers show the big themes. Canonical tags tighten the language. Effort tells you how painful it felt in the moment. Put them together and the path to action clarifies. You can run a grouped analysis, churn risk by driver, effort by driver, and see the top rows that warrant attention this week, not next quarter.
That’s your triage list. Click into the examples to validate the pattern, capture quotes for context, and assign owners with confidence. If you want a complementary perspective on designing risk frameworks, the ideas here pair well with guidance on how to create a customer risk playbook: define triggers, assign roles, and keep the evidence close to the decision.
The Hidden Cost Of Slow Or Inconsistent Triage
Delay compounds risk and workload. Sampling delays detection, and inconsistent rules delay action because teams argue thresholds. Picture the math: five hours for a partial view vs. minutes for full coverage. The gap between those approaches shows up later as escalations, rework, and renewal pressure.
Let’s pretend: the math on sampling and delay
Let’s pretend your team handles 1,000 tickets a month. You sample 10 percent at three minutes each. That’s five hours. For a partial truth. To review 100 percent at that pace would take 50 hours, time nobody has. Meanwhile, the real churn signals sit in the queue, undetected, and the cost keeps compounding.
Now imagine you stopped sampling. Every conversation gets a consistent pass, churn risk, effort, sentiment, attached to drivers and canonical tags you can pivot in seconds. It’s usually the difference between “I think billing fees are a problem” and “Over the past 30 days, fee confusion drove 34% of negative sentiment and 40% of high‑effort tickets.” One starts debate. The other starts work.
How slow triage hits revenue and workloads
Every day a high‑risk ticket sits, resolution gets harder. Renewals become negotiations. Escalations pile up, and you burn hours on frustrated back‑and‑forth that should’ve been prevented. Those hours come out of roadmap progress and coaching. Multiply that by a month and you’ve invented a hidden tax nobody budgeted for.
What to do instead? Treat risk detection like a weekly production process, standard criteria, clear SLAs by segment, and a tight outreach loop that acknowledges the exact driver. Plenty of teams formalize this with structured runbooks, similar to guidance on developing and automating churn prevention playbooks. Still doing this manually? There’s a faster way. Learn More.
What It Feels Like When Risk Goes Unaddressed
Unaddressed risk shows up as human frustration first. The champion stuck in a login loop. The billing thread that drags on. CSMs find out too late, often in QBR prep. The fix is early alerting tied to evidence, so outreach happens while the customer still cares and before alternatives harden.
When a champion hits a login loop on Friday
An admin tries to log in. Loop, retry, loop. The ticket bounces between categories. Effort climbs with every handoff, and the weekend clock starts. By Monday, the champion is taking vendor calls because they don’t trust the experience anymore. You wanted that flagged as churn risk and escalated before the weekend ended. It wasn’t.
This is where traceability matters. If you can say “Account Access driver, High Effort, churn risk Yes, here are the quotes,” you create urgency without theatrics. Product sees the failure mode, support sees the gap, and CSM has a reasoned message instead of a scramble. Small win. Big impact on trust.
The 3‑week ticket that becomes a renewal cliff
A billing issue lingers. Each update adds frustration. The internal notes get longer than the help article. The CSM learns about it while prepping a QBR deck, not on day two when a timely call could’ve turned the tone. Now you’re managing a renewal cliff instead of a fixable hiccup.
In a full‑coverage, evidence‑backed world, that alert would’ve fired early with driver context. The outreach would reference the exact quote and propose a path to resolution. Your CSMs don’t need another dashboard; they need the why, a few recent lines from the transcript, and segment context. Give them that, and they move fast without guesswork.
A Production-Ready Triage Process That Runs Every Week
A durable triage loop has four parts: clear high‑risk criteria, segment‑specific SLAs, concise outreach by driver, and weekly measurement. Keep it simple, documented, and repeatable. For example, a rule that includes churn risk Yes or high effort, weighted by account value, and published timelines per segment.
Define high risk criteria across flags, ARR, and effort
Start by agreeing on what “high risk” means in your world. Use the signals you can compute on every ticket, churn risk flag, effort level, and driver/canonical tag, then layer ARR or segment. The goal isn’t perfection; it’s consistency. You want everybody triaging from the same rulebook, not reinventing criteria mid‑queue.
Write it down. “Include any conversation with churn risk equals Yes or effort equals High; weight by plan tier; drivers articulate the why.” Then sanity‑check it against a few transcripts. If the tickets you’d want to act on aren’t captured, adjust. This isn’t ceremony. It’s speed insurance, the thing that keeps work moving when queues spike. For additional structure ideas, see approaches to proactive risk churn mitigation.
Segment and prioritize with a three‑tier SLA matrix
Create fast lanes by segment. Enterprise, Mid‑Market, SMB. Define time to first response and time to close for high‑risk tickets in each. Use volume × severity to sequence work: Enterprise billing with high effort gets the shortest clock, then onboarding for Mid‑Market, and so on. Publish the matrix so frontline teams know the rules before spikes.
Then operationalize the human part. Build short outreach sequences by driver, Billing, Onboarding, Performance, with a first message that references the driver and a recent quote. Include a clear path to resolution. Keep it short. Fast personalization beats long templates that never ship. Close the loop every Friday: record outcomes (closed, pending, unresolved, saved at risk), and review movement week over week. If patterns shift, update canonical mappings or scripts accordingly. If you like a metrics lens, many of these KPIs mirror guidance in churn analysis focused on why customers leave.
How Revelir AI Operationalizes Churn Risk Triage From Signals To Actions
Revelir gives you full‑coverage processing with evidence‑backed traceability so you can act with confidence. Every ticket is scored for churn risk, effort, and sentiment, rolled up into drivers and canonical tags you define, and linked back to the exact quotes. For example, “19 churn‑risk tickets under Billing” is one click away from the transcripts behind it.
Full coverage processing and evidence backed traceability
Revelir processes 100% of your tickets, no sampling, and applies consistent AI metrics to each conversation: churn risk, customer effort, and sentiment. That eliminates blind spots and the “are we sure?” debate that slows action. Anywhere you see an aggregate, you can click straight into the filtered list of conversations with full transcripts and AI summaries.

This traceability matters in the room. When a CX leader says “30% of negative sentiment is from billing fees,” the evidence is already attached. Product can read the three quotes that describe the failure mode, and finance sees why the fix competes fairly for roadmap time. The result: fewer meetings about whether a problem exists, more decisions about what to fix.
Data Explorer and Analyze Data for fast grouping and drill downs
Revelir’s Data Explorer is where you work day‑to‑day. Filter by segment, sentiment, churn risk, or effort. Group by driver or canonical tag. Sort by volume or severity to find the hotspots. With Analyze Data, you can run structured aggregations, effort by driver, churn risk by category, and get an interactive table plus a stacked bar chart, all clickable down to the ticket level.
The speed here changes behavior. In minutes, you can move from “we have 42 high‑risk tickets” to “they cluster under two drivers with clear examples,” which feeds directly into the weekly triage loop. No manual exports. No stitching columns in a spreadsheet. Just a clean path from pattern to proof to owner.
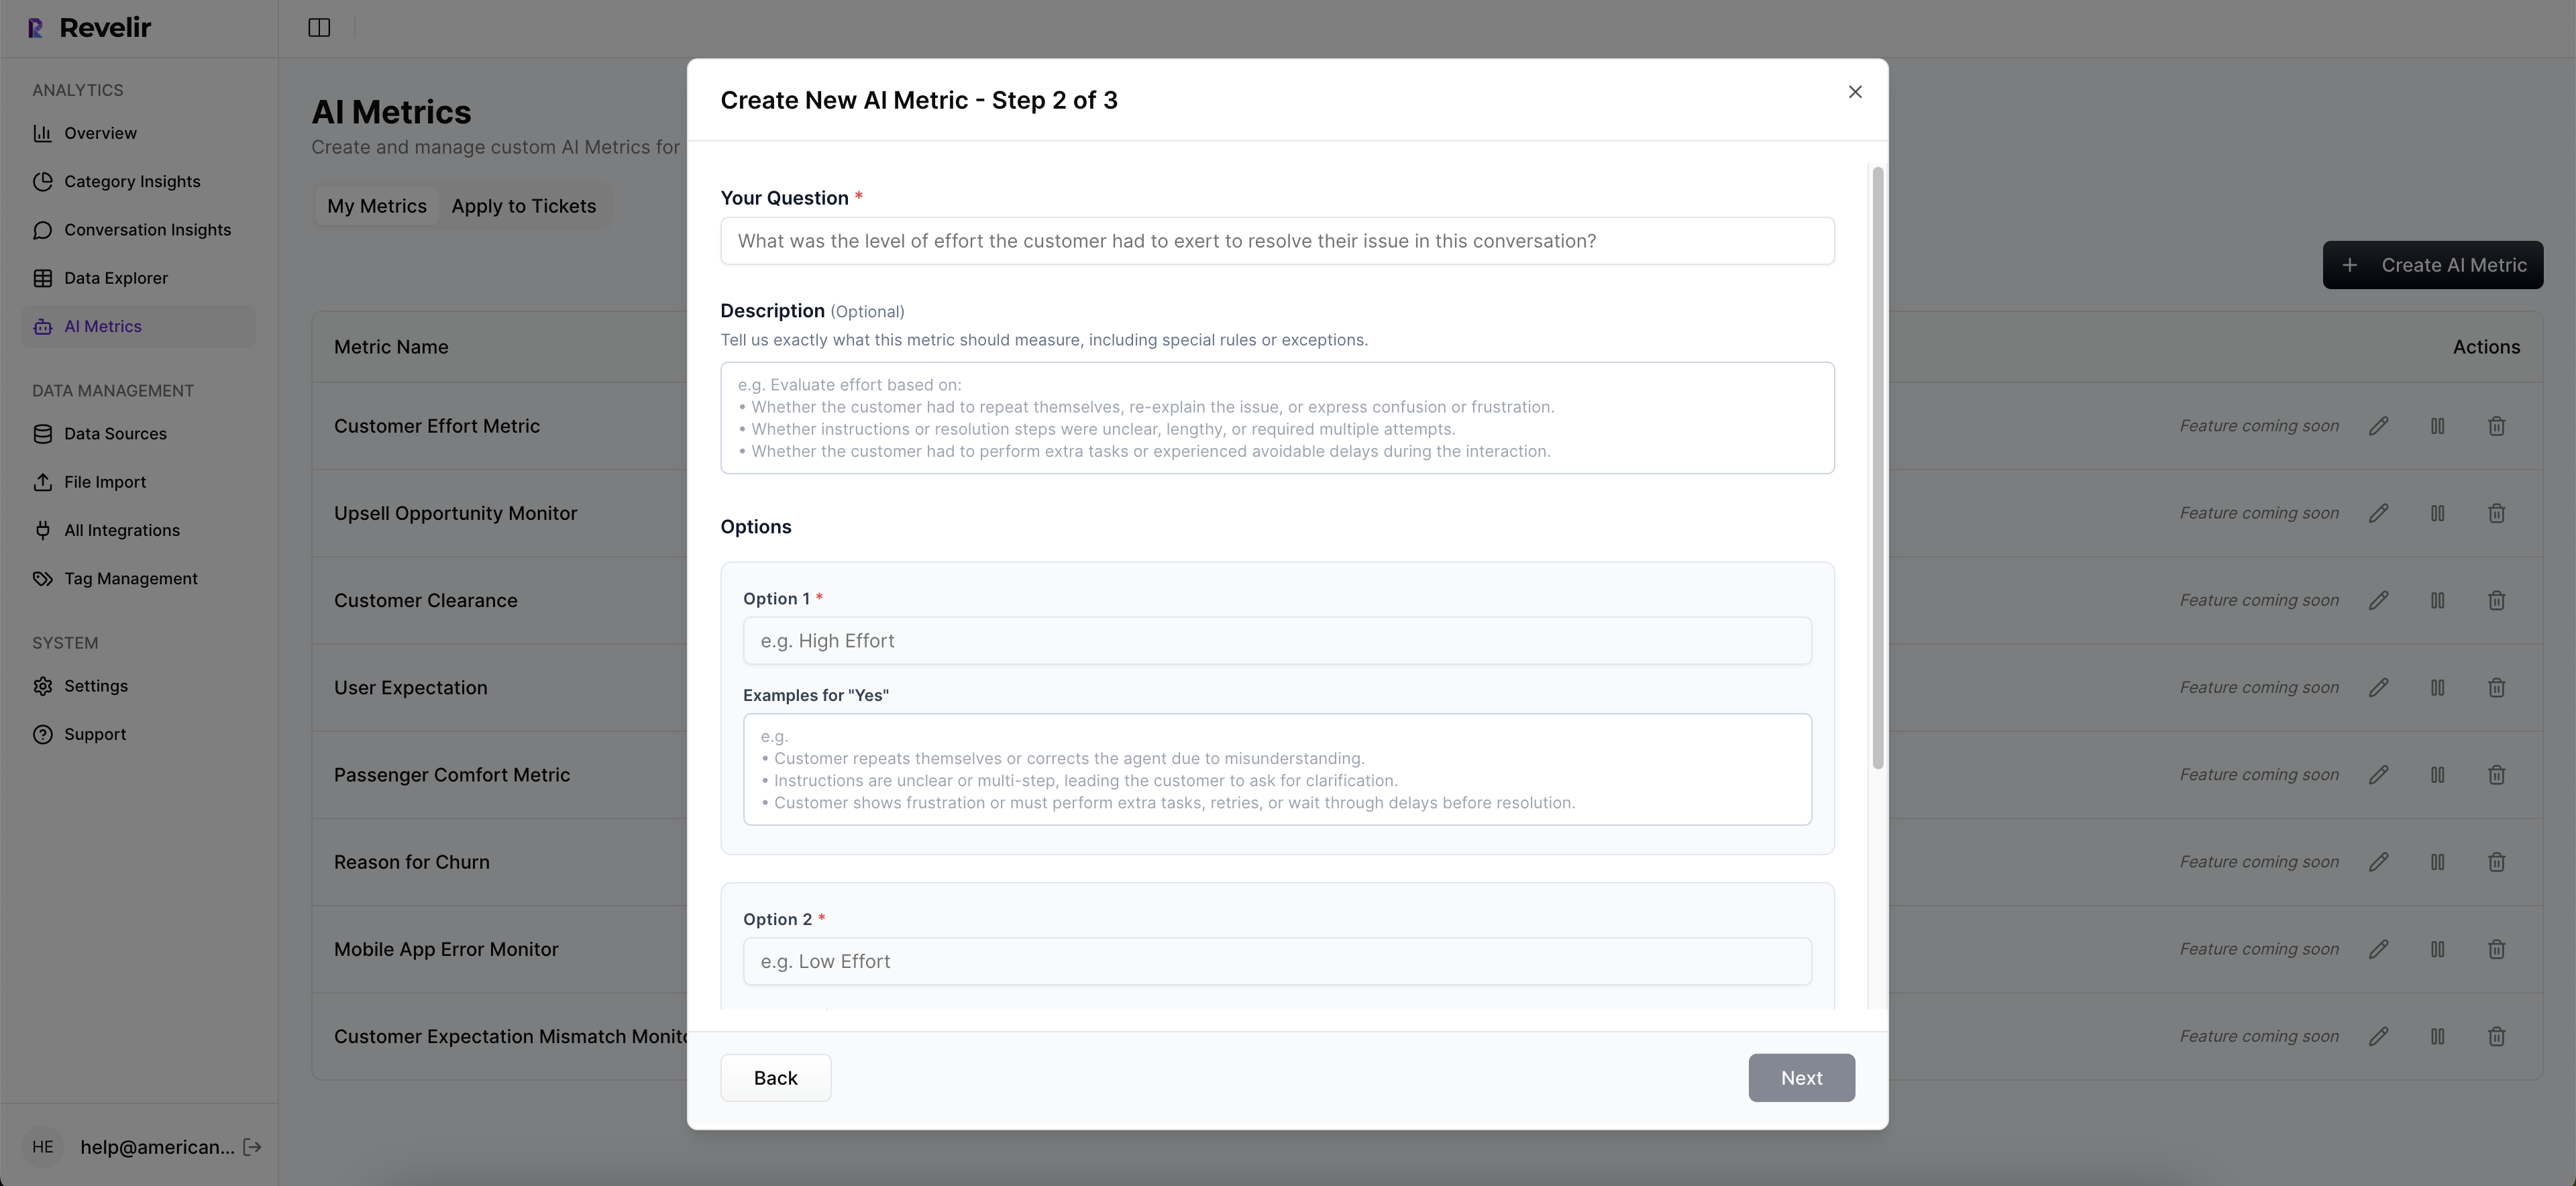
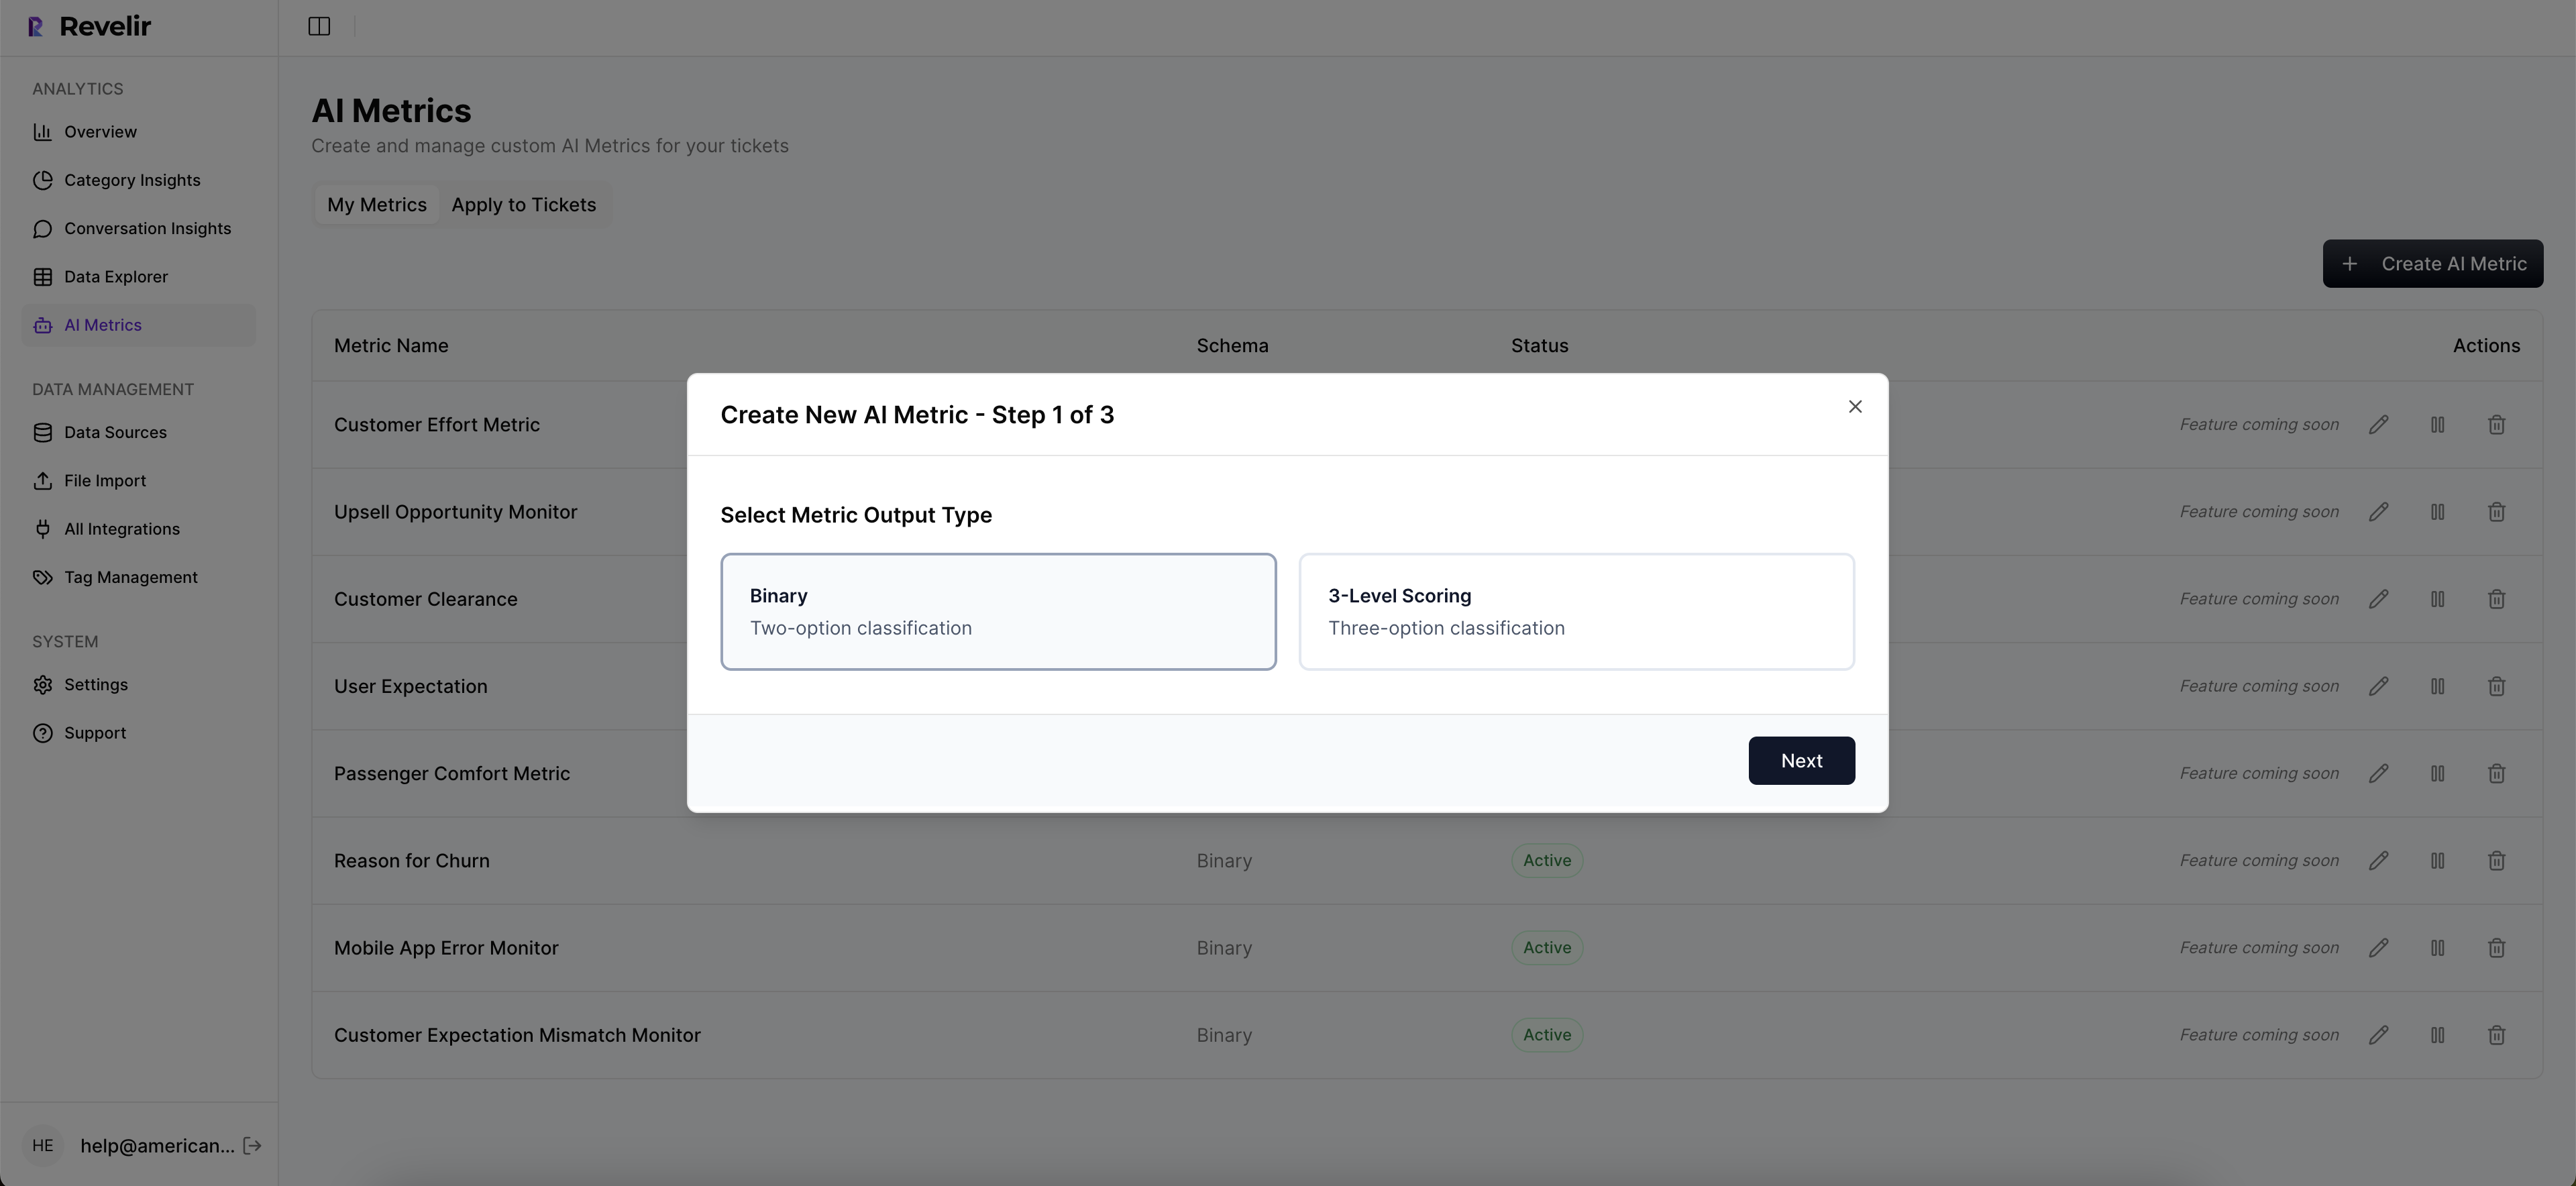
Custom AI Metrics and outcomes to track recovery
Every organization has language that matters locally. Revelir lets you define Custom AI Metrics, for example, “Reason for Churn” or a domain‑specific recovery outcome, and applies them consistently across conversations. Those fields become columns you can filter, group, and review alongside churn risk and effort.
This closes the feedback loop. You can track whether targeted outreach reduced effort or shifted sentiment for a particular driver, and whether a fix actually lowered churn risk for a segment. When the data matches what humans would say reading a handful of tickets, teams trust it. When it doesn’t, you click into examples and refine the model.
API export and repeatable views that connect to your workflows
Revelir also meets you where you work. Export structured metrics via API into your existing reporting or automation so alerts and tasks can run in your tools. Inside the product, document reusable filter sets, “Enterprise high risk,” “Onboarding high effort”, and use them in weekly reviews. It’s the boring, repeatable layer that keeps the triage loop humming.
If you prefer to validate on your own data before you change a process, that’s fine. Upload a CSV or connect Zendesk, run a slice, and decide next steps from your evidence. Let Revelir do the heavy lift on structure so your team can focus on decisions, not plumbing. Want to jump in? Get Started With Revelir AI (Webflow).
Conclusion
Churn triage isn’t a heroic save at renewal. It’s a weekly habit that starts in the support queue: detect risk early, size pain with effort, explain it with drivers, and click into quotes to build trust. When you stop sampling, standardize your rules, and keep evidence attached to every claim, triage turns into action, and more customers stick around.
CTAs (preserved): Learn More, Learn More, https://Learn More
Frequently Asked Questions
How do I identify top churn-risk drivers?
To identify top churn-risk drivers, start by using Revelir AI's Analyze Data feature. 1) Filter your tickets by 'Churn Risk = Yes.' 2) Select 'Churn Risk' as your metric and group by 'Driver' or 'Canonical Tag.' 3) Run the analysis to see which drivers are linked to churn signals. This will help you pinpoint the main issues causing churn and allow you to take proactive steps to address them.
What if I want to track customer effort over time?
You can track customer effort over time by utilizing the Customer Effort Metric (CEM) in Revelir AI. 1) Open the Data Explorer and filter tickets by 'Customer Effort = High.' 2) Use the Analyze Data feature to group by date and track changes in customer effort metrics. 3) Review the results to identify trends and areas needing improvement. This way, you can see if operational changes are effectively reducing customer effort.
Can I export metrics from Revelir AI?
Yes, you can export metrics from Revelir AI. After analyzing your data in the Analyze Data feature, you can use the export functionality to pull the metrics into your existing reporting tools. This allows you to integrate insights from your support conversations into your broader analytics stack, making it easier to share findings with your team and stakeholders.
When should I focus on resolving high-effort tickets?
You should focus on resolving high-effort tickets as soon as you identify them. Use Revelir AI's Data Explorer to filter for 'Customer Effort = High.' Once you have this view, prioritize these tickets based on their volume and severity. Addressing high-effort tickets quickly can improve customer satisfaction and reduce the risk of churn, as these often indicate underlying issues that need attention.
Why does Revelir AI emphasize 100% conversation coverage?
Revelir AI emphasizes 100% conversation coverage because it allows for complete visibility into customer interactions. By analyzing every ticket without sampling, you avoid missing critical signals of churn risk and frustration. This comprehensive approach ensures that insights are based on all available data, leading to more accurate and actionable metrics that can drive effective decision-making.