

You don’t fix messy tags with a spreadsheet sprint. You fix them with evidence, rules, and a workflow that won’t crumble when volumes spike or new issues appear. The pattern is predictable: heroic cleanup, short honeymoon, then drift returns and trust fades. If you’ve felt that, you’re not alone.
Here’s the better story. Treat raw tags like discovery fuel, not gospel. Promote only what leadership can actually understand. And tie every rollup to tickets people can open and read. That’s how you move a room from “Is this real?” to “What do we fix first?” It’s also where tools like Revelir AI earn their keep as the intelligence layer, not the helpdesk.
Key Takeaways:
- Clean, trusted tagging depends on evidence and governance, not one-time sprints
- Raw tags discover patterns; canonical tags clarify; drivers tell the “why”
- Codify mapping logic with normalization, precedence, and audit workflows
- Quantify the cost of noise to unlock prioritization and resourcing
- Make traceability a non-negotiable: every metric must link to real tickets
- Adopt a 7-step playbook and a monthly cadence to prevent drift
Why Tag Cleanups Fail Without Evidence and Governance
Most teams assume a one-time cleanup can restore order to tags and categories. It can’t, because the core problem isn’t mess, it’s missing rules, no ownership, and zero traceability back to tickets. When every aggregate ties to examples people can inspect, the tagging layer becomes credible and durable. Think “governed and inspectable,” not “cleaned once.”

Raw Tags Discover, Canonical Tags Clarify, Drivers Tell the Story
Raw tags are your discovery engine. They surface how customers actually describe problems, in their words, across the long tail. That’s gold for finding emerging issues and blind spots. But raw tags alone are chaos in a board deck. Canonical tags compress the noise into business language, Billing, Account Access, Performance, so leadership sees a stable, comparable view quarter over quarter.
Drivers do the storytelling. They cut across categories to explain why friction clusters where it does. When leaders ask, “Why is sentiment down among new customers?”, “Onboarding” as a driver communicates cause, not just location. The analog in SEO is canonicalization: you reduce duplicates so signals consolidate. Google’s guidance on consolidating duplicate URLs exists for the same reason, clarity beats fragmentation.
Here’s the thing. You need all three layers working together. Raw for discovery. Canonical for clarity. Drivers for narrative. Skip one and you’re arguing semantics instead of making decisions.
Why One-Time Cleanups Collapse Back Into Chaos
One-time cleanups fail because the rules don’t live anywhere systems can enforce. Mappings hide in ad hoc docs. Naming conventions live in someone’s head. Exceptions go undocumented. Then people change roles, new tags appear, and drift creeps back in quietly. Six months later, “Refunds” and “Billing Credits” are separate again.
The fix isn’t another spring cleaning. It’s governance. Put mappings in a single table with precedence and owners. Keep a changelog. Require example tickets for every category in leadership reporting. And make “open three representative conversations” a standard checkpoint, because the moment nobody’s checking, chaos resumes.
The Real Root Causes Behind Tag Sprawl and Distrust
Tag sprawl isn’t caused by volume alone; it’s missing mapping logic and drift controls. Manual tags and one-off transforms create divergence across teams, and synonyms multiply. Without a single source of truth tied to real tickets, two smart analysts will roll up the same data differently. That’s where distrust starts.

What Traditional Approaches Miss in Mapping Logic
Manual tagging? Slow and inconsistent. One-off BI transforms? Hidden logic no one else can see or audit. Undocumented regex? Works until a product name changes and your match rules silently fail. The result is parallel truths, different rollups for the same reality. You can’t make cross-functional decisions on that.
You need a single mapping table with clear precedence rules and an audit workflow. Normalize first, then map. Store exact matches, regex matches, and similarity thresholds with priority. And preserve traceability to the underlying tickets, so when someone challenges a chart, you can show the proof. Governance isn’t a nice-to-have, ask any security team that follows structured playbooks like OASIS Security Playbooks v1.1. Same principle here: repeatable, reviewable steps.
The Hidden Complexity Inside Synonyms, Variants, and Drift
It’s usually not the big categories that break you. It’s pluralization, punctuation, typos, abbreviations, and near-duplicates. “Paymnt failed” vs. “payment_failed.” Hyphens vs. underscores. “Billing fee confusion” vs. “unexpected charge.” Harmless, until they fracture your metrics and bury the true driver.
Without normalization, each variant becomes a snowflake that requires manual cleanup. That’s why your process must define casing, whitespace, spelling, lemmatization, and aliasing rules upfront. Then codify merge and assignment logic that tools, and humans, can understand and review. If you don’t, drift wins slowly and quietly.
The Hidden Costs of Noisy Tags and Inconsistent Rollups
Noisy tags don’t just annoy analysts. They burn time, distort priorities, and erode confidence in the data. If the same issue lives under six labels, it looks small and scattered. Leadership under-resources the fix. Engineering ships the wrong thing. And you’re back in a month explaining why sentiment didn’t move.
Hours Lost to Manual Deduping and QA
Let’s pretend your team handles 8,000 tickets a month and spends two minutes per ticket on cleanup during reporting. That’s 266 hours of low-leverage work. Every month. Worse, you repeat it because nothing was codified. A reusable normalization function and mapping table turn ad hoc cleanups into rules that run on every import.
The interjection: this is preventable. Shift effort from recurring cleanup to durable rules. You’ll reclaim analyst time and make improvements stick across months, not just this report.
The Downstream Impact on Roadmaps and Reporting
Noisy categories inflate debate time. “Is this a billing issue or a pricing policy?” If your mapping is inconsistent, you’ll spend more time reconciling frameworks than prioritizing fixes. And if billing confusion is split across six tags, the problem looks smaller in every chart. That leads to misallocated engineering cycles and missed outcomes.
Canonicalization exists in other fields for the same reason, clarity. Even a university web team spells out why: canonical tags help consolidate signals to one source of truth, reducing fragmentation and confusion. If needed, skim the UC Davis overview on canonical tags. Same concept, different domain.
When Trust Breaks, Momentum Dies
Trust breaks fast: one bad chart, one missing example, and leaders disengage. When you can’t tie a spike to three real tickets, people question everything that follows. Momentum dies, not because the data is wrong, but because they can’t see it.
The 3am Request You Cannot Answer Without Traceability
You share a churn-risk by driver chart. The COO pings at 3am: “Show me the conversations behind this spike.” If you can’t open the exact tickets, with transcripts and summaries, you lose the room by 9am. Numbers without evidence are just numbers.
Bake traceability into the workflow. Every aggregate should link to the exact tickets and quotes. That way, the late-night question becomes a fast, confident answer, not a scramble through CSVs and screenshots.
When Your Largest Account Sees Conflicting Categories
Two narratives for the same issue is a great way to burn trust with a key account. Sales says “onboarding friction,” product says “account access.” Both might be true, but conflicting labels make you look disorganized. Normalize inputs, enforce merge rules, and keep a visible changelog so stakeholders understand how and why labels change over time. Proof first, progress second. Review a few Conversation Insights together, align on mappings, and the meeting shifts from skepticism to solutions.
Operational Playbook, 7 Steps to a Stable Canonical Taxonomy and Driver Map
A stable taxonomy isn’t an art project; it’s an operational system. The goal is simple: rules you can run every week, evidence you can show anytime, and a cadence that prevents drift. Here’s the short version before we dig in: normalize, map, validate with tickets, automate, govern.
Steps 1–3: Audit, Define, Normalize
Start with an audit that quantifies chaos. Measure unique raw tags, long-tail ratio, frequency distribution, and entropy. Flag the top 100 raw tags by volume and cumulative coverage. Identify duplicates and near-duplicates. Save a baseline snapshot so you can see progress later. Document assumptions, future you will need them.
Define canonical categories and drivers next. Draft 20–60 business-aligned categories, then map each to a driver like Billing, Performance, or Account Access. Write naming rules and inclusion notes. Add example mappings, “Payment Failed,” “Unexpected Charge” under Billing & Payments. Circulate for review across CX and product before merging anything.
Normalize inputs before you map. Standardize case, punctuation, whitespace. Lemmatize. Expand common abbreviations. Decide on US vs. UK spelling. This is the difference between repeatable rules and endless mop-up work.
Optional quick checklist to reinforce the work:
- Audit: baseline counts, top-100 coverage, duplicates flagged
- Define: category list, drivers, naming rules
- Normalize: casing, punctuation, spelling, lemmatization
Steps 4–5: Map With Precedence, Validate With Evidence
Implement a mapping table with columns like raw_tag_norm, canonical_tag, driver, priority, confidence, active, source. Precedence should be explicit: exact map, regex map, semantic similarity above threshold, then fallback to Unknown. Keep a manual override path. And store unmapped tags for review. This is where most teams slip, no single source of truth.
Validation must be example-based. Set acceptance criteria: 90% of volume covered by mapped tags; no top-10 category conflicts in a 50-ticket sample; each reported driver linked to three example tickets. Use your analysis workspace to spot-check each category by grouping, then open conversations to verify that quotes match intent. If examples don’t line up, fix the mapping, not the slide.
Steps 6–7: Automate, Govern, Iterate
Schedule mapping jobs. Re-run normalization weekly. Auto-capture new raw tags into an “Unmapped” queue. Save approved mappings so future tickets roll up automatically. If your system supports it, allow learned associations so similar raw tags land in the right canonical categories over time, while keeping explicit mappings in control.
Governance seals the gains. Assign owners for categories and drivers. Keep a changelog: date, rule added or edited, expected effect, reviewer. Run a monthly review of unmapped tags, drift checks, and top deltas by driver. Publish short release notes (“Merged 14 payment variants into Payment Failed”). Small, frequent updates beat sweeping rewrites that reset trust.
If you want to compare with how other fields keep signals clean, the SEO world leans on explicit canonical declarations to avoid duplication and drift; the rationale behind rel=canonical explained by Yoast is remarkably applicable to ticket taxonomies too.
Want to see an evidence-first workflow end-to-end, using your data? We can walk a sample together and map your top drivers in an hour. See How Revelir AI Works.
How Revelir AI Operationalizes Canonical Tagging End To End
Revelir AI turns conversations into evidence-backed metrics with full coverage, so your mapping rules apply everywhere and your charts are defensible. It auto-generates raw tags, supports canonical categories and drivers, and enriches every ticket with sentiment, churn risk, effort, and custom metrics. Most importantly, every aggregate links back to the exact ticket.
Full Coverage Tagging and Metric Enrichment
Revelir AI processes 100% of conversations, no sampling, so you avoid bias and catch early signals you’d miss in manual reviews. Each ticket receives raw tags, canonical categorization (as configured), and drivers, plus AI Metrics like Sentiment, Churn Risk, and Customer Effort where detected. The benefit is straightforward: fewer blind spots and decisions grounded in complete evidence.

Full-population analysis changes the conversation. Instead of debating representativeness, you pivot across the entire dataset, by segment, by product area, by time window. And because every metric ties to a ticket, you can validate quickly when stakes are high.
Data Explorer for Fast Audits and Rollups
Data Explorer is where you work day to day. Filter by sentiment, effort, or churn risk. Group by driver or canonical tag to see where volume and severity cluster. Sort to find top contributors. Save views for recurring audits and leadership updates. Then click any number to jump straight into the underlying conversations, closing the loop between aggregate and evidence in a single motion.
This is how you run Steps 1–5 efficiently: baseline audits, group-by checks, top-100 coverage validation, and example-based QA without leaving the analysis workspace. No fragile spreadsheets. No lost context.
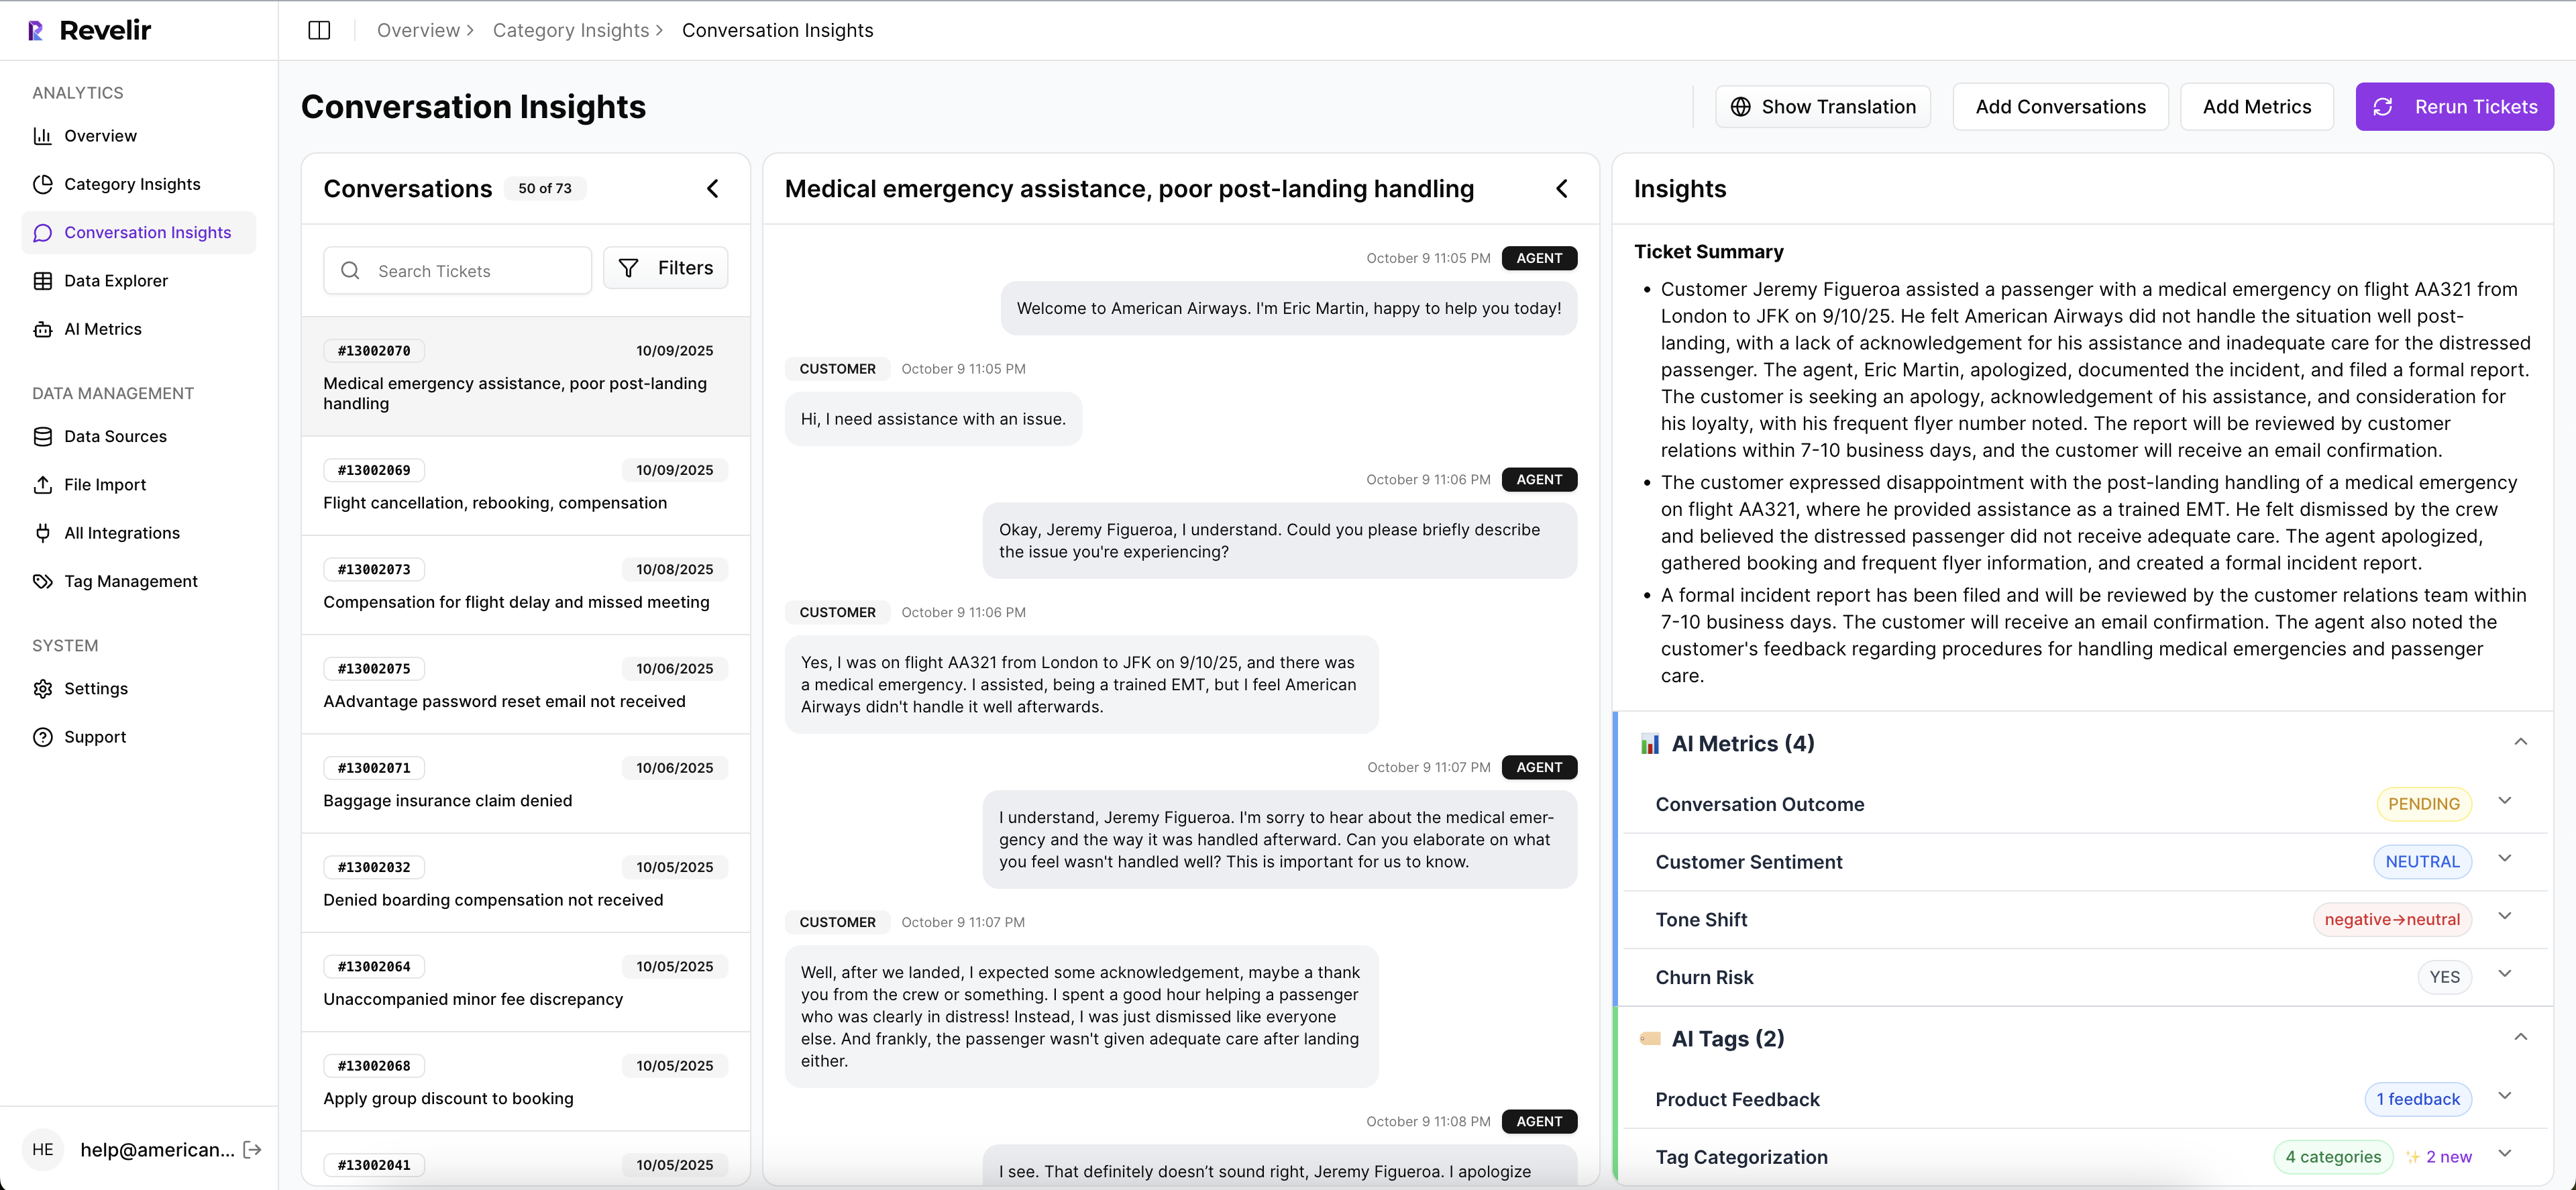
Conversation Insights for Evidence and Validation
When you need the story behind the number, Conversation Insights opens the exact ticket. You’ll see the full transcript, an AI summary, assigned raw and canonical tags, drivers, sentiment, churn risk, effort, and any custom metrics you’ve enabled. If a label looks off, capture the edge case, adjust the mapping, and re-verify on real conversations.

Traceability is the trust engine here. Revelir AI is designed so every chart is one click away from proof, quotes you can paste into a PRD or bring to a prioritization meeting. It turns “show me an example” from a challenge into a routine.
Learning Your Mappings and Reducing Drift
As you merge raw tags and refine canonical categories, Revelir learns those associations. Future tickets roll up correctly, similar terms land in the right bucket, and recurring cleanup drops. You remain in control with explicit mappings and owners; the system handles the repetitive classification at scale.
This is where governance meets leverage. With Drift checks, unmapped queues, and saved views, your taxonomy stays aligned with how customers talk today, not just how they talked last quarter.
Still wrestling with manual rollups or inconsistent categories? Use your own data to see the difference. Get Started With Revelir AI and validate impact in minutes. Also available: https://Learn More
Conclusion
You don’t need a prettier tag sheet. You need a system that promotes raw discovery into canonical clarity, explains the “why” with drivers, and ties every number to tickets leaders can read. Put evidence and governance at the center, run a light monthly cadence, and let tools like Revelir AI do the heavy lifting between aggregates and examples. Proof first, then progress.
Frequently Asked Questions
How do I set up canonical tags in Revelir AI?
To set up canonical tags in Revelir AI, start by accessing the tagging section in your dashboard. 1) Create new canonical tags based on common themes in your support tickets. 2) Merge similar raw tags into these canonical categories to streamline reporting. 3) Regularly review and refine your tags as new patterns emerge to ensure your taxonomy remains relevant. This hybrid approach helps maintain clarity and consistency in your reporting, making it easier for leadership to understand key issues.
What if I notice a spike in churn risk metrics?
If you see a spike in churn risk metrics, take immediate action by: 1) Using Revelir AI's Data Explorer to filter tickets by churn risk to identify specific issues causing concern. 2) Drill down into Conversation Insights to read the transcripts and understand the context behind the churn signals. 3) Share these insights with your product and CX teams to prioritize fixes based on real customer feedback. This proactive approach can help address issues before they escalate.
Can I create custom AI metrics in Revelir?
Yes, you can create custom AI metrics in Revelir AI. To do this, navigate to the metrics configuration section and define what you want to measure based on your business needs. 1) Specify the question your metric should answer, such as 'Reason for Churn' or 'Upsell Opportunity.' 2) Set the possible values for the metric, like 'High/Medium/Low.' 3) Once defined, Revelir will automatically apply these metrics to your conversations, allowing you to analyze them within the Data Explorer.
When should I use the Analyze Data feature?
You should use the Analyze Data feature in Revelir AI whenever you need to gain insights from your support tickets quickly. This is particularly useful when: 1) You want to understand what's driving negative sentiment or high customer effort in a specific timeframe. 2) You need to prioritize issues based on volume and severity. 3) You want to group metrics by drivers or canonical tags to see broader trends. This feature helps you make data-driven decisions efficiently.
Why does my tagging system need both raw and canonical tags?
Having both raw and canonical tags in your tagging system is essential for effective analysis. Raw tags, generated by AI, help discover emerging patterns and provide detailed insights into customer conversations. In contrast, canonical tags offer structured categories that are easier for leadership to understand. This hybrid approach ensures you can capture the nuances of customer feedback while maintaining clarity in reporting, allowing teams to act on insights confidently.