
Binary churn flags feel useful because they’re simple. They’re not. Forecasts run on probabilities, and probabilities need calibration against actual renewals by segment and value band. If your “High Risk” label can’t be translated into expected dollars per account-term, finance will ignore it or, worse, overreact to noise.
Here’s the shift. Treat conversation-derived risk as raw signal, not the final score. Then calibrate that signal to outcomes in tight renewal windows, by cohort. Do that, and CX doesn’t hand finance a red dot. You hand them a probability with lineage, plus the dollar delta it implies. That’s how you earn a seat in forecast reviews.
Key Takeaways:
- Translate churn flags into calibrated probabilities aligned to renewal events
- Aggregate signals at the account-term level inside pre-renewal windows
- Quantify costs now: hours wasted adjudicating flags and forecast misses
- Build a simple calibration layer (Platt, isotonic, Bayesian) per segment
- Output finance-ready fields: expected_renewal_arr and probability_uplift
Want to see calibrated signals tied to real quotes, not vague flags? Here’s a walk‑through of the workflow we recommend. See How Revelir AI Works.
Binary Risk Flags Do Not Belong In Forecasts
Binary churn flags don’t map to revenue math; calibrated probabilities do. Finance multiplies probabilities by ARR to get expected dollars, and a Yes/No label offers neither probability nor confidence. To fix this, convert conversation signals into probabilities that match historical outcomes by cohort and value band, with evidence traceable to real tickets.
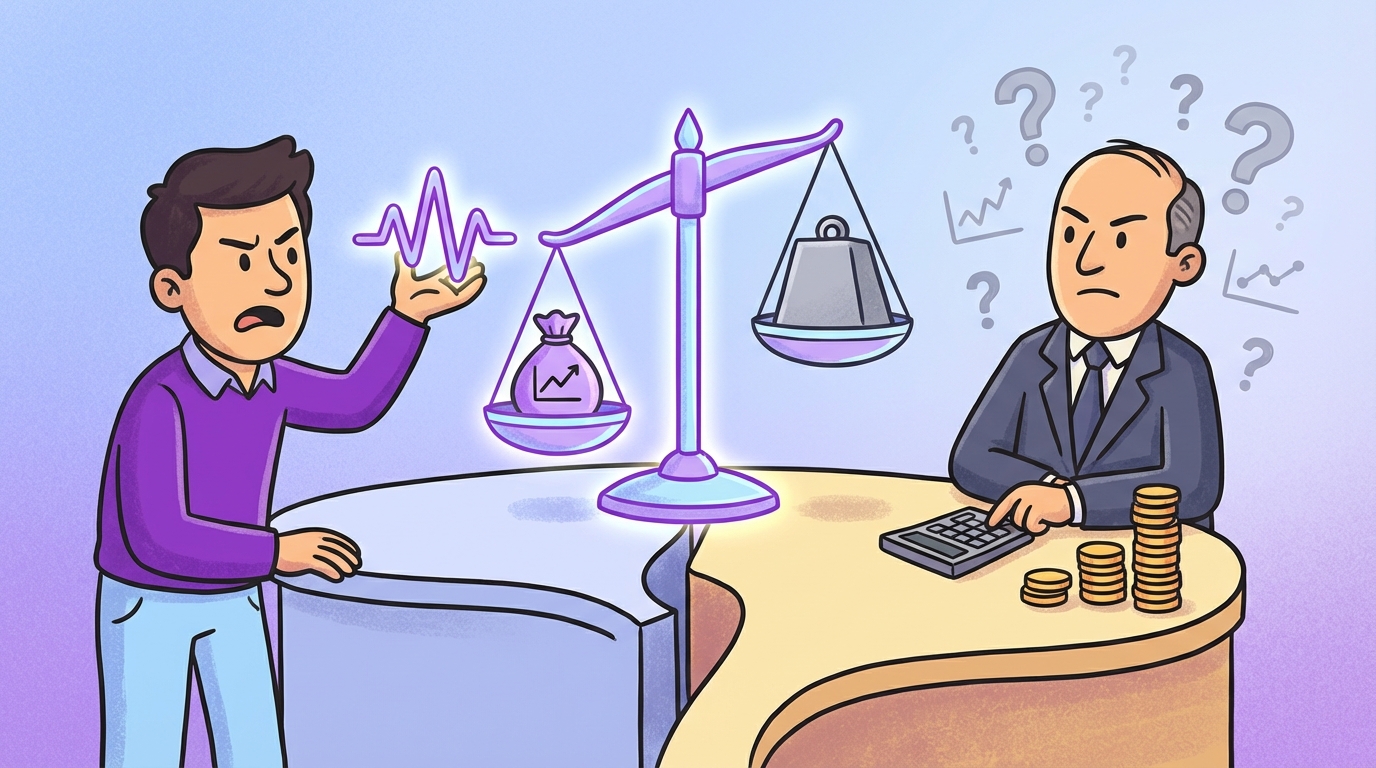
Why Finance Distrusts Binary Risk
A binary label compresses uncertainty into a false certainty. It looks crisp on a dashboard, but there’s no way to price the risk. You can’t aggregate it, trend it, or benchmark across segments. Worse, two “High Risk” accounts rarely carry the same weight. One is a $10K renewal with a single complaint. The other is a $200K renewal with repeated churn mentions. Same label. Very different exposure.
Finance leaders notice this immediately. They ask, “What’s the probability? What’s the expected dollar impact?” When the answers are stories instead of numbers, the model wins, and CX gets sidelined. A calibrated layer restores the translation: signals become probabilities, probabilities become dollars, and dollars earn attention. If you want a mental model, think of it like turning a diagnostic test into a risk score with a reliability curve, similar to guidance in Design Renewal Probability Scoring.
What Changes When You Calibrate
Calibration turns your conversation signal into an input that can be owned. You align tickets to renewal events, estimate well‑calibrated probabilities per cohort, and attach expected dollar impact. Now the “why” is still visible, linked quotes and drivers, but the top line is numeric. It can roll up. It can trend. It can be audited. And it can be challenged without devolving into anecdote versus anecdote.
This is where trust shows up. You stop arguing about whether a red dot is “real” and start debating whether a 0.27 probability should be 0.24 or 0.30 in a segment, given the evidence. That’s a better meeting.
The Real Bottleneck Is Calibration, Not Detection
Most teams can detect churn signals; few teams calibrate them to renewal probabilities. The missing piece is boring but pivotal: label assembly, time‑window alignment, and cohort stratification. Without tight joins to outcomes, you can’t measure calibration or improve it. Do the joins right, and your risk signal becomes finance‑grade.
What Traditional Approaches Miss
Teams stop at detection because that’s the visible win. A model finds churn mentions, frustration cues, or sustained negative sentiment. Great. But if those scores aren’t joined to the renewal event, precisely and reproducibly, you’re stuck at “interesting.” Calibration requires ground truth: renew or churn, by account-term, with the features aggregated inside the pre‑renewal window.
Same thing with cohorting. A 0.30 risk in SMB doesn’t behave like a 0.30 risk in Enterprise. Base rates matter. So do contract value bands. Calibrate per cohort where you have volume, and use hierarchical pooling when you don’t. Otherwise, you’ll chase “accurate” models that fail in production, a common trap in generic churn prediction overviews.
What Is The Right Unit Of Prediction?
Predict the renewal event, not the ticket. Aggregate conversation signals at the account‑term level (e.g., the 90‑day pre‑renewal window) and tie them to the binary outcome for that event. Deduplicate threads, prevent leakage from post‑renewal tickets, and keep a clear lineage back to source conversations. When your unit of prediction matches the finance decision, your probabilities become usable immediately.
The Hidden Cost Of Uncalibrated Signals On Revenue Plans
Uncalibrated flags consume analyst time and create forecast whiplash. You pay in adjudication hours, missed guidance, and delayed interventions. These aren’t theoretical costs, they show up on calendars and quarter‑end calls. You feel it when everyone’s “worried about” surprises that were in the queue all along.
Analyst Hours Lost To Adjudication
Let’s pretend you have 2,000 renewing accounts and 400 flagged as high risk. Finance can’t map those flags to probabilities or dollars, so someone starts weekly reviews. They manually inspect 50–100 accounts, 20 minutes each. That’s 17–34 hours per week. Every week. Frustrating rework, recurring debates, and still no consistent input to the forecast.
The worst part isn’t the hours, it’s the churn of attention. Analysts become full‑time translators between dashboards and executives. The signal degrades as people cherry‑pick examples. With calibrated fields, those hours collapse into a minutes‑long review of probability shifts and expected dollar deltas, with links to source quotes if someone wants to see the why.
Forecast Misses That Erode Confidence
On a $25M renewal base, a three‑point error is $750K of variance. If your flags prompt outreach but don’t change probability estimates, you discover the variance after the quarter closes. The trust hit lingers. Calibrated probabilities surface variance while you still have options, reallocate CSM time, escalate product fixes, adjust pipeline.
Run the math for a common case. Mid‑market at $10M ARR. A three‑point drop in renewal rate is $300K at risk in that quarter. With expected_renewal_arr calculated off calibrated probabilities, the delta is visible weeks earlier. Teams can pivot. That’s the whole point of moving beyond score‑watching toward measured, explainable risk, a theme echoed in many churn prediction models.
Still adjudicating flags by hand? There’s a faster path that doesn’t require ripping out your stack. Learn More.
The Frustration When Finance Ignores CX Signals
Finance isn’t ignoring you; they’re ignoring unpriced uncertainty. The moment you quantify risk and attach evidence, the conversation changes. Until then, the room stalls. You feel it as tension and “we’ll take it offline.” It’s avoidable.
When Your Biggest Account Is Labeled High Risk And Nothing Happens
You see a High Risk flag on a $200K renewal. Finance shrugs. “The model disagrees.” You escalate, but without a calibrated probability, a clear window, and linked quotes, the flag reads like an opinion. Evidence wins, but only when it’s quantified and traceable. Give the CFO 0.42 probability, the $116K expected delta, and two representative quotes. Decisions move.
We’ve watched rooms flip on that combination. Numbers to set priority. Quotes to set urgency. Both tied to a renewal event, not a one‑off ticket. That blend earns action.
The 3AM Renewal Scramble You Could Have Prevented
We’ve all been there. Slack threads. Last‑minute discounts. Worried about a surprise churn that wasn’t a surprise in the queue. The failure wasn’t detection. It was the missing path from signal to probability to expected dollars. Ownership fixes this. CX curates signals, analytics calibrates, RevOps integrates, finance validates drift and signs off on changes. Clear playbooks stop the pendulum swing between ignoring CX and overreacting to anecdotes.
From Churn Signals To Calibrated Renewal Probabilities
Turn tickets into probabilities by aligning signals, outcomes, and math. Aggregate conversation features at the account‑term level, build clean labels, and calibrate scores into probabilities per cohort. Then convert those probabilities into expected dollars with clear lineage back to the conversations that drove the change.
Inventory And Map Conversation Signals Into Features And Risk Buckets
Start with what you already have. Signals like churn risk flags, sentiment, effort, raw and canonical tags, drivers, and any custom AI Metrics. Aggregate by account‑term inside a pre‑renewal window, often 60–90 days, depending on your sales motion. Use counts, rates, recency, and last‑value features. Keep it interpretable: “multiple churn mentions plus high effort in last 30 days” should mean something to a human.
Use your analysis workspace to validate features before modeling. Pivot high‑risk segments, scan representative tickets, and sanity‑check that the bucket names match what real customers said. If a feature bucket surprises you, drill into examples and refine it. Fast loops here save headaches later.
Assemble Ground Truth And Align Windows To Renewal Cohorts
Build an outcomes table: account, term start and end, ARR, renew/churn outcome, segment, and value band. Join your aggregated features into that table by aligning to the pre‑renewal window. Exclude tickets after the renewal date to avoid leakage. De‑duplicate across threads and contacts. Document everything in SQL or dbt so it’s reproducible and testable.
Stratify by cohort where possible. Enterprise versus SMB. New versus expansion. Different base rates will change your calibration curves. When data is thin, pool segments hierarchically to avoid overfitting. The goal isn’t a perfect classifier; it’s a trustworthy probability you can defend in a forecast meeting, consistent with approaches described in Predicting Renewal Probability Machine Learning.
Calibrate Scores And Convert To Dollars
Train a risk model or use a transparent rule score as a starting point. Then calibrate. Platt scaling (logistic on scores) gives you a parametric mapping; isotonic regression gives a flexible monotonic mapping; Bayesian updating blends your base rate with observed evidence. Use reliability plots and Brier score to judge calibration. Calibrate per segment when you can; regularize when you can’t.
Converting to dollars is straightforward. Multiply the calibrated renewal probability by contract value to get expected_renewal_arr. Compare to the baseline to compute probability_uplift and dollar delta. Expose fields like expected_renewal_arr, probability, probability_uplift, and risk_reason_top3. Keep lineage intact so anyone can click back to the tickets that moved the number, similar in spirit to guidance in Design Renewal Probability Scoring.
How Revelir AI Powers Calibration And Forecast Integration
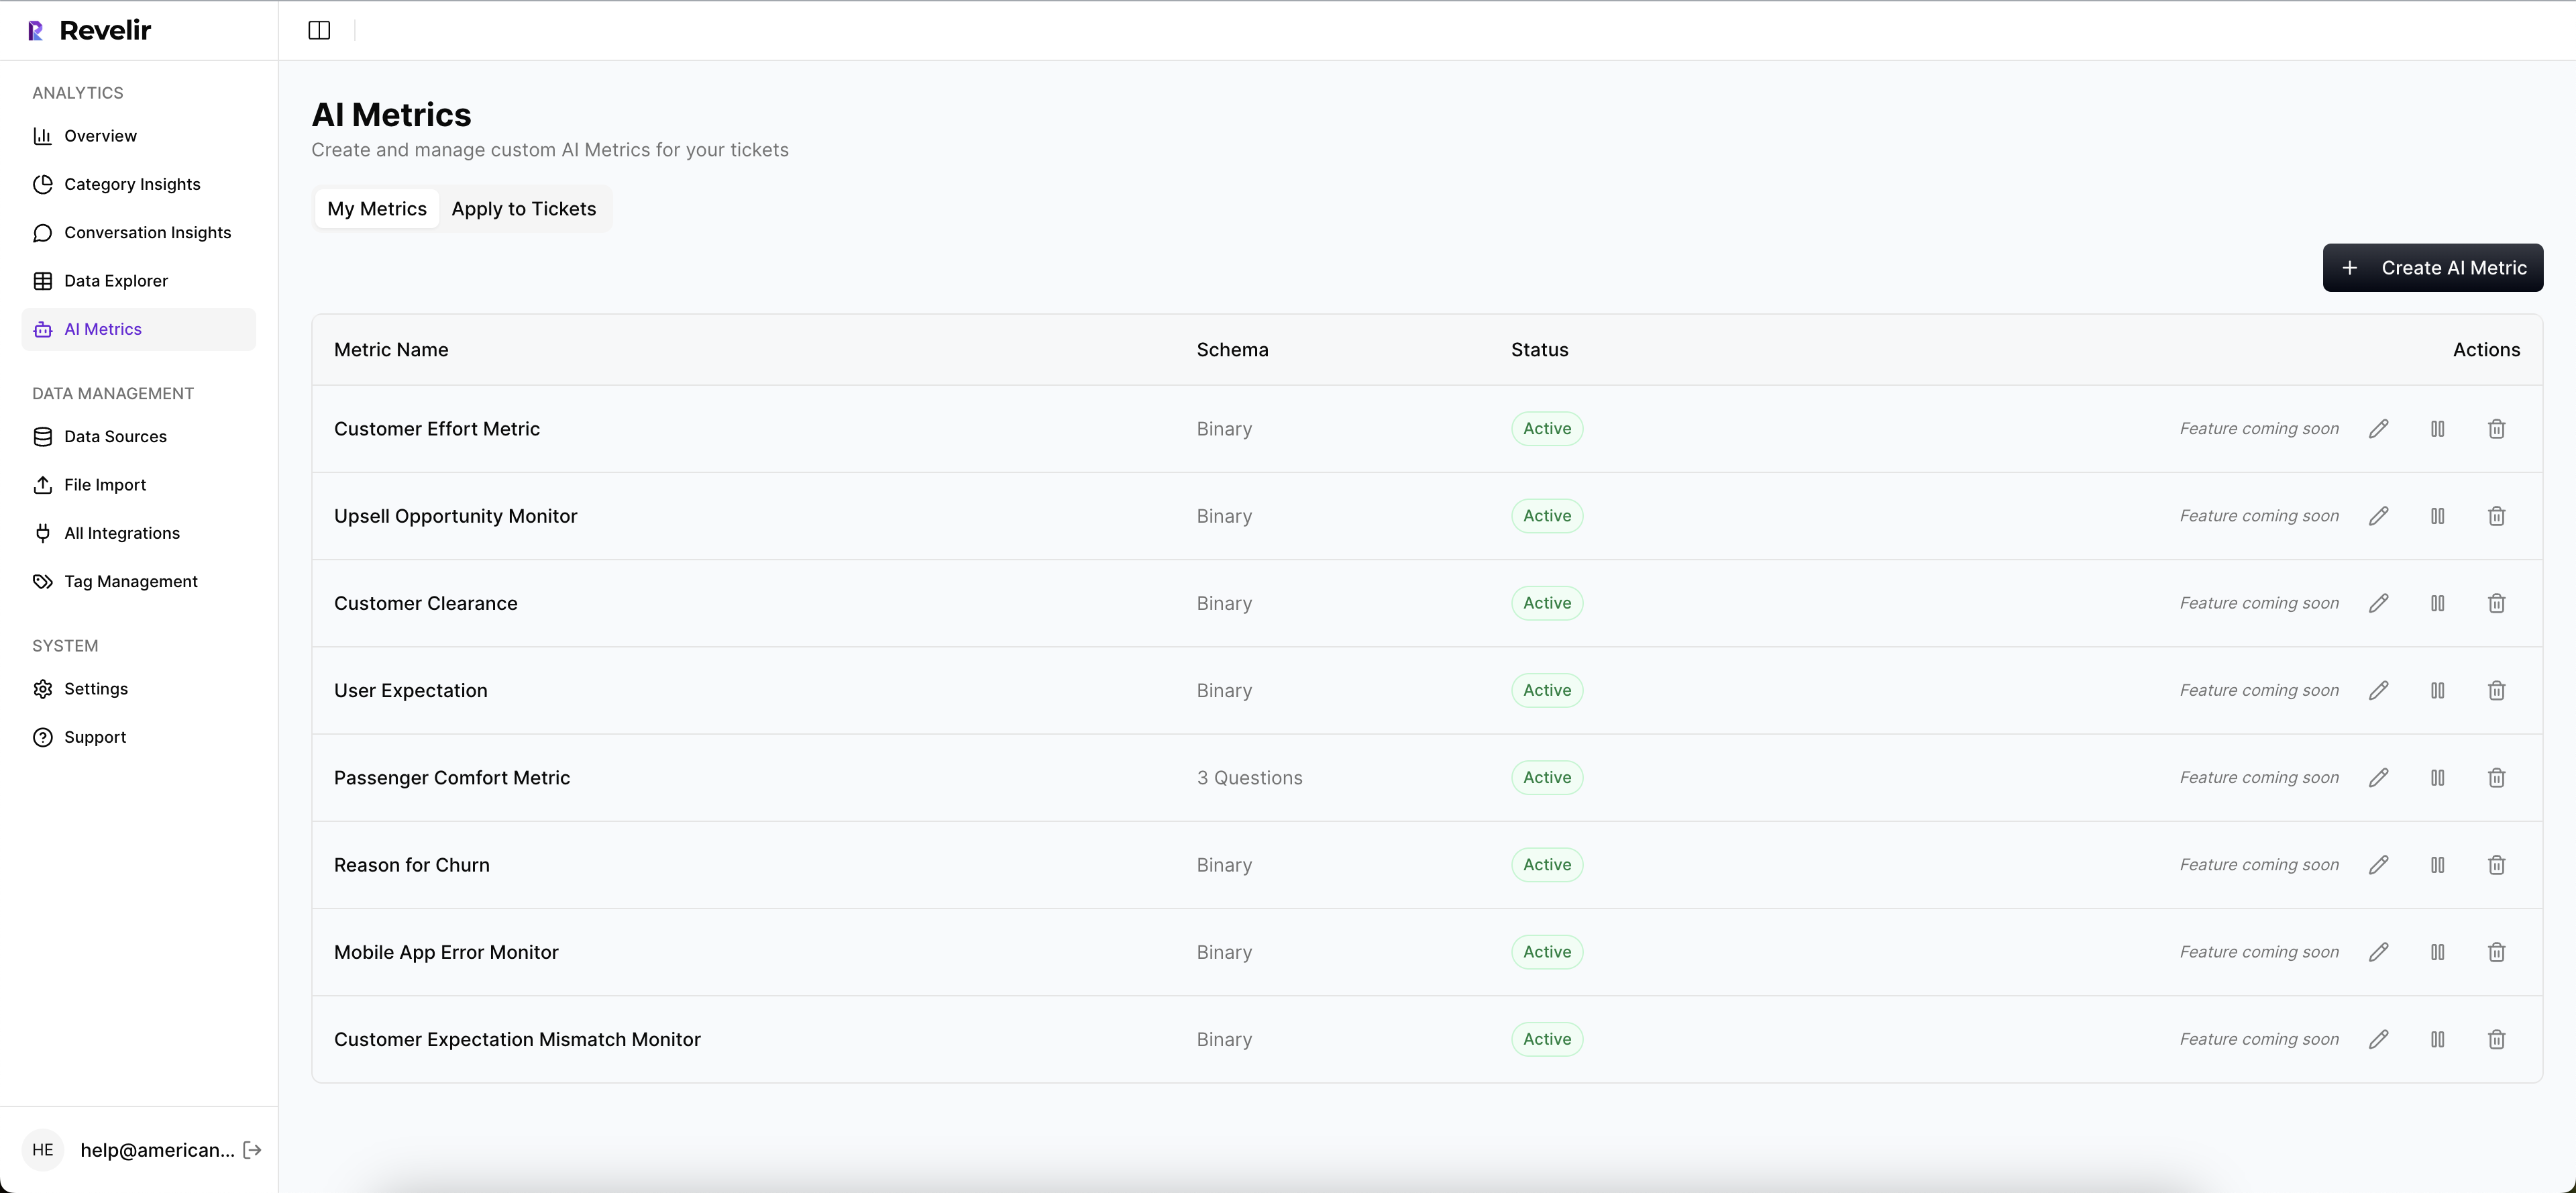
Calibrated forecasting needs two things: trustworthy signals and traceability. Revelir provides both. It processes 100% of conversations, assigns metrics like churn risk, sentiment, effort, tags, and drivers, and lets you pivot by these dimensions instantly. Just as important, it links every aggregate back to the exact conversations and quotes that created it.
Use Revelir AI Metrics And Traceability As Reliable Inputs
Revelir runs full‑coverage processing, no sampling, so your features cover every ticket, not a sliver. It assigns churn risk, sentiment, customer effort, raw tags, canonical tags, and drivers per conversation. In Data Explorer, you can group by driver or tag to understand where risk concentrates. One click takes you to Conversation Insights with transcripts, summaries, and quotes. That traceability is what makes calibration auditable and finance‑ready.

You’re not guessing. You’re showing the numbers and the words behind them. When someone challenges a curve, you open the exact tickets that moved it. Confidence goes up, adjudication time goes down.
Export Structured Signals To Your Warehouse, Then Pipe Into dbt And Finance
Revelir makes structured metrics available for analytics and export. Push churn risk, sentiment, tags, drivers, and custom metric outputs to your warehouse on a cadence. Build dbt models that aggregate features inside the pre‑renewal window, calibrate model scores, and materialize finance‑ready columns: probability, expected_renewal_arr, and probability_uplift.
RevOps gets a clean table for the forecast, not a monthly stitching project. Finance sees deltas form in‑quarter. CX and Product have the same lens, backed by verifiable examples. That’s the loop you want, faster signals, fewer surprises, consistent with patterns seen in established churn prediction models.
Still relying on red dots and gut checks? There’s a better way to put your CX data to work. See How Revelir AI Works.
Monitor Drift, Validate Improvements, And Operationalize Playbooks
Use Analyze Data to watch distribution shifts by driver, segment, and cohort. If churn risk spikes for a driver, click through to Conversation Insights, read three recent examples, and decide whether it’s product, policy, or training. Set a monthly SLA: refresh signals, recalibrate if reliability plots drift, and trigger CSM outreach when expected_renewal_arr drops past a threshold.

Revelir helps you codify ownership. CX curates signals. Analytics tunes calibration. RevOps integrates output fields into the forecast. Finance signs off on thresholds and drift rules. When everyone can inspect both the number and the source conversations, trust holds, even when the news is uncomfortable.
Ready to turn tickets into forecast inputs your CFO will trust? Get Started With Revelir AI (Webflow).
Conclusion
Binary flags create noise; calibrated probabilities create decisions. When you align conversation signals to renewal events, calibrate per cohort, and output expected dollars with traceability back to real quotes, CX becomes a reliable input to the forecast, not an afterthought. Do the boring joins, build the simple calibration layer, and let the evidence speak. Then watch the midnight scrambles fade.
Frequently Asked Questions
How do I translate churn flags into actionable insights?
To translate churn flags into actionable insights, start by using Revelir AI to analyze your support conversations. First, filter your dataset for tickets marked with churn risk. Then, use the 'Analyze Data' feature to group these tickets by drivers or canonical tags. This will help you identify patterns and specific issues contributing to churn. Finally, drill down into individual tickets to validate these insights with real examples, which can guide your strategies for customer retention.
What if my churn risk signals aren't clear?
If your churn risk signals aren't clear, consider refining your tagging and metrics in Revelir AI. Ensure that you're using the 'Customer Effort Metric' to identify any friction points customers face. You can also review the conversation insights for tickets flagged with churn risk to see if there are common themes or issues. By linking these insights back to the original conversations, you can gain a clearer understanding of the underlying problems and address them more effectively.
Can I customize metrics for my specific business needs?
Yes, you can customize metrics in Revelir AI to match your specific business needs. You can define custom AI metrics that reflect terms relevant to your organization, such as 'Upsell Opportunity' or 'Reason for Churn.' Once these metrics are set up, they will be automatically applied to your conversations, allowing you to analyze data through a lens that aligns with your business objectives. This customization helps ensure that the insights you gather are actionable and relevant.
When should I validate insights from Revelir AI?
You should validate insights from Revelir AI whenever you notice significant trends or anomalies in your data. For instance, if you see a spike in churn risk or negative sentiment, it's essential to drill down into the conversation insights linked to those metrics. This validation process ensures that the patterns you observe are backed by concrete examples and not just statistical noise. Regular validation helps maintain trust in your data and supports informed decision-making.
Why does my analysis show conflicting results?
Conflicting results in your analysis may arise from inconsistent tagging or insufficient data coverage. To address this, ensure that Revelir AI is processing 100% of your support tickets without sampling. Check your tagging system to confirm that raw tags are correctly mapped to canonical tags. If certain conversations lack sufficient detail, they may not provide clear signals. Regularly reviewing and refining your tagging and metrics can help improve the consistency and reliability of your insights.