

You don’t need more dashboards. You need to trust the ones you have. If your support insights are stitched together from samples, exports, and a few “representative” tickets, you’ll always be second‑guessing the story in the room where priorities actually get set.
Here’s the uncomfortable truth. Sampling feels responsible until a churn signal slips right past it. Score watching feels objective until nobody can explain what to fix. The fix isn’t a prettier chart; it’s a pipeline that turns every conversation into structured, traceable metrics you can audit in two clicks.
One more thing. It’s usually not a tooling problem. It’s an architecture problem, coverage, consistency, and evidence. Get those right and decisions stop wobbling.
Key Takeaways:
- Replace sampling and score‑watching with 100% conversation coverage and traceable metrics
- Use a hybrid tagging model (raw → canonical → drivers) to keep discovery flexible and reporting consistent
- Quantify the true costs of manual ingestion, inconsistent taxonomies, and unvalidated AI outputs
- Build a pipeline that treats metrics as first‑class fields and preserves click‑through evidence
- Validate high‑impact slices regularly; aim for reliability, not perfection
- Use lightweight drift checks and change logs to keep trust high as volume grows
Ready to skip the theory? See a working model end‑to‑end. See How Revelir AI Works
Why Partial Views Create False Confidence
Most teams think partial visibility is better than nothing. It isn’t, partial views create false confidence and slow reactions. Sampling misses rare but critical signals, and scores without context don’t tell you what to fix. Real confidence comes from full‑population processing and click‑through evidence anchored to transcripts.
The real signal lives inside transcripts
Support transcripts carry the drivers you need, frustration cues, churn mentions, unsolicited product feedback. Scores and a few handpicked examples won’t surface them reliably. When you process 100% of conversations and convert semantics into queryable fields, you move from narrative debates to evidence‑based diagnosis you can defend.
The difference shows up on Tuesday mornings. With full coverage, “What’s driving negative sentiment among new customers?” becomes a five‑minute pivot, not a week of ad‑hoc reviews. You’re not guessing if onboarding friction is the problem; you’re reading the exact quotes that describe where customers got stuck. Then you prioritize the fix and track the impact.
What changes behavior is traceability. When every metric points to the underlying conversations, leaders stop asking if the dataset is representative and start asking what to fix first. It’s a small shift in posture with big operational consequences. You trade speculation for action.
Why sampling and score watching stall decisions
Sampling introduces bias and delay. Let’s pretend you handle 1,000 tickets monthly and read 10% at three minutes each. That’s five hours for a partial picture that still misses early churn signals. Multiply that across peaks and teams, and you’ve bought uncertainty at scale.
Score watching isn’t a strategy either. A downward sentiment curve tells you something is wrong. It doesn’t tell you whether it’s onboarding, billing, or a specific workflow tripping up enterprise accounts. Without drivers and exemplars, you end up shipping generic fixes. That’s where rework and credibility hits come from.
Here’s the kicker: nobody’s checking representativeness in the heat of the moment. The loudest anecdote wins. When every conversation is measured and drillable, you stop arguing about whether a story is typical and start validating patterns in minutes. The debate gets shorter. The plan gets sharper.
What is 100% coverage and why does it matter?
One‑hundred percent coverage means every conversation is processed, tagged, and scored, no exceptions. It removes the representativeness debate, which is where trust goes to die. It also unlocks consistent pivots by driver, category, and segment without asking, “Does this slice hold up?”
Coverage is the base layer of credibility. It ensures you don’t miss the low‑frequency, high‑impact signals, like subtle churn mentions, that a 10% read will skip. When coverage is paired with evidence you can click into, leaders stop hedging and start committing resources. Decisions speed up because proof is built in.
Same thing with trend detection. With 100% coverage, a small uptick in “billing_fee_confusion” isn’t anecdote; it’s detectable signal. You can quantify how it affects sentiment and effort by segment, then show the three quotes that make it real. That’s how you get alignment.
The Hidden Architecture Problem Behind Trust
Trust in CX metrics isn’t a presentation problem. It’s an architecture problem. If tags drift, metrics are black boxes, and aggregates can’t be traced back to transcripts, your charts will get challenged. A trustworthy stack blends AI‑led discovery with human‑controlled categories and two‑click transparency to the source.

What traditional tagging misses
Manual tags drift. Different agents label the same issue differently, and the taxonomy ages fast. AI‑only tags without oversight miss the business language leaders expect. The durable pattern is hybrid: let AI generate granular raw tags for discovery, then map them to stable canonical tags you control.
This gives you two gears. Discovery stays flexible so you catch emerging themes early. Reporting stays consistent so you can present insights with clean categories aligned to how your company talks. Over time, mappings mature, reports stabilize, and you keep nuance without sacrificing clarity.
Drivers sit above it all. They roll up canonical tags into leadership‑ready “why” buckets, Billing, Onboarding, Performance, so your pivots tell a story, not just counts. You can say, “Negative sentiment among new customers is concentrated in onboarding friction,” and prove it with quotes.
Black box metrics break trust
If a metric can’t be traced to transcripts, you’ll lose the room on the first “Show me an example.” That’s not cynicism; it’s good governance. Build a path from aggregate to conversation‑level detail and make it two clicks or fewer. People will challenge edge cases. Good. That’s how trust grows.
Perfection isn’t the bar. A reliable threshold is. If humans reading a handful of tickets say, “Yes, this makes sense,” your metrics are usable. The audit trail, counts that click through to transcripts, summaries, tags, and scores, keeps disputes short and productive. Evidence beats opinion. Every time.
The Hidden Costs of Fragmented Support Analytics
Fragmented analytics bleed time and confidence. Manual ingestion burns hours; inconsistent taxonomies wobble trends; unvalidated AI outputs trigger rework when leadership pushes back. Quantify these costs and you’ll see why a maintained ingestion layer, hybrid tagging, and built‑in validation pay for themselves quickly.
Engineering hours lost to manual ingestion and dedupe
Let’s pretend exports land weekly from three systems. One analyst spends six hours cleaning timestamps and deduping by requester. Another writes regex to stitch multi‑message threads. It works, until it doesn’t. A real ingestion layer normalizes schemas, preserves message order, and enforces idempotency so teams focus on questions, not plumbing.
End‑to‑end reliability principles help here. Practices like schema versioning, idempotent writes, and recoverable batch processing, outlined well in a guide to automated data pipeline best practices, translate directly to support data. You get fewer surprises, faster backfills, and less time in CSV purgatory.
The quiet cost is context loss. When message boundaries get mangled or timestamps drift, effort scoring and sentiment trajectories degrade. You can’t fix that downstream with clever charting. Ingestion quality is destiny.
The risk from inconsistent taxonomies
When tags vary by agent, month, or product line, your trend lines wobble. New labels creep in; old ones linger. Leaders see noise and stall. Hybrid mapping fixes this: let AI emit granular raw tags freely, then map them into canonical categories with a change log and review before splits or merges.
Consistency doesn’t mean rigidity. It means your taxonomy evolves with intent. Review high‑volume new raw tags monthly, fold the meaningful ones into canonical categories, and track what changed. Now when someone asks, “Why did Billing move?” you can answer with both data and a documented mapping change.
Interjection: nobody’s checking tag drift week to week unless you make it part of the workflow. Bake it in. Short reviews prevent long debates later.
Still doing this plumbing by hand? There’s a faster path to stable, auditable metrics. Learn More
What It Feels Like When Evidence Is Missing
The rational costs show up as emotional ones. Missed renewals. 3 am debates you can’t win. Endless backchannels after a tense meeting. Build for coverage and transparency, and those moments get rarer. You trade anxiety for alignment.
When your highest-revenue account signals churn and you miss it
Picture renewal quarter. A top account hints at churn across five tickets. Sampling didn’t catch it. By the time escalation lands, the fix ships after they leave. It’s a gut punch. Early detection depends on coverage and clear churn‑risk flags you can filter instantly, plus quotes that make outreach concrete.
You don’t need perfection. You need a reliable signal that says, “These accounts show churn cues, here’s the evidence.” Then CSMs act. When the pattern is grounded in 100% of conversations, nobody argues about whether it’s real. They just move.
It’s usually the quiet patterns, subtle onboarding friction, confusing fee language, that do the damage. Those never show up in small samples. They show up when you measure everything.
The 3 am dashboard debate you cannot win
A spike in negative sentiment shows up. You bring a chart; someone brings a story. Without direct links to exemplars, the debate drifts. Confidence drops. Minutes feel expensive. The way out is procedural: make every metric click through to transcripts, then read three examples together.
Think “confidence threshold,” not absolutes. In testing terms, you’re aiming for enough coverage and representative examples to make a decision, similar to how teams approach automation test coverage as a risk‑based threshold. Evidence anchors the room. Decisions accelerate.
And when the evidence contradicts a narrative? Great. You’ve learned something real, quickly, without a week of follow‑ups.
Build the Pipeline: 100% Coverage With Auditability
A resilient support insights pipeline has four pillars: trustworthy ingestion, hybrid tagging, first‑class metrics, and built‑in validation. You don’t need a moonshot. You need disciplined choices that keep coverage complete, categories consistent, and evidence available in two clicks.
Designing an ingestion layer you can trust
Start from your systems of record. Use helpdesk APIs for continuous sync and CSV for backfills or trials. Normalize everything to a canonical conversation model: ticket ID, message array with roles and timestamps (in UTC), and relevant metadata. Preserve message order, effort scoring depends on it.
Idempotency isn’t optional. Pick a stable composite key (ticket ID + message index) and enforce it so reruns don’t duplicate rows. Track schema versions so you can evolve without breaking downstream queries. Borrow the mindset from DevOps, dashboards and alerting on freshness, lag, and error rates, much like CI/CD monitoring best practices emphasize health signals and thresholds.
Recovery matters. Plan for replays, partial failures, and late‑arriving data. Your future self will thank you when a backfill takes hours, not days, and doesn’t corrupt history.
How do you keep tags consistent without killing discovery?
Let AI emit granular raw tags freely. That’s how you spot new issues humans wouldn’t think to label. Then map those raw tags into stable canonical categories you control. Version the mappings, log every change, and apply them incrementally so historical reports remain understandable.
Drivers sit above canonical tags to create leadership‑ready summaries. They give you the “why” without drowning in detail. Review high‑volume new raw tags monthly and fold meaningful ones into the taxonomy deliberately. Now you’ve got a system that learns without rewriting history.
A quick cadence helps:
- Monthly: review top emerging raw tags and propose canonical updates
- Quarterly: audit driver roll‑ups and retire stale categories
- Always: record what changed and why
Generating metrics as first-class fields
Treat metrics as columns you can query: Sentiment (Positive, Neutral, Negative), Churn Risk (Yes/No), and Customer Effort (High/Low when supported by context). Define value sets clearly and resist filling gaps with guesses. If there isn’t enough back‑and‑forth for effort, leave it empty. Honesty in nulls builds trust.
Store model version, run timestamp, and confidence alongside each metric. That metadata is your audit trail when someone asks, “Did this shift because we retrained?” It also lets you compare versions and roll forward safely. Custom metrics belong here too, typed, documented, and governed like the rest.
Validation belongs in the loop. Do lightweight human reviews on high‑impact slices (e.g., top churn‑risk driver this week), log disagreements, and watch class balance over time. Add simple drift checks for tag explosions or sudden distribution shifts. The goal isn’t perfection, just steady reliability you can operate against.
How Revelir AI Runs a 100% Coverage, Traceable Insights Pipeline
Revelir AI processes 100% of your support conversations, converts them into structured metrics and tags, and preserves a two‑click path back to the exact transcripts. It sits on top of your helpdesk and exports clean, auditable fields your teams can use in the tools they already trust.
Full-coverage ingestion with Zendesk or CSV
Connect Zendesk to sync historical and ongoing tickets, or upload CSVs for backfills and trials. Revelir AI ingests full transcripts and core metadata, then processes every conversation, no sampling. The benefit is simple: a fresh, complete dataset without manual glue work or brittle spreadsheets.

That coverage eliminates blind spots. When a churn cue appears in a low‑volume segment, Revelir catches it because everything is processed. Backfills are fast, and ongoing sync keeps your analysis current without exporting and re‑importing every week. Less plumbing, more answers.
If you’re integrating with existing pipelines, consider how exports fit your current flows. Guidance on integration patterns, retries, and scheduling aligns with the spirit of data pipeline automation approaches, and Revelir’s CSV + API options make that handoff straightforward.
AI tagging with raw to canonical mapping and drivers
Revelir AI assigns raw tags automatically for granular discovery, then lets you define canonical tags for consistent reporting. Over time, mappings stabilize, new patterns roll up cleanly, and your taxonomy stays aligned with how your business talks. Drivers group categories into leadership‑ready themes like Billing or Onboarding.

This hybrid model balances flexibility and clarity. You discover emerging issues early through raw tags, report cleanly through canonical tags, and prioritize strategically through drivers. Same data, three lenses, zero rework every month to clean slides.
It’s usually this consistency that wins budget debates. Clear categories and stable roll‑ups make trends credible, not just interesting.
Evidence-backed traceability with Conversation Insights
Every aggregate in Revelir AI links to the conversations behind it. Click a count to open the filtered list, read transcripts, see summaries, tags, and metrics, all in one place. This is your audit trail. PMs and leaders can challenge a number and verify it in seconds.
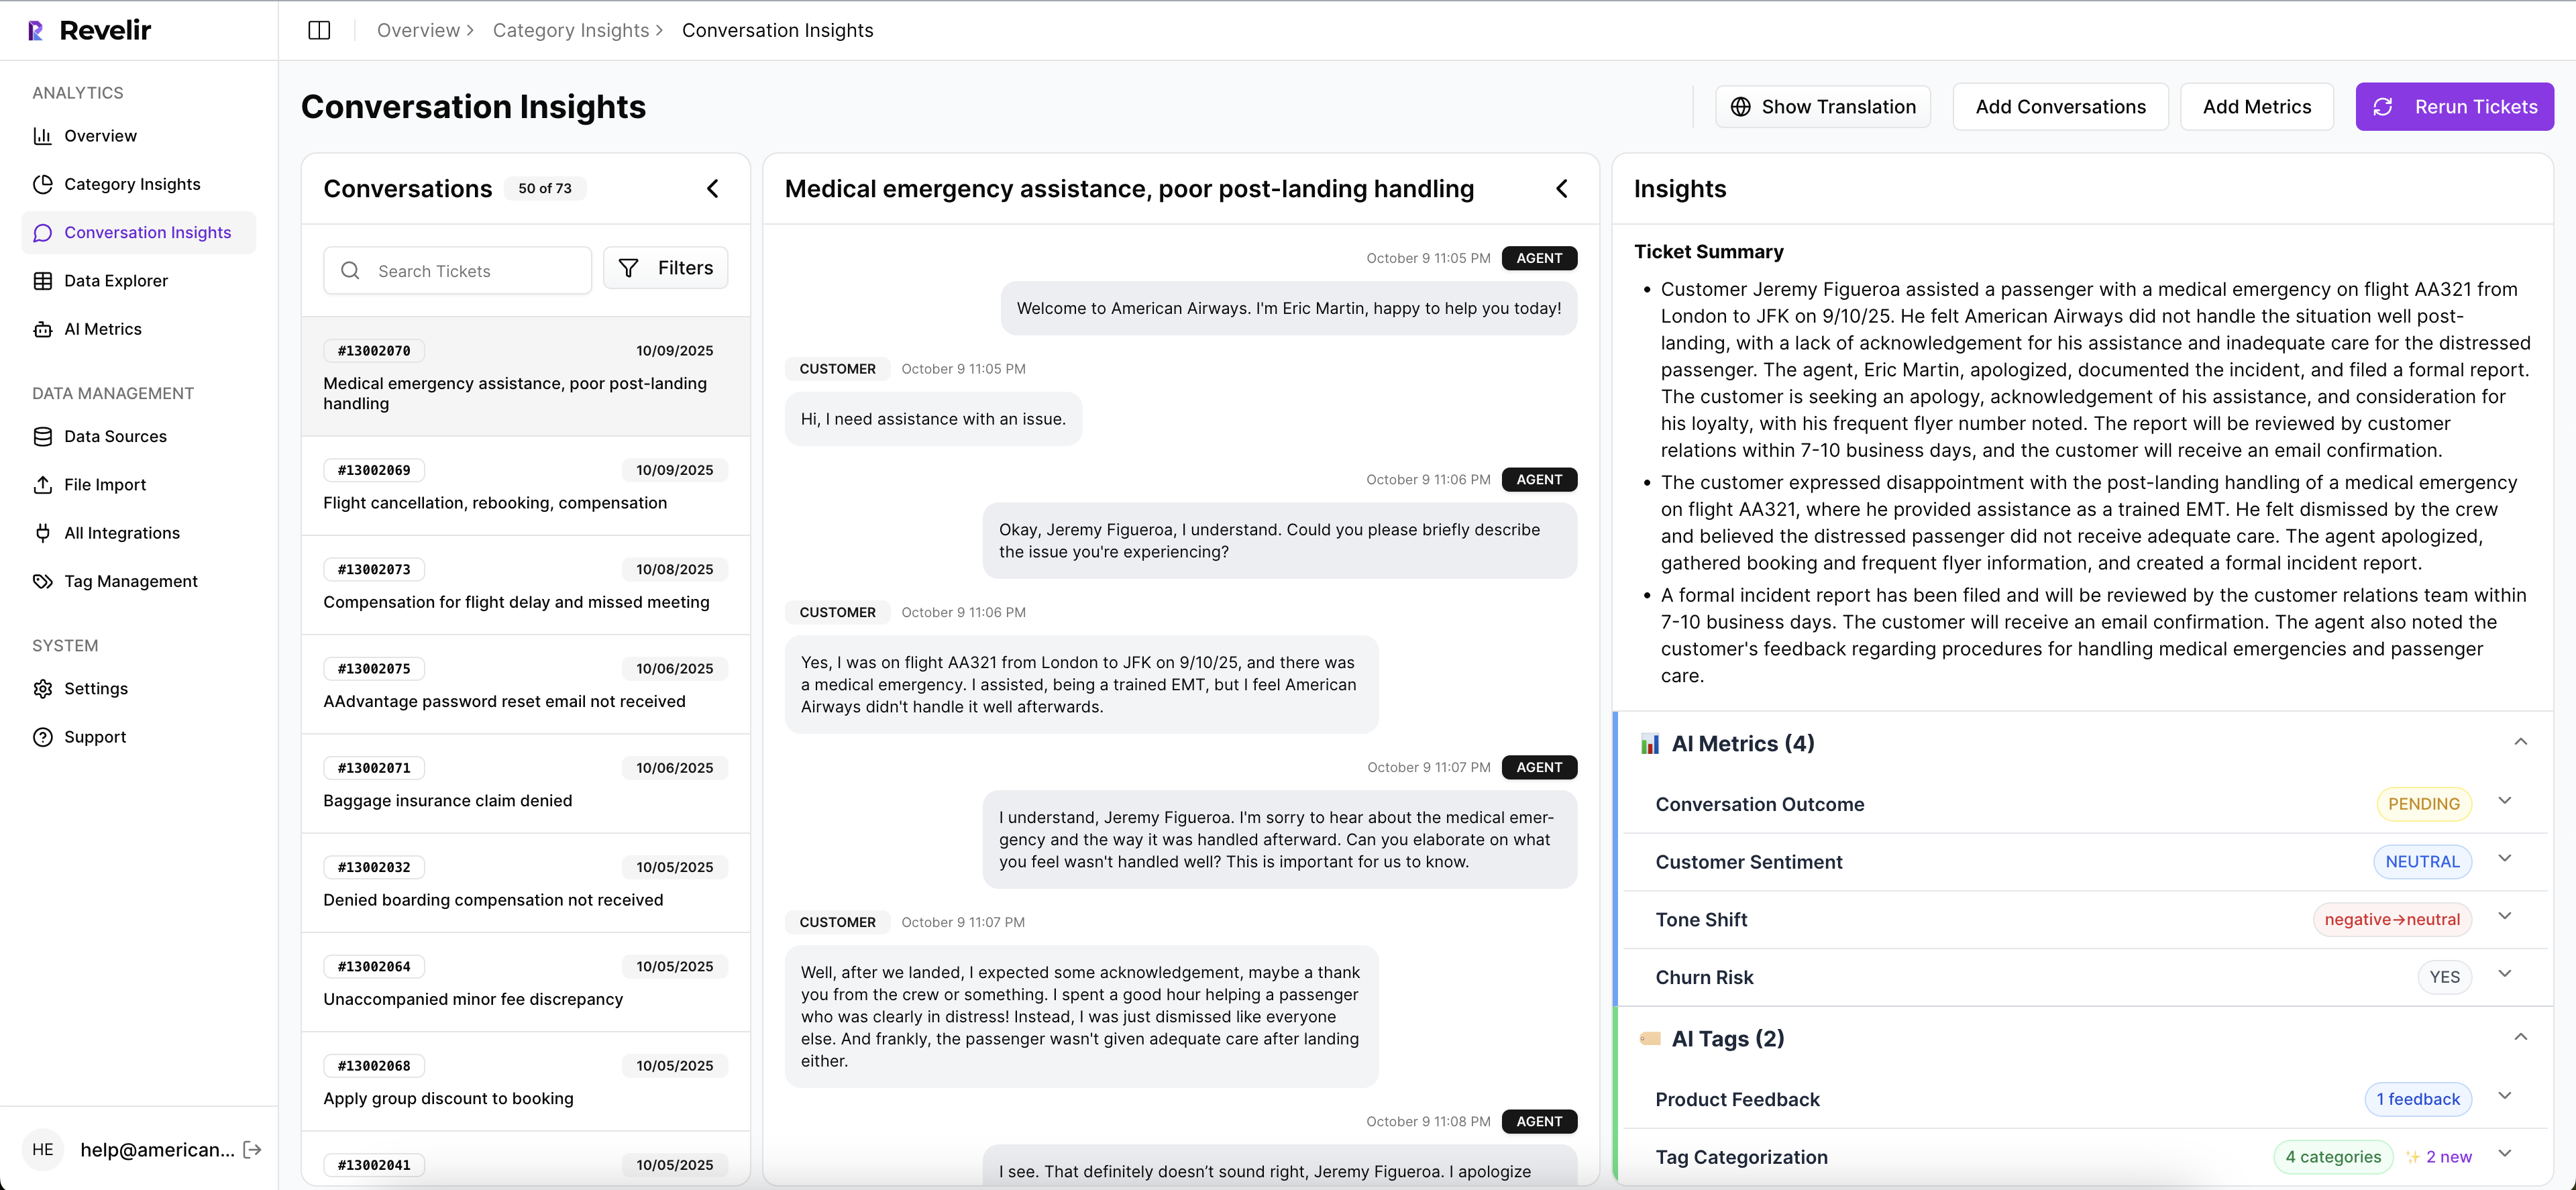
Traceability shortens meetings. You can start with an aggregate, drill into three representative tickets, and come back with a shared understanding of the “why.” Decisions move faster because the evidence is built in. No black boxes. No “trust us.”
Want to see full coverage, hybrid tagging, and click‑through evidence working together on your own tickets? Get Started With Revelir AI
Conclusion
Most teams don’t lack data; they lack a pipeline that turns conversations into evidence‑backed metrics people trust. Build for 100% coverage, hybrid tagging, first‑class metrics, and two‑click traceability, and the debates get shorter while the fixes get faster. Whether you roll your own or use Revelir AI, set the bar at “evidence or it didn’t happen.”
CTAs: Learn More, Learn More, https://Learn More
Frequently Asked Questions
How do I set up Revelir AI with my helpdesk?
To set up Revelir AI with your helpdesk, start by connecting your support platform, such as Zendesk. Once connected, Revelir will automatically ingest historical tickets and ongoing updates. This means all your conversation data will be processed without needing manual exports. After the initial setup, you can verify that the ticket counts and timelines are accurate. This integration allows Revelir to apply its AI tagging and metrics engine to your support conversations, ensuring you get structured insights quickly.
What if I want to customize AI metrics in Revelir?
You can customize AI metrics in Revelir by defining specific questions that reflect your business needs. For instance, you might want to track metrics like 'Upsell Opportunity' or 'Reason for Churn.' Simply specify the possible values for these metrics, such as Yes/No or High/Medium/Low. Once set up, Revelir will apply these custom metrics across your conversations, providing insights that are tailored to your organization’s language and requirements.
Can I validate insights from Revelir with real conversations?
Yes, you can validate insights from Revelir by using the Conversation Insights feature. This allows you to drill down into specific metrics and see the underlying conversations that generated them. For example, if you notice a spike in churn risk, you can click on that metric to view the exact tickets and transcripts. This way, you can ensure that the patterns you see in the data align with the actual customer feedback, providing a reliable basis for your decisions.
When should I use the Analyze Data feature?
You should use the Analyze Data feature when you want to gain deeper insights into your support conversations. This tool is particularly useful for answering specific questions like 'What’s driving negative sentiment?' or 'Which issues are associated with high churn risk?' By selecting relevant metrics and grouping them by dimensions like drivers or canonical tags, you can quickly identify trends and patterns in your data, allowing for more informed decision-making.
Why does Revelir AI focus on 100% conversation coverage?
Revelir AI emphasizes 100% conversation coverage to eliminate the biases and blind spots that come from sampling. When every ticket is analyzed, you can catch critical signals that might otherwise be missed, such as subtle frustration cues or churn mentions. This comprehensive approach ensures that your insights are based on complete data, leading to more accurate and actionable metrics. It helps you make decisions grounded in evidence rather than assumptions.