

Most teams skim support data and hope trends tell the story. Tickets go up, CSAT dips, a dashboard turns red. Then the debate starts, and you are back in spreadsheets trying to prove what everyone felt in their gut. The truth sits in the conversations. Not just the scores. The actual words.
If you want decisions, you need two things: complete coverage and visible evidence. Every metric traced to a real conversation that anyone can audit in seconds. That is how you cut through the noise, stop arguing about samples, and move on what matters. You can do this without ripping out your stack. You just need a way to turn unstructured text into metrics people trust. Tools like Revelir AI exist to do exactly that.
Key Takeaways:
- Stop sampling. Process 100% of tickets so early signals are captured, not lost in a 10% hand review.
- Close the trust gap with evidence-backed traceability that links every metric to real quotes.
- Treat “accuracy” as trustworthy aggregates with click-through validation, not perfection on every ticket.
- Replace manual plumbing with a production pattern for ingestion, taxonomy, metrics, and audits.
- Use drivers and canonical tags to translate raw noise into executive-ready decisions.
- Move from pattern to proof in one click, then export consistent metrics to BI for enterprise reporting.
Why Sampling And Score-Watching Fail When You Need Evidence
Sampling fails because it hides weak but important signals and introduces bias exactly where you can least afford it. Full-coverage analytics turns debates about representativeness into action on verifiable trends. When every metric links back to quotes, you end stalls in the room and align on next steps quickly.
The signals you miss at 10% coverage
A ten percent hand-review of 1,000 tickets is five hours spent on a partial view. The quiet churn mentions, early performance gripes, and “something feels off” friction often hide in the other 900. That is where risk compounds. With 100% processing, you pivot across cohorts and product areas confidently and stop guessing.
What is evidence-backed traceability and why it changes decisions
Evidence-backed traceability means every chart, count, and classification clicks back to the exact conversation and representative quotes. In a meeting, that ends “show me the example” stalls. You show the trend, click the number, read three quotes, and align. Transparency is not a nice-to-have, it is the trust engine. Standards reinforce this need for transparent, auditable reasoning.
Why basic sentiment labels stall in the room
A red tile labeled “negative” does not say what to fix. Without drivers, canonical categories, and frustration signals, teams ship band-aids while core issues persist. The fix is traceable metrics tied to drivers and quotes. Then “negative sentiment” becomes “billing fee confusion among new accounts,” with words customers actually used.
Curious what this looks like in practice? See how Revelir AI works.
The Real Bottleneck Is Unstructured Conversations, Not A Lack Of Dashboards
Dashboards are fine once data is structured. The bottleneck is turning free text into tags, drivers, and metrics people trust. You need ingestion that keeps data fresh, a hybrid taxonomy that stabilizes reporting, and a metrics layer you can drill into. Without this backbone, volume charts are all you get.

What traditional approaches miss in helpdesk data pipelines?
Most stacks underestimate the messy middle. You need historical backfill plus ongoing sync, idempotent upserts, and lineage to reprocess safely. You also need to extract transcripts and metadata, not just ticket IDs. Start where your data lives, for example Zendesk, then plan for change detection and retries so your analytics stay current without fire drills.
The hidden complexity behind ingestion and taxonomy
A hybrid tagging model, with AI-generated raw tags for discovery and canonical tags plus drivers for clarity, is what makes patterns stable and communicable. As mappings mature, analysis becomes repeatable and leadership-ready. Raw tags keep you curious. Canonical tags keep you consistent. Drivers translate detail into strategy.
Why “accuracy” means trustworthy aggregates, not perfection
Semantic labels are not 100% consistent even between humans. The bar you want is reliable aggregates that hold up when you click into the tickets. Set clear definitions, accept edge-case variance, and require traceability. That combination is enough for product and CX to move confidently without chasing impossible per-ticket perfection.
Ready to eliminate spreadsheet plumbing and still keep trust high? Learn More.
The Compounding Cost Of Partial Views And Manual Plumbing
Partial views waste time and delay decisions. Manual exports and sampling create rework every week. Those hours add up, and they spike right when you need answers fast. The harder truth is the cost you do not see yet, like late churn detection and avoidable escalations that damage renewals
.
Engineering hours burned on exports and fixes
Let’s pretend your analysts export weekly CSVs, normalize tags, and hand-label 300 tickets. That is 6 to 10 hours per cycle, plus version mismatches when definitions change. Over a quarter, you sink weeks into plumbing. While this happens, the team debates methodology instead of shipping fixes. That is opportunity cost, not just labor spend.
What’s the financial risk of delayed churn detection?
If churn risk surfaces late, win-back odds collapse. A one-week delay during renewal season can cost multiple enterprise logos. Full coverage with churn-risk flags moves outreach earlier. You will not save every account, but you will change timing and outcomes meaningfully. Enterprise platforms recognize similar value in proactive models for how predictive signals support operational decisions.
Governance gaps that erode trust
When you cannot trace a KPI to source tickets, objections win. Leaders ask for proof, and you show stitched spreadsheets. Confidence drops. A governed taxonomy, defined metric rules, and one-click traceability turn objections into audits that pass. Principles highlight accountability and transparency for a reason.
When Trust Breaks, Momentum Dies
Trust breaks the moment you cannot produce examples. You feel it. The energy in the room shifts from “what do we fix” to “how do we know.” Evidence-backed traceability resets that dynamic. It keeps everyone focused on decisions, not the provenance debate.
“Show me the quote” and the conversation freezes
We have all been there. You bring a trend, someone asks for examples, and you stall while hunting. With traceability, you open the subset, read three quotes, and align. Short pause. Decision made. The ability to pivot from chart to transcript in one click saves the meeting.
How do teams feel when metrics aren’t verifiable?
Frustrating rework. Nervous about pushing for roadmap changes. Worried about being directionally wrong. Verifiable evidence changes the emotional tone. Analysts step out of Excel purgatory. CX leaders present with confidence. Product trusts the “why,” not just the number. Culture shifts from hedging to action.
The 3am incident and the missed early signals
You remember the outage. Pager pings at 3am, dashboards flood, and everyone scrambles. The precursor, weeks of subtle performance complaints, sat in “neutral” sentiment because no one captured drivers at scale. Full coverage and drivers raise small flags earlier so spikes feel less like surprises and more like solvable problems.
A Production Pattern For 100% Coverage With Built-In Traceability
A durable path exists. Think in five layers, each simple on its own and powerful together. Ingestion to get conversations in, taxonomy to make sense of language, metrics to quantify meaning, traceability to prove it, and light QA to stay honest. Ship this pattern once, and every question gets easier.
Design your ingestion plan
Start with a historical backfill, CSV or API, then enable ongoing sync with idempotent upserts. Capture transcripts, timestamps, requester and assignee, tags, and relevant metadata. Plan for rate limits with retries and backoff. Store source system IDs so lineage is clean and reprocessing does not duplicate tickets. This foundation keeps analysis fresh without manual exports.
Define tag taxonomy and drivers
Adopt a hybrid tagging model. Let AI generate raw tags for discovery, then map them to a smaller set of canonical tags for reporting. Layer drivers, for example Billing, Onboarding, Performance, to translate granular signals into executive language. Version mappings so reports remain stable while the taxonomy evolves.
Build the AI metrics layer and traceability
Define clear options for each metric, Sentiment, Churn Risk, Effort, plus one or two custom metrics that match your business language. For every tag and metric, preserve pointers back to tickets and quotes. Make aggregate counts clickable to filtered ticket lists with transcripts. Transparent traceability is your audit trail and meeting superpower.
If you are wondering how this plays out in a real interface, not just a diagram, See how Revelir AI works.
How Revelir AI Automates Full-Coverage Analytics With Verifiable Evidence
Revelir AI automates the entire pattern you just read. Connect your data, and it processes 100% of conversations automatically, assigns AI metrics and tags, then makes every aggregate count clickable down to the exact quotes. Remember those weekly CSV exports and hand labels. You do not need them anymore.
Connect your helpdesk or CSV to Revelir
Connect Zendesk for ongoing sync or upload CSVs for pilots and backfills. Revelir AI ingests ticket metadata, full transcripts, and existing tags, then runs full-coverage processing on every conversation. You get insights in minutes, not weeks of manual setup, and the data stays fresh without exports.
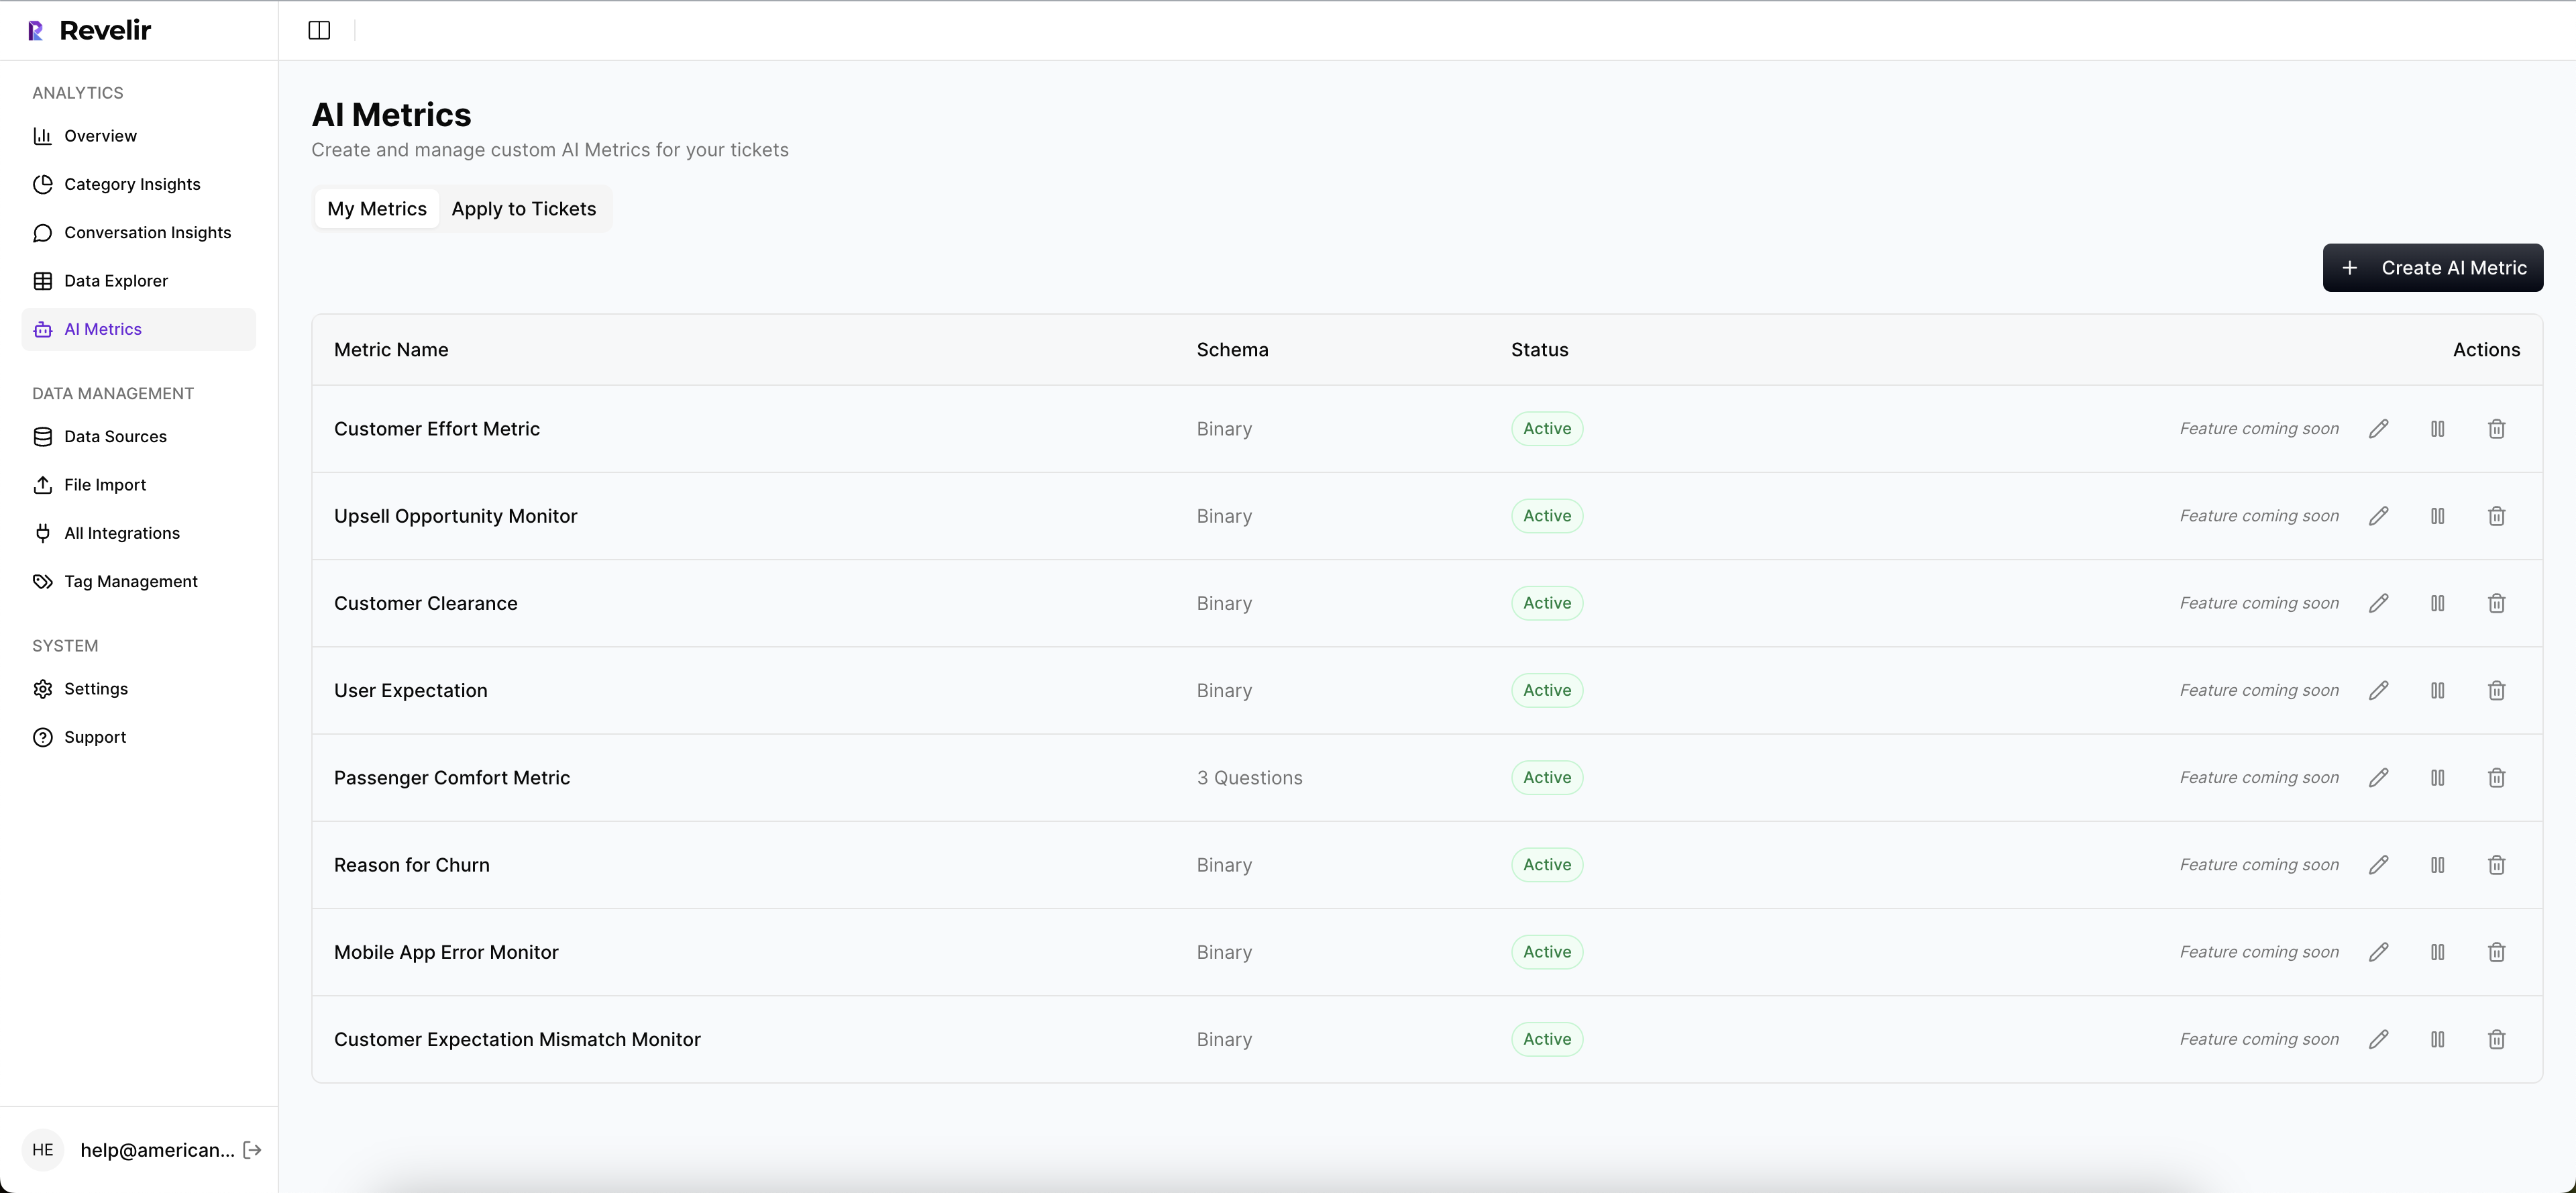
Configure canonical tags, drivers, and AI metrics
Start with core metrics, Sentiment, Churn Risk, and Customer Effort, then tailor canonical tags and drivers to your business language. Add Custom AI Metrics when you need domain-specific signals, for example a “Reason for Churn” or “Upsell Opportunity” classifier. Revelir AI remembers your mappings so future raw tags roll up consistently, stabilizing reporting while keeping discovery alive.
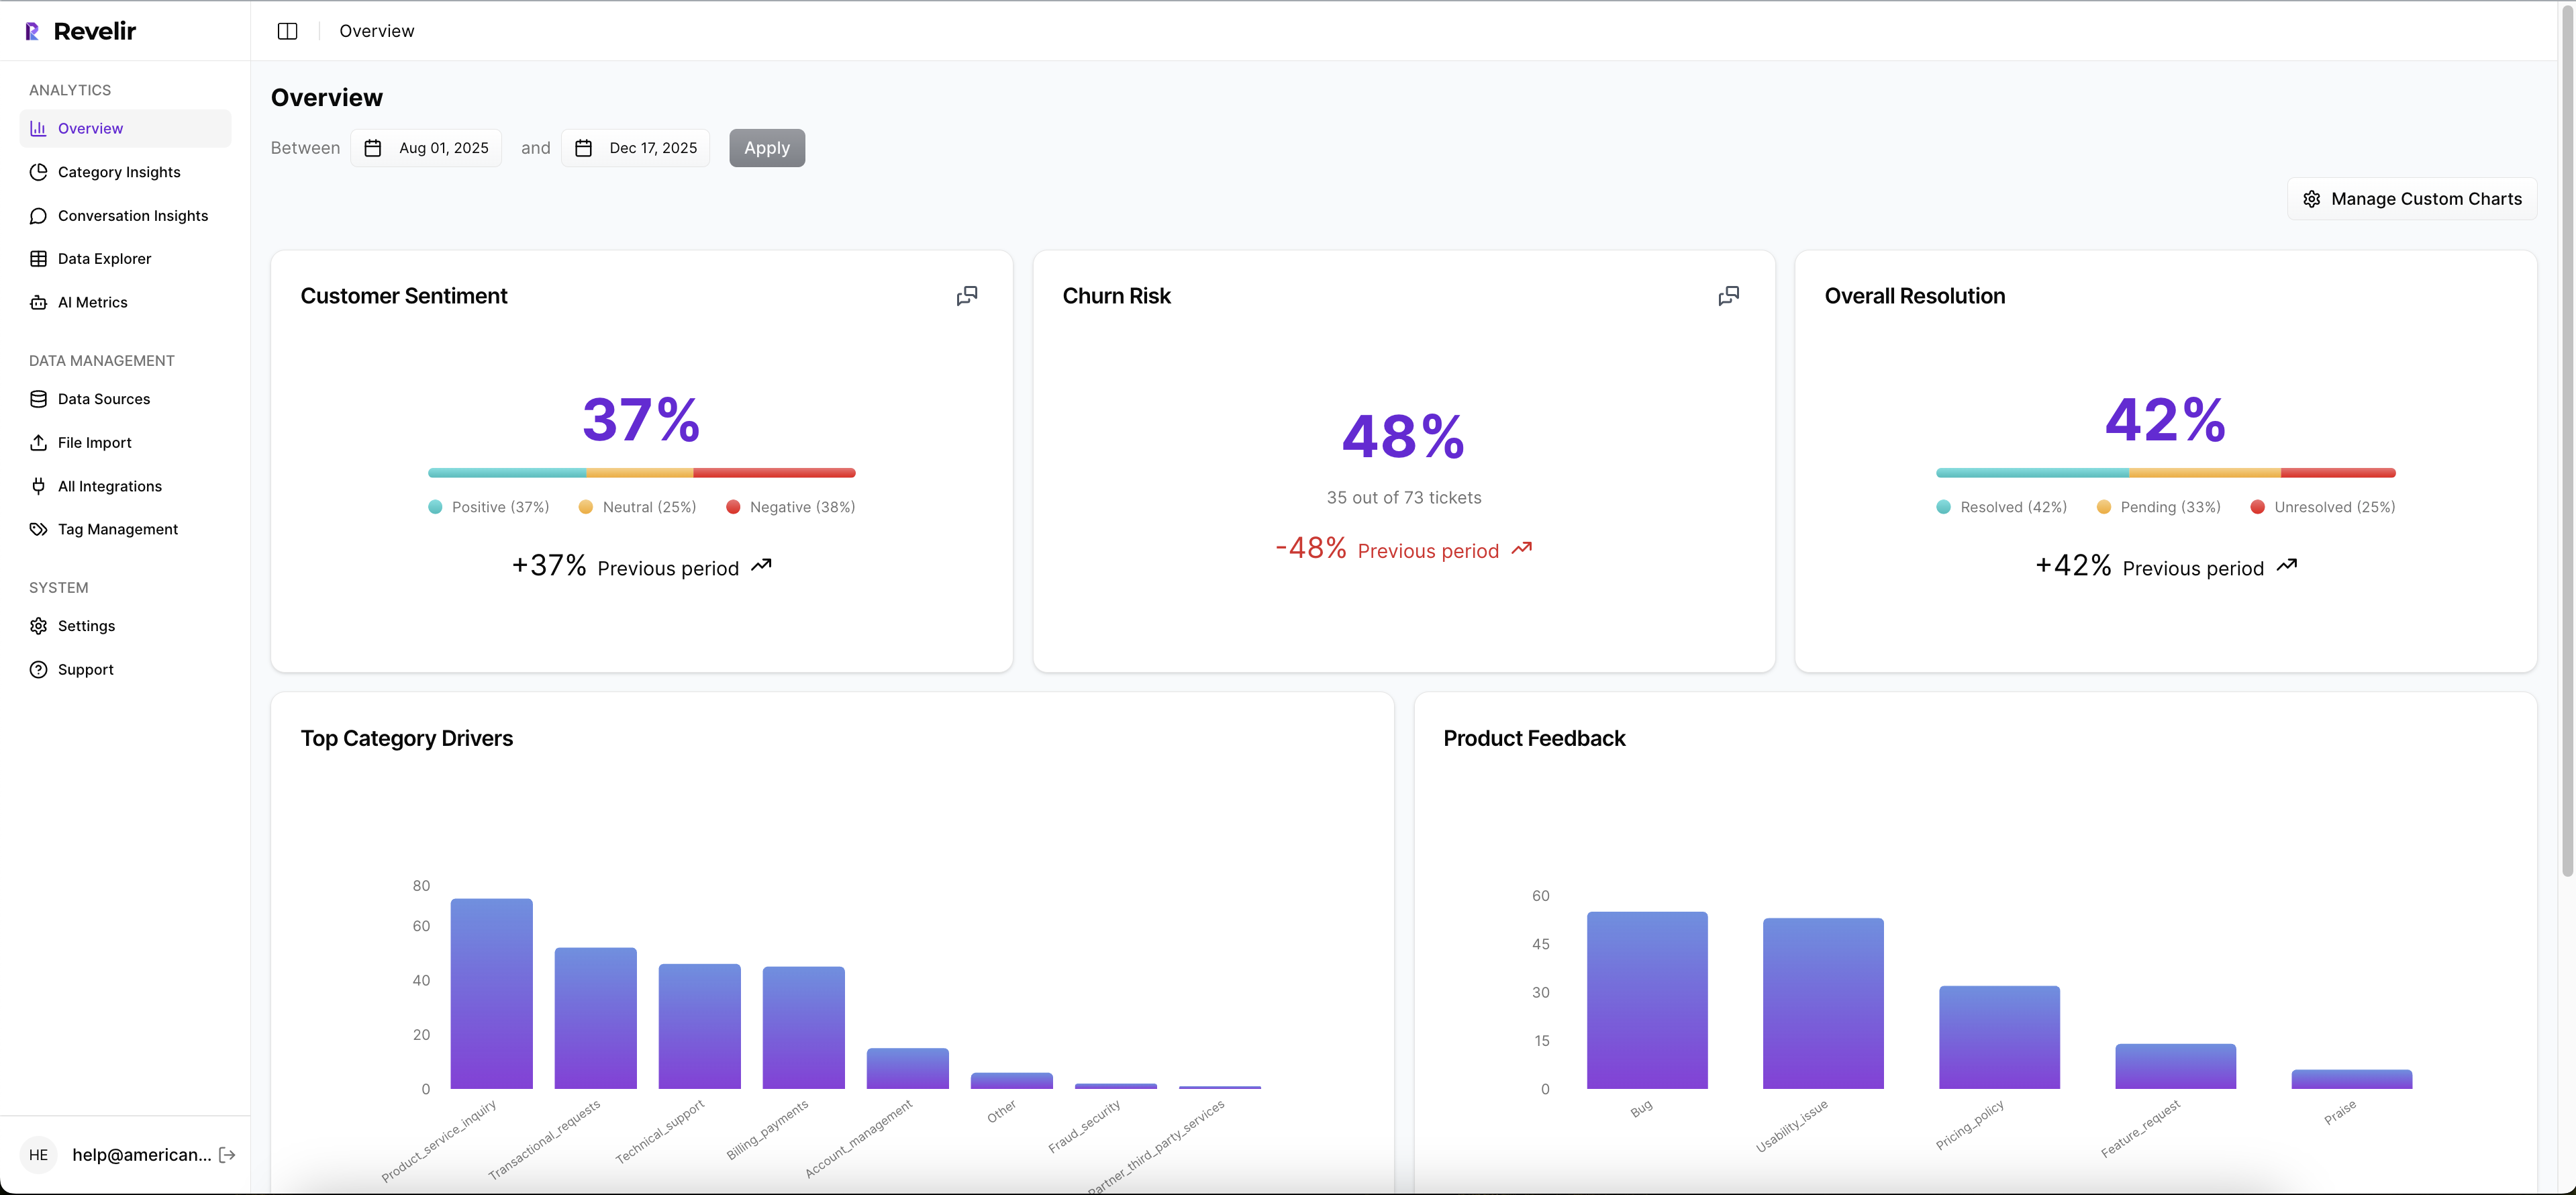
Explore, pivot, and drill into source quotes
Work primarily in Data Explorer and Analyze Data. Group metrics by driver or canonical tag, then click any count, for example “19 churn-risk tickets,” to open Conversation Insights with full transcripts, AI summaries, tags, and metrics. This one-click path from pattern to proof closes the trust gap and keeps meetings moving.

Export metrics to BI and operational workflows
Answer deeper questions in Revelir AI, then export structured metrics via API to your BI stack so CX, product, and finance all reference the same definitions. One measurement layer, many consumers. Teams avoid the version war and talk about what to fix instead of whose spreadsheet is right.
Remember that compounding cost from manual plumbing and late churn detection. Revelir AI removes the weekly exports, automates the tagging and metrics engine, and preserves traceability that wins the room when someone asks for examples. By anchoring every metric to the exact conversation, Revelir AI replaces doubt with audit-ready clarity. Teams cut time-to-insight, shift outreach earlier on high-risk accounts, and prioritize fixes with confidence.
Ready to see this on your own data, not a sample? Get started with Revelir AI (Webflow).
Conclusion
If your support data only shows up as volumes and a handful of scores, you will keep debating anecdotes and chasing band-aids. The faster path is simple to describe and practical to run. Process every conversation, structure the language into drivers and canonical tags, quantify meaning with clear metrics, and make evidence visible by default. Trust improves. Decisions accelerate.
You can build the pattern yourself, or you can let a product like Revelir AI handle the heavy lifting. Either way, insist on 100% coverage and traceable metrics that click back to real quotes. That is how you move from “we think” to “we know,” and from meetings to outcomes that customers actually feel.
Frequently Asked Questions
How do I set up Revelir AI for ticket analytics?
Setting up Revelir AI is straightforward. First, you'll need to connect it to your existing ticketing system. You can typically do this in just a few clicks. Next, configure the ingestion settings to ensure it captures 100% of your tickets. This way, no important signals are missed. Finally, you can begin analyzing trends and metrics by exploring the dashboard, which provides evidence-backed insights linked to actual conversations. This setup allows you to move away from relying on samples and instead focus on real data.
What if I want to track specific metrics?
If you want to track specific metrics, first identify what’s most important for your team—like customer satisfaction scores or ticket resolution times. With Revelir AI, you can customize the metrics you want to monitor. Simply go to the metrics settings and select the ones that matter most. You can also create custom tags to help categorize tickets, making it easier to generate reports that focus on your key performance indicators. This way, you’ll have a clear view of how your team is performing.
Can I validate my analytics data?
Absolutely! Validating your analytics data is crucial for trust. With Revelir AI, you can use click-through validation features that link each metric back to the original conversations. This means that whenever you see a metric, you can dive deeper and verify the evidence behind it. It’s about ensuring that your decisions are based on solid data rather than just estimations. Regularly check these validations to maintain accuracy in your reporting and to build trust among your team.
When should I replace manual data tracking?
You should consider replacing manual data tracking as soon as you notice that it's consuming too much time or leading to errors. If you find yourself spending hours sifting through spreadsheets and still not capturing the full picture of customer feedback, it’s time for a change. Revelir AI streamlines this process by automating ticket analytics, allowing you to focus more on action rather than data collection. Transitioning to an automated system can also help you capture early signals that manual methods might miss.
Why does ticket sampling fail?
Ticket sampling typically fails because it doesn't provide a complete view of customer interactions. Important signals can get lost in a small sample size, leading to biased insights. By using Revelir AI, you can process 100% of your tickets, ensuring that every piece of feedback is accounted for. This full-coverage approach helps you make informed decisions based on real data rather than assumptions. It cuts through the noise and focuses on evidence-backed trends that matter.