

Cutting 30 percent of support volume without spinning up a massive ML project isn’t fantasy. It’s usually a targeting problem, not a tooling gap. You already know where customers struggle from tickets. The trick is turning that evidence into precise, respectful nudges that intercept problems before they hit the queue.
We’ve done this in messy environments—multiple channels, no clean taxonomy, executives worried about overcontact. The path forward is simple enough to start this quarter. Map your top drivers to product- and behavior-level events, set conservative thresholds, and measure deflection with holdouts. Revelir AI provides the evidence layer, so you’re not guessing which triggers matter.
Key Takeaways:
- Convert ticket drivers into explicit triggers, then nudge at the right moment and channel
- Start with rules, add small classifiers later where language nuance matters
- Track false positives and frequency caps like SLOs to prevent backlash
- Measure deflection with holdouts; tie impact to sentiment, effort, and churn risk
- Use evidence-backed metrics (100% coverage, traceability) to defend your playbook in the room
The Default Playbook Keeps You Reactive And Expensive
Static FAQs and reactive queues miss early risk signals because the signal lives in conversations and product events, not generic content. Most teams see volume changes but can’t pinpoint drivers fast enough to intervene. A simple trigger system, tied to the right evidence, flips you from responding to preventing.
Why static FAQs and reactive queues miss early risk signals
Teams publish more help articles and expect deflection. Fine for known questions; useless for messy, time-sensitive problems. Early churn cues—setup failures, billing confusion, access loops—hide inside conversations and event streams. If nobody’s checking the event stream against drivers, you’ll miss the window where a two-sentence nudge would have prevented the ticket.
What actually works is full coverage of support data connected to a short list of drivers. When you can say, “New-customer negative sentiment spiked from onboarding friction and payment failures,” you have a plan you can trigger on. Otherwise you’re updating FAQs while users spin, frustrated, then write in. Same thing with escalations: the first complaint is fixable; the twentieth is expensive.
What is an AI post‑purchase journey, and why now?
Think of a journey as a set of event triggers plus a small brain that picks the right nudge. Post‑purchase, that brain watches for risk patterns like failed setup, payment confusion, or access issues, then chooses timing, channel, and tone. It doesn’t need heavy ML; it needs clear signals and guardrails.
Two reasons this matters now. First, your product already emits useful events you can act on within minutes. Second, AI can safely personalize tone and examples when you keep prompts constrained. If you want a broader primer on journey design, this overview of customer journey mapping with AI is a solid foundation—pair it with your ticket evidence, not just clickstream.
The insight most teams ignore: drivers turn into triggers
You already know the top drivers of negative sentiment and churn risk from ticket analysis. The overlooked move is turning those drivers into explicit, observable triggers. “Billing fees” isn’t a dashboard tile; it’s payment_failed events plus recent negative sentiment for a segment of new accounts.
When you translate drivers into events, respectful nudges reduce friction and deflect tickets at the source. Agents get back time for severity work. And you get out of the “publish and pray” loop. The win isn’t mystical—fewer avoidable tickets, lower handle time, better sentiment among the customers who would’ve written in.
Want to pressure‑test this approach on your own data? We can show it end‑to‑end with real ticket evidence. See how Revelir AI works.
Turn Ticket Evidence Into Triggerable Events
You turn evidence into triggers by mapping failure modes from drivers and canonical tags to product and behavioral events with clear thresholds. A small, public trigger dictionary keeps engineering, CX, and CRM aligned. The goal is adoption, not elegance—five to ten well‑defined triggers beat fifty that nobody trusts.
Map failure modes from drivers and canonical tags
Start with the last 90 days of tickets. Group by canonical tags and drivers to isolate top post‑purchase failure modes for new customers. This is where “raw tags for discovery, canonical tags for clarity” pays off—noise becomes a shortlist you can act on. Then write crisp trigger definitions: observable signals, timeframe, severity, and owner.
Keep scope tight. Five to ten triggers is enough to change volume. Clear names and example payloads matter; if engineering and CRM owners can’t quote them, they won’t wire them. We’ve seen teams try to model the world in v1. Don’t. Ship the obvious friction first, then iterate.
How do you translate support signals into product and behavioral events?
If a human can describe it, you can log it and trigger on it. “Account_lockout” becomes three failed logins in ten minutes. “Onboarding_friction” becomes a setup step not completed within 24 hours. Attach traits—plan tier, region—and prior sentiment to refine prioritization without overcomplication.
Enrich gently. You don’t need a feature store on day one. Start with the product event, add one or two customer traits, and include the most recent driver or sentiment snapshot so the message feels specific. For more patterns beyond setup, this piece on tailoring customer journeys through AI offers useful considerations—just remember: your tickets tell you which patterns matter.
Build a minimal trigger dictionary that engineering will adopt
Create a public doc with trigger name, event payload, threshold, cooldown, consent requirements, and owners for code and CRM changes. Version it. Add one example payload per trigger so teams can test quickly. Put a deprecation policy in writing so old triggers don’t linger and cause noise.
Then socialize it in the weekly standup. Read one trigger aloud, click one example, show last week’s volume. Make it easy to challenge assumptions and propose edits. Interjection. Codify how you roll back a trigger when the false positive rate spikes. Operational muscle beats theoretical completeness here.
The Hidden Costs Of Waiting For Tickets
Waiting for tickets hides avoidable cost in plain sight: extra minutes, backlogs, context switching, and burnout. The math isn’t subtle, and neither is the false positive tax from sloppy triggers. Overcontact turns helpful into annoying, which drives new tickets. Treat these as measurable SLOs, not vague “we’ll be careful” promises.
A simple math of avoidable volume and handle time
Let’s pretend you handle 5,000 monthly tickets at 7 minutes per response and 1.5 responses per ticket. That’s 52,500 minutes. If 20 percent are post‑purchase avoidable issues, deflecting half saves 5,250 minutes this month. Less backlog. Fewer interrupts. Fewer “frustrating rework” loops from rushed replies.
Those minutes convert to real dollars or reclaimed time for severity work. And you don’t need a sweeping rearchitecture to get there. Two or three high‑quality triggers (setup friction, payment failure, account access) make a visible dent. We’ve seen teams regain calm just by shaving a couple of queues that were always on fire.
The false positive tax no one tracks
Every trigger can misfire. A premature nudge leads to extra contacts or confused users. Set an acceptable false positive rate per trigger and monitor it weekly. When rates drift, tune thresholds, timing, or copy. Treat it like an SLO: breaches get attention and a rollback plan.
Measure with simple proxies: how often nudges lead to help‑center visits, how often they still create tickets within 24–72 hours, how often users reply “this isn’t relevant.” Research on personalization programs shows the risk of noise and fatigue is real; data‑driven tactics only work when they respect attention (purchase personalization tactics overview).
What happens when you overcontact customers?
If one customer gets three nudges in 48 hours, they stop reading—or worse, they write in. Set frequency caps by channel and a global cap across channels. Back‑test caps against cohorts with prior negative sentiment to make sure you’re not suppressing the very users who need help.
If caps reduce impact, redesign the trigger or the message, not the cap. There’s robust discussion in marketing research about personalization fatigue and contact frequency—worth a skim when you set policies (analysis of personalization and consumer response). The point stands: your proactive program should net fewer tickets and better sentiment, not more noise.
Ready to quantify your hidden costs and identify the first three triggers worth shipping? We can map them from your ticket data in one session. Learn More.
The Human Side Of Post‑Purchase Friction
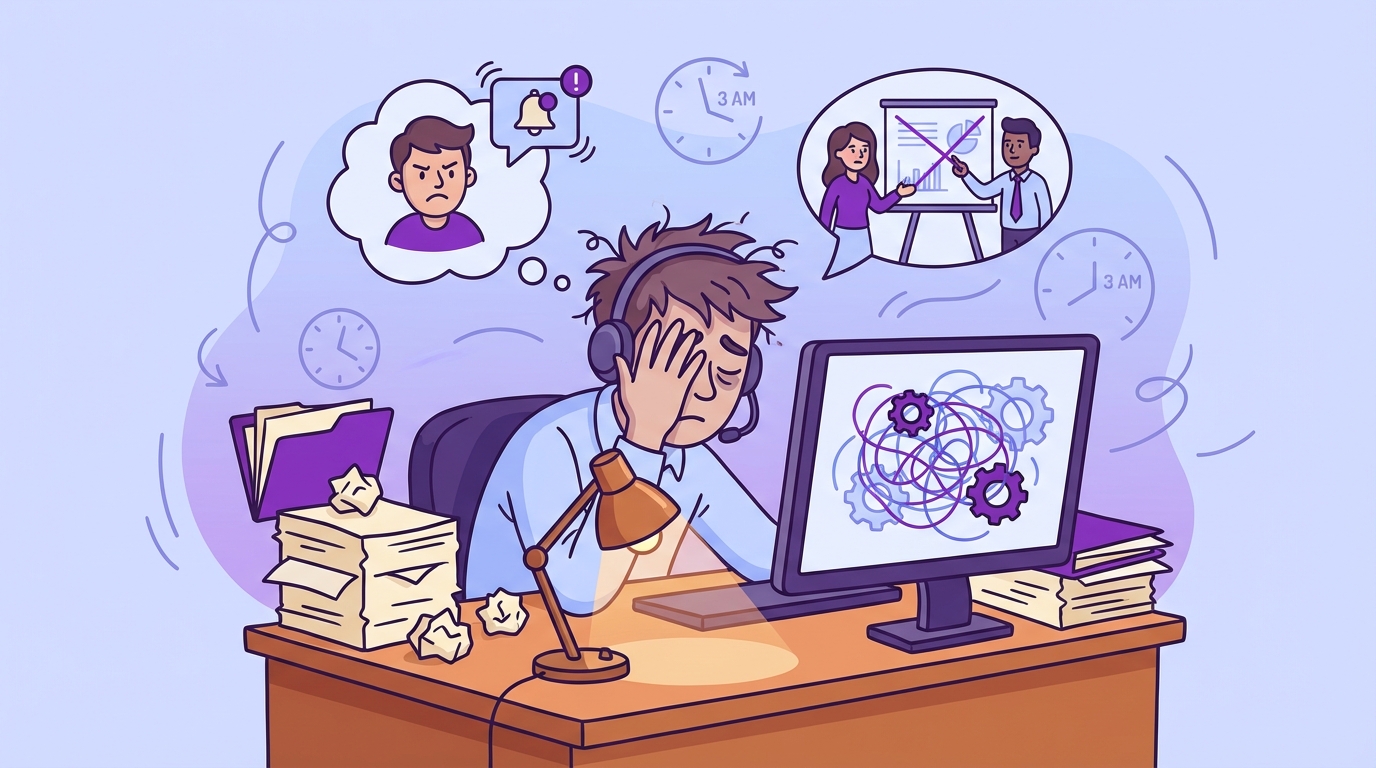
Post‑purchase friction isn’t abstract. It’s a new admin stuck at 3am, a loyal customer feeling nagged, a team dreading the churn review because everything devolves into anecdotes. Respecting timing, tone, and consent turns nudges into help—not spam—and keeps trust intact.
The 3am onboarding panic you could have prevented
You ship late. A new customer tries to connect an integration at 3am. It fails twice. They’re worried about Monday’s launch and too tired to browse articles. A timely in‑app prompt with one next step and a short checklist could save them. Don’t wait for their ticket.
Respect the hour. Choose channel wisely and keep tone calm. Reference exactly what failed (the event payload gives you that), acknowledge frustration, and offer a path that doesn’t require a support agent. If they ignore it, fine—follow with email later. The order matters when someone’s stressed.
When a loyal customer feels nagged instead of helped
A second nudge after the task is done feels like a slap, not support. Use real‑time status checks and cooldowns to avoid follow‑ups that rehash resolved tasks. Acknowledge completion explicitly. If you got it wrong, say so. That humility preserves trust—and prevents an annoyed ticket.
Also watch for language drift. Templates can age quickly; what sounded empathetic last quarter can read robotic now. Pull a few real quotes from recent tickets to refresh phrasing. Small touches—“we saw your update go through” vs. “your request was processed”—change how the message lands.
Why your team dreads the monthly churn review
If every churn review devolves into whose anecdotes count, people disengage. Evidence‑backed metrics change the tone. Show drivers, show example quotes, and show how proactive nudges affected sentiment and ticket volume. You’ll get faster decisions on what to scale and what to cut.
This is where traceability matters. When someone asks, “Where did this trigger definition come from?” you should be able to click into conversations and show the language that inspired it. Debates end. Decisions accelerate. And your program keeps its credibility with leadership.
A Practical Way To Build Event‑Triggered Personalization Fast
You don’t need a moonshot. Start with rules for obvious patterns, add small classifiers where text nuance matters, and keep prompts tight. Orchestrate channels with caps and holdouts so you can measure deflection without risking overcontact. Privacy and consent are guardrails, not afterthoughts.
Detect risk signals with rules and lightweight classifiers
Begin with rules: three failed logins in ten minutes; setup step incomplete at 24 hours; payment failure within the first billing cycle. Then add tiny classifiers for text‑heavy nuance—“setup confusion” yes/no; “churn risk” yes/no—trained on past tickets. Keep features simple: recent negative sentiment, prior driver, basic product events.
Evaluate for “makes sense” accuracy, not perfection. Lift thresholds until you meet your false positive SLOs. If precision drops, tighten the audience or add one more event condition. You’ll get 80 percent of the value from rules, the last 20 percent from focused classifiers you can audit.
Generate empathetic messages with safe prompts and templates
Draft templates that acknowledge context and give one next step. Use short generative prompts to adjust tone and include relevant links. Keep prompts constrained—approved phrases, blocked terms, product‑specific examples pulled from your own glossary. A human should read and nod: “Yes, this sounds like us.”
Measure downstream behavior. Did they click the checklist? Did tickets drop within the trigger cohort? If engagement is low, check the copy first, not the model. Often it’s the ask that’s wrong—too many steps, too much jargon, or missing the actual driver the user is experiencing.
Orchestrate email, in‑app, and chat without overcontact
Sequence by urgency and intrusiveness. Try in‑app first. If there’s no engagement, follow with email. Reserve chat handoff for high severity or high‑value customers. Apply channel caps and a global cap. Use holdouts to estimate deflection, not just CTRs. Route triggers and payloads to one messaging system, not everywhere.
Keep the playbook visible so everyone can audit the logic. Document how channels escalate and when they stop. You’ll avoid “friendly fire” between campaigns and product‑led nudges—and you’ll have a cleaner story when leadership asks what’s working.
How Revelir AI Supplies The Evidence Layer Your Journeys Need
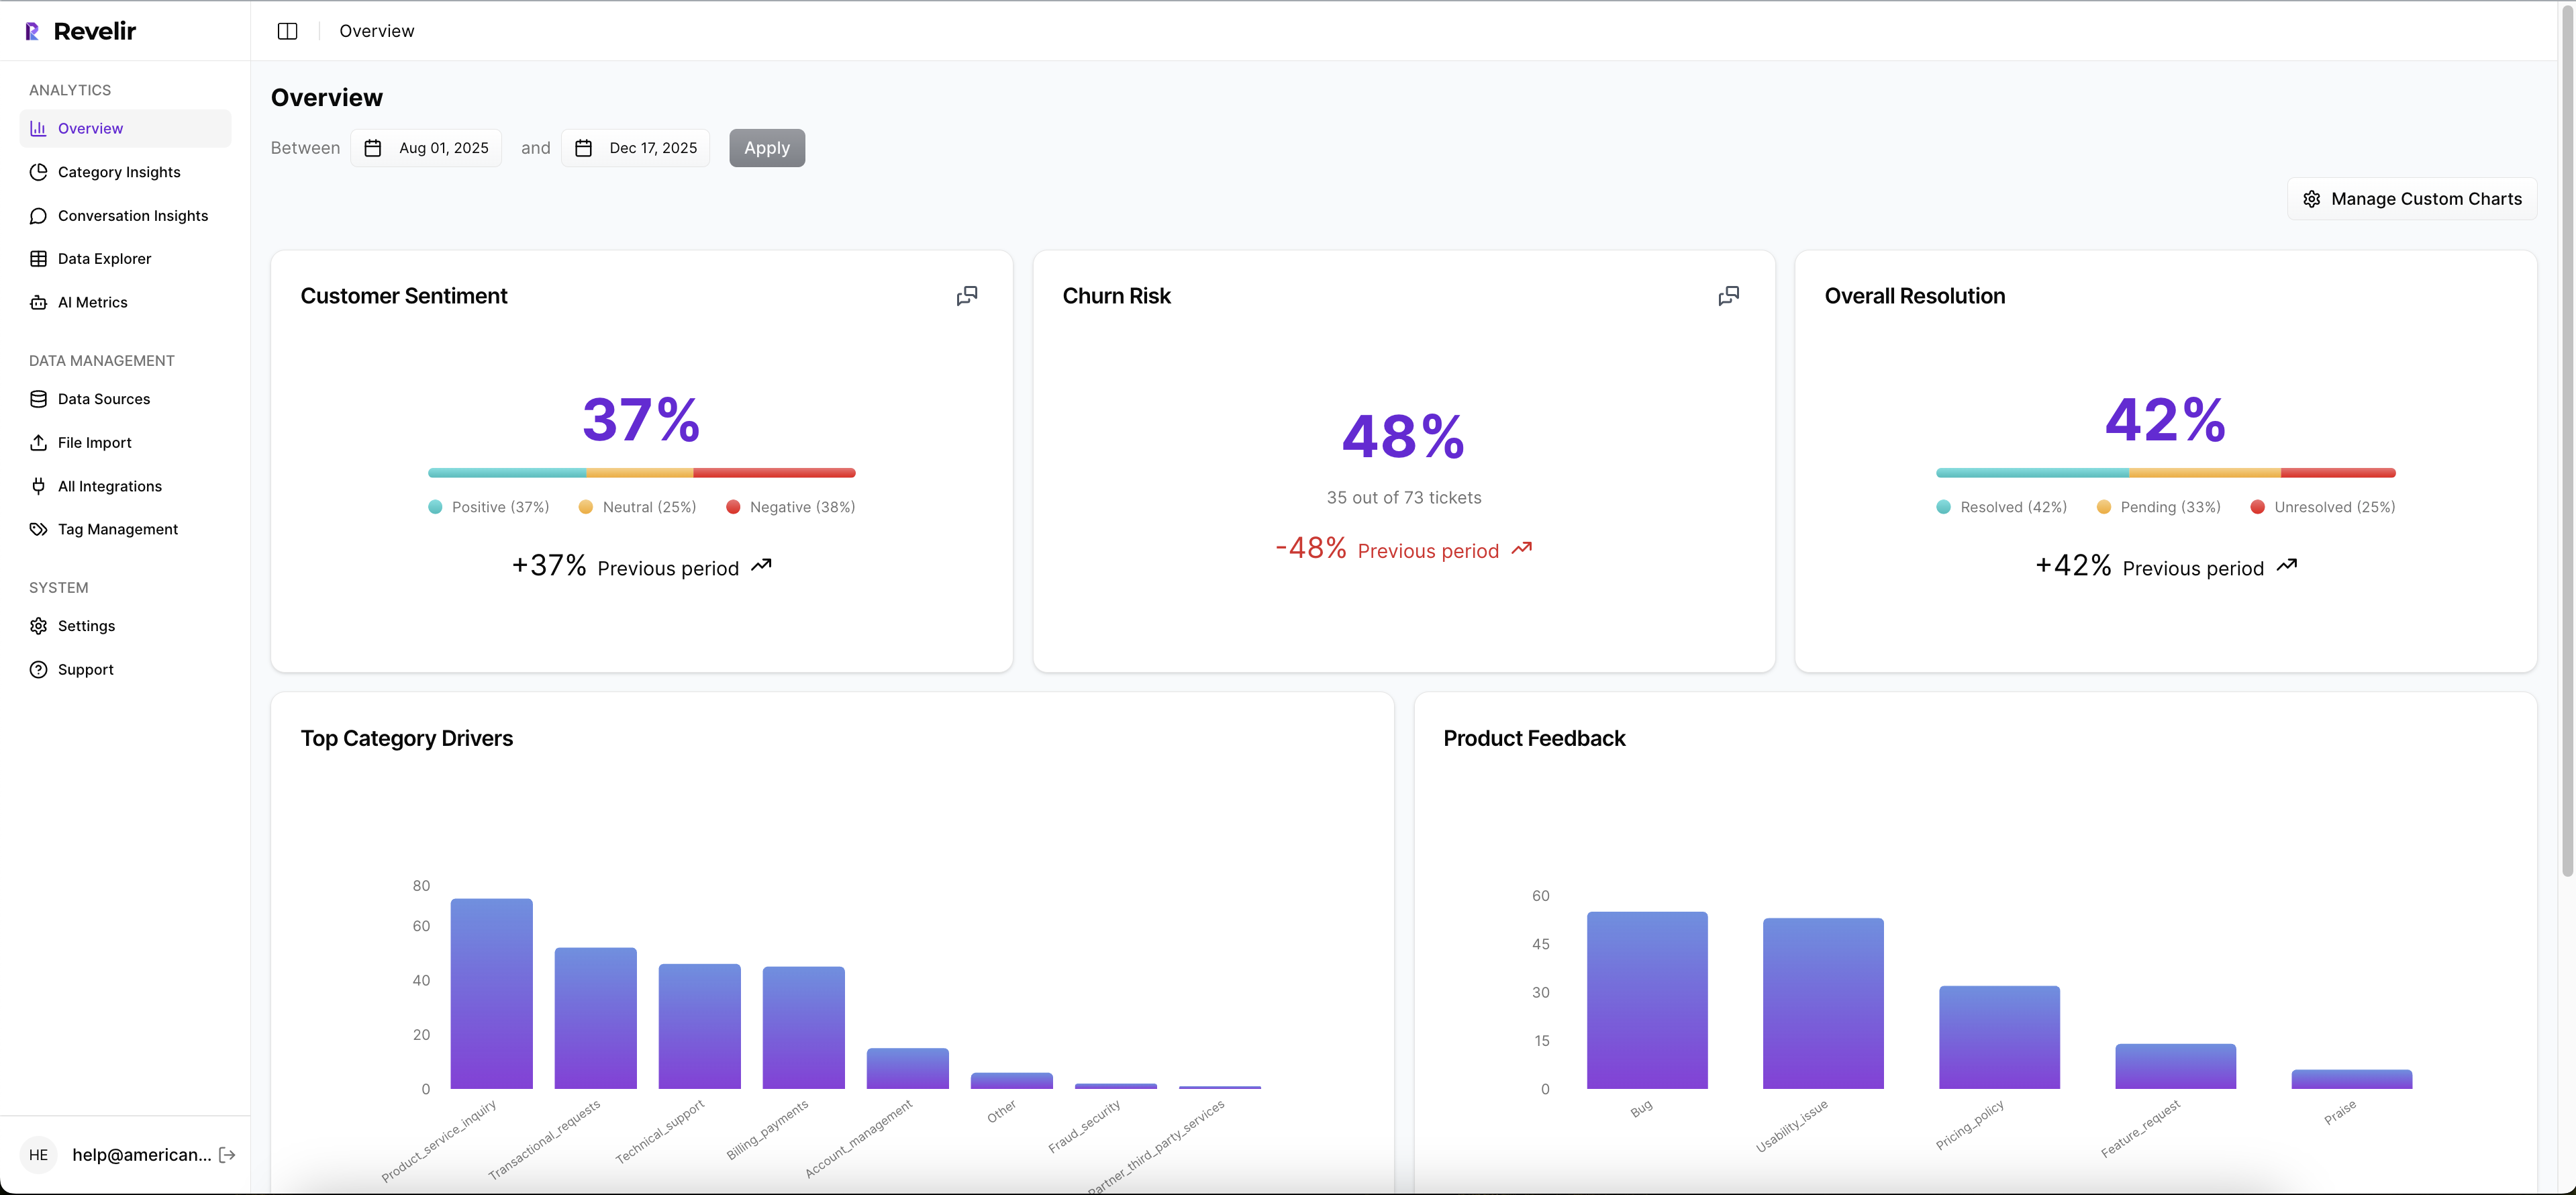
Revelir AI turns raw support conversations into structured, trustworthy signals you can use to define and tune triggers. It processes 100% of tickets, rolls raw tags into canonical tags and drivers, and keeps every metric clickable back to source conversations. That traceability makes your journey logic defendable, not debatable.
Full‑coverage tagging and drivers to define triggers
Revelir AI processes all your conversations—no sampling—then assigns raw tags, canonical tags, and drivers alongside metrics like Sentiment, Churn Risk, and Customer Effort. That lets you define trigger criteria with confidence, not guesswork. If onboarding friction and billing fees drive new‑account negativity, you can convert those drivers into event definitions your product and messaging tools watch.

Because Revelir remembers how raw tags map into your canonical taxonomy, reports stabilize and future data rolls up cleanly. You’re not rebuilding logic every month. You’re refining trigger thresholds based on the same consistent categories leadership trusts.
Evidence‑backed traceability that builds trust
Every aggregate in Revelir AI links down to the exact conversations and quotes behind it. When someone asks where a trigger came from, you open Conversation Insights and show the transcript. That keeps the playbook defensible—and helps refine prompts and templates using customer language, which reduces confused replies and follow‑up tickets.

Day to day, teams work in Data Explorer and Analyze Data to track sentiment, effort, churn risk, and volume by driver and cohort. You can export segments via API to join with messaging outcomes in your BI, design A/B holdouts, and compare ticket creation within 7 days of a trigger. When minutes saved and sentiment lift show up in one view, budget debates get easier.
If you want to ground your journey triggers in evidence from 100% of your conversations—and prove impact with drill‑downs—Revelir AI is built for that workflow. See how Revelir AI works.
Conclusion
Cutting support volume by 30 percent doesn’t require heavy ML. It requires turning ticket evidence into a small set of precise triggers, sending empathetic messages with guardrails, and measuring deflection with holdouts. The risk is real: false positives, overcontact, wasted minutes. The fix is operational: drivers → events → nudges, backed by metrics you can prove. When you ground journeys in evidence from every conversation, the queue quiets down—and your team gets back to the work that actually moves customers forward.
Frequently Asked Questions
How do I set up Revelir AI with my helpdesk?
To get started with Revelir AI, you can connect it directly to your helpdesk, like Zendesk. First, ensure you have access to your helpdesk API. Then, follow these steps: 1) Log into your Revelir account and navigate to the data management section. 2) Select the option to integrate with your helpdesk. 3) Follow the prompts to authenticate and link your helpdesk account. Once connected, Revelir will automatically ingest your support tickets, allowing you to analyze them for insights like sentiment and churn risk.
What if I want to customize metrics in Revelir AI?
You can define custom AI metrics in Revelir AI to match your business needs. To do this, follow these steps: 1) Go to the settings section of your Revelir dashboard. 2) Select 'Custom AI Metrics' and click on 'Create New Metric.' 3) Specify the metric name and the values it should capture (like 'Customer Effort' or 'Reason for Churn'). This customization allows you to tailor the insights to better reflect your organization's priorities and operational goals.
Can I analyze past conversations in Revelir AI?
Absolutely! You can analyze past conversations by uploading historical tickets to Revelir AI. To do this, follow these steps: 1) Export your past tickets from your helpdesk as a CSV file. 2) Log into Revelir and navigate to the data management section. 3) Select 'File Import' and upload your CSV. Revelir will process these tickets, applying its AI metrics and tagging system, allowing you to gain insights into historical trends and patterns in customer support.
When should I use the Analyze Data feature?
You should use the Analyze Data feature in Revelir AI whenever you want to gain deeper insights into specific metrics. For example, if you notice a spike in negative sentiment, you can analyze it by selecting 'Sentiment' as the metric and grouping it by 'Category Driver.' This will help you identify which issues are contributing to the sentiment change. Typically, using this feature regularly can help you stay on top of customer feedback and operational challenges.
Why does Revelir AI emphasize 100% coverage?
Revelir AI emphasizes 100% coverage because it ensures that every conversation is analyzed, which eliminates bias and blind spots that can occur with sampling. By processing all tickets, Revelir provides a comprehensive view of customer sentiment, churn risk, and other key metrics. This approach allows teams to make informed decisions based on complete data rather than relying on partial insights, ultimately leading to better customer experiences and more effective support strategies.