
Most teams think listening to customers means reading a handful of tickets and watching CSAT wiggles. It’s usually enough to feel informed, but not enough to steer a roadmap. The real signals are buried in the queue: frustration cues, churn mentions, unsolicited product feedback. If you don’t structure that evidence, you’ll debate anecdotes. Not decisions.
Here’s the thing. Your org doesn’t need another dashboard. You need a pipeline that turns every conversation into metrics you can slice, with receipts back to the exact quotes. When leaders ask “where did this number come from,” nobody’s checking a Google Sheet. You click the count. You show the transcript. The room moves.
Key Takeaways:
- Sampling and score-watching create false confidence; you need full-coverage evidence with traceability
- Canonical tags and drivers beat tag soup when you’re prioritizing fixes
- Quantify costs: rework, escalations, churn risk, and the time lost to meetings
- Run a six-step pipeline to move from raw conversations to backlog-ready, measurable work
- Use traceable quotes and acceptance criteria to unlock faster alignment with product and finance
Why Sampling And Score Watching Stall Your Roadmap
Sampling and score-only views stall roadmaps because they miss drivers and delay learning. Full-coverage analysis with traceable quotes shows what’s breaking and who’s affected, quickly. For example, instead of “sentiment dipped,” you can show “new users hit onboarding snags” and open three representative transcripts on the spot.
What Actually Lives Inside Support Conversations?
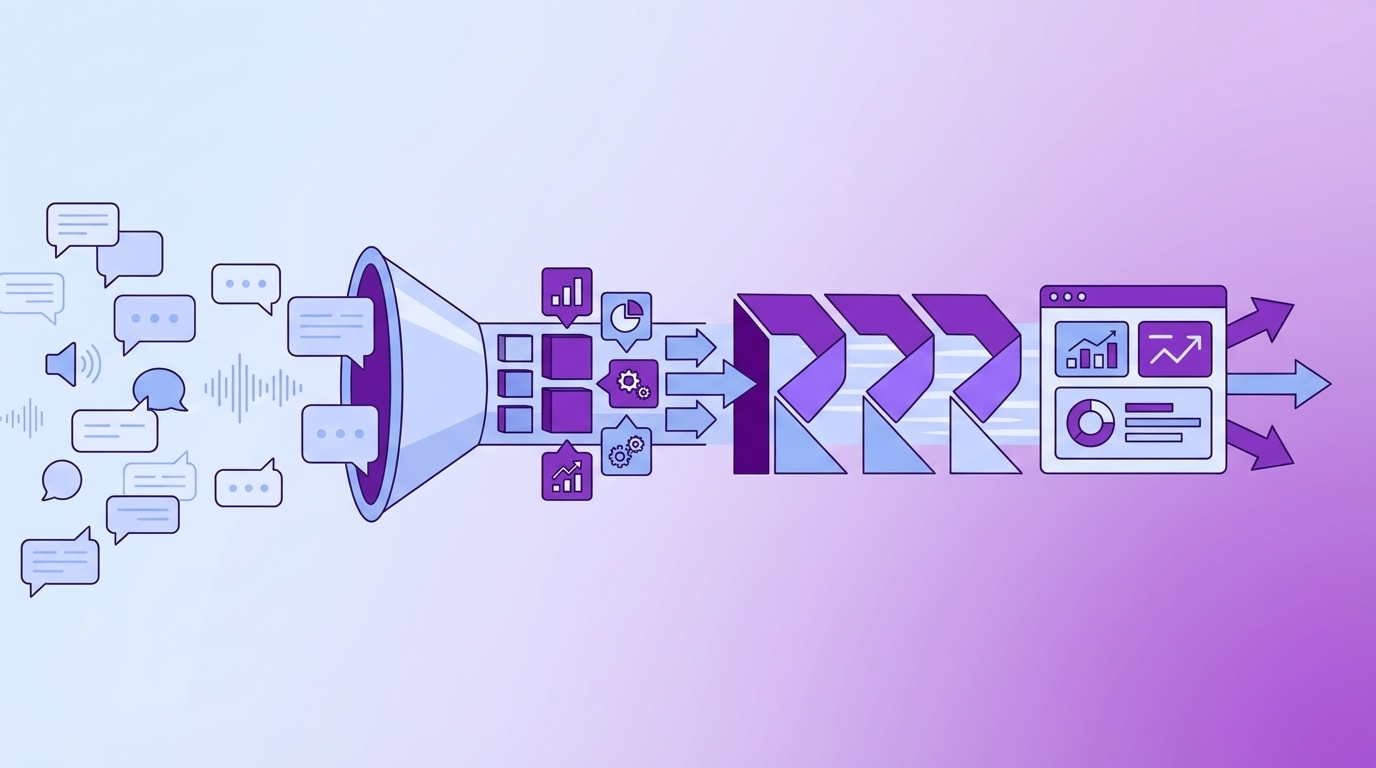
Support conversations aren’t just complaints; they’re a continuous stream of unsolicited product feedback, frustration signals, and explicit churn mentions. CSAT curves and NPS verbatims, while useful, rarely reveal where the experience breaks or how it clusters by cohort. That’s why teams get stuck in debates about root cause instead of converging on fixes.
If you’ve worked with frameworks like CRISP-DM, the parallel is obvious: raw text has to become structured fields before it drives decisions. Same thing with support. Turn conversations into metrics you can pivot, sentiment, churn risk, effort, canonical tags, and drivers, so a question like “what’s breaking for new customers?” returns a ranked list with examples.
Why Traceability Changes The Room
Traceability converts skepticism into momentum. When someone asks “show me,” you shouldn’t scramble for a dig. You should click the number and open the transcript. That evidence chain, metric to quote, shrinks meetings, reduces rework, and makes prioritization defensible in front of product and finance.
Truth is, traceability also aligns culture. Dashboards and anecdotes stop fighting because they become the same thread: numbers with proof. The outcome is a shorter path from signal to scope. You spend less time defending the “why” and more time agreeing on “what ships, in what order.” Ready to skip the theory and see it working end to end? See How Revelir AI Works.
The Real Bottleneck Is Converting Evidence Into Work
The bottleneck isn’t hearing customers; it’s converting unstructured conversation evidence into backlog-ready work. You need a shared pipeline: full coverage, normalized tags and drivers, and a clean path back to quotes. When PMs can verify the “why” in minutes, decisions speed up without side quests.
What Traditional Intake Misses
Email forms and ad-hoc tags look organized but produce noise. Fields drift, labels multiply, and product inherits a stack of notes that require reinterpretation. By the time someone reconciles tag variants and builds a deck, the window for a fast fix has passed. You weren’t short on signal. You were short on structure.
The fix is a two-layer system with a governance rhythm. Use AI raw tags for discovery, then roll them into canonical tags and drivers so leadership sees “Billing, Onboarding, Performance,” not 200 micro-labels nobody agrees on. In other words, move from interesting text to operational data. A simple weekly cadence, CX curates taxonomy while product validates drivers against goals, keeps the language stable and the pipeline humming. If you think about this like a data workflow, it mirrors patterns from mature pipelines such as Dagster’s 6-step data engineering workflow: collect, structure, analyze, and verify.
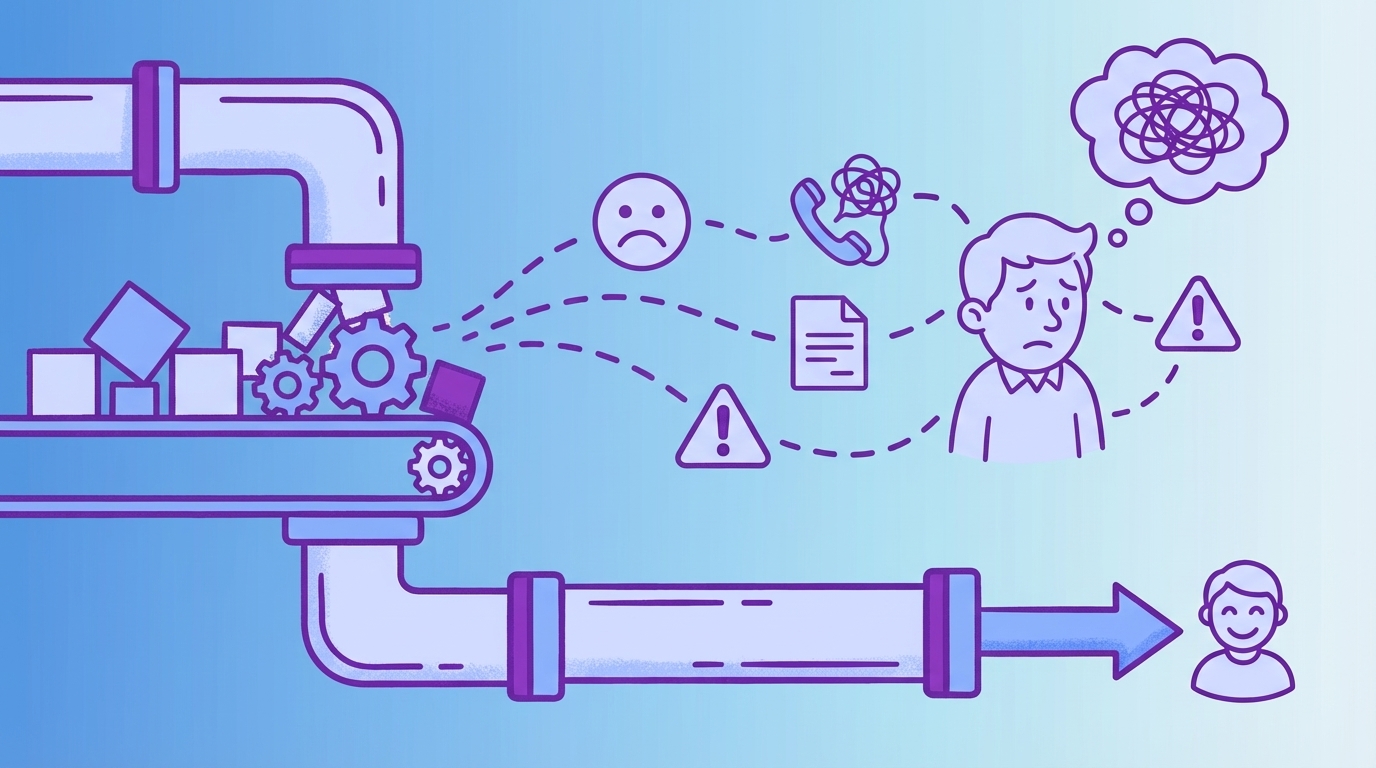
The Hidden Costs Of Slow, Manual Feedback Loops
Slow, manual loops cost more than time. They push teams into rework, fuel escalations, and sap trust in the room. Quantify those losses, and the status quo gets very expensive, very fast. Let’s put numbers on it so the trade-offs are obvious.
Engineering Hours Lost To Rework
Let’s pretend you ship a change on thin evidence. Two weeks later, the same pain pops up under different tags. Now you’re triaging again, refactoring code, and writing yet another “what happened” brief. If a team handles 1,000 tickets a month and samples 10% at three minutes each, that’s five hours for a partial view. To check 100% manually would be 50 hours, time you don’t have.
Rework compounds quietly. A misprioritized sprint isn’t just a couple of tickets. It’s context switching for engineers, backlog reshuffling, another week lost to alignment. Evidence-backed drivers reduce misfires: fewer hot patches, fewer reversals in planning, and a tighter link between “what broke” and “what we fix next.” That’s real capacity you get back.
Escalations And Churn Risk Compound Fast
Miss frustration cues and churn mentions, and escalations rise. Escalations inflate backlog and burnout, which reduces quality and worsens sentiment. It’s a loop, and a costly one. Spotting high-risk cohorts early lets CSMs intervene before renewals wobble and PR teams field Twitter threads none of us want to read.
A traceable layer across all conversations changes the math. You can filter for churn-risk tickets, group by driver, and open representative transcripts to confirm the pattern in minutes, not days. The shift is practical: fewer executive pings, fewer fire drills, and clearer outreach that resolves issues before they become churn. Still stitching this together by hand? There’s a faster way to move from signal to scope. Learn More.
When Decisions Drag, Customers Feel It
Slow decisions show up as customer pain. You see it in repeat contacts, stalled onboarding, and renewal risk. A traceable pipeline shortens time-to-understanding, which shortens time-to-fix. That’s the difference between “we’ll look into it” and “we’re shipping a change Friday.”
When Your Biggest Customer Hits The Wall
A top account hits onboarding friction. They open three tickets. Each agent tags it differently. Product sees a scatter of notes and shrugs. Meanwhile, the sponsor is worried about rollout risk. With drivers and canonical tags, you show the cluster in minutes, “Onboarding > account linking”, and attach quotes that make the issue unmistakable.
That meeting goes differently. Instead of “we’re hearing complaints,” you can say, “34% of negative sentiment among new customers ties to account linking.” Then you propose acceptance criteria and a measurement date. The sponsor breathes. The PM nods. Work moves.
The 3 AM Incident No One Saw Coming
Night shift handles an outage. Tags are inconsistent. The morning review devolves into anecdotes. With full coverage, you filter by time window, driver, and sentiment, then open the five most representative tickets. The team reconstructs what mattered in an hour and scopes the fix the same day.
Ask for “another sampling pass,” and momentum breaks. Everyone waits for a new export and a reading session. Confidence drops. The better conversation is “which driver, which cohort, and which acceptance test will prove it’s fixed.” That’s what a single system of record with traceability makes possible.
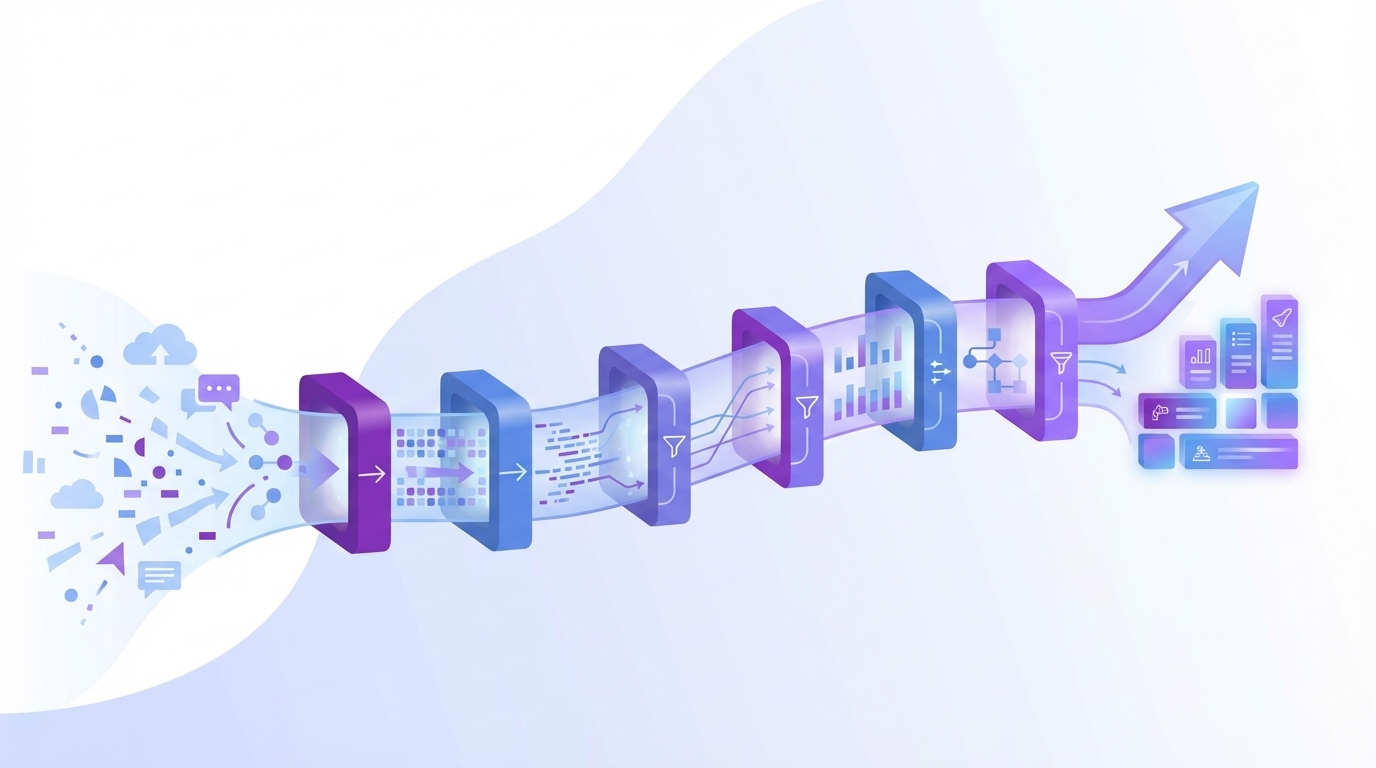
A Working 6-Step Pipeline From Conversation To Roadmap
A 6-step pipeline turns raw conversations into backlog-ready, measurable work. It’s coverage first, then normalization, triage, evidence, prioritization, and measurement. Do this weekly, and your roadmap alignment compounding curve bends in your favor.
Step 1: Ingest And Ensure Coverage
Coverage is non-negotiable. Connect your helpdesk or upload a recent CSV so every conversation is included, not just a sliver. Do a quick sanity check on counts and dates to ensure freshness. Avoid sampling. The quiet, compounding issues live in the other ninety percent you don’t read by hand.
Run a seven- or thirty-day window first so leaders see “current reality” without rehashing ancient history. If you’ve built data products before, this feels familiar: get the data in, validate shape and freshness, then analyze. You can layer sophisticated grouping later. The first win is complete, trustworthy input.
Step 2: Normalize Signals Into Canonical Tags And Drivers
Raw tags are your discovery engine. Keep them. But decision-making needs rollups people recognize. Map raw tags into canonical tags, then group those under drivers like Billing, Onboarding, and Performance. That’s how your analysis becomes leadership-ready without losing nuance.
Document a light mapping checklist so CX and product use the same language every week. The consistency pays off fast: stable reports, cleaner prioritization, and fewer circular debates about what a label “really means.” Treat this as your semantic schema, alive, but governed.
Step 3: Quick Triage To Isolate High-Risk Segments
Triage is about speed. Apply filters to separate signal from noise: last 30 days, sentiment = negative, churn risk = yes, effort = high. Add cohorts like plan tier or region if you have them. Then run a grouped analysis by driver or canonical tag to spot volume spikes and severity clusters.
Open the suspect clusters and read a few transcripts. You’re confirming that the pattern in the table matches the words customers used. This is where you catch misclassifications early and avoid taking a detour. The pass should take minutes, not hours.
Step 4: Evidence Validation With Quotes And Acceptance Criteria
Write short problem statements and attach 2–3 representative quotes per driver. Keep it tight: state the failure, why it matters, and where it shows up. Then propose acceptance criteria tied to the same metrics you’ll re-measure. For example, “reduce negative sentiment under Onboarding by 40% and high effort by 30% in 30 days.”
This is the bridge between analytics and product scope. Quotes make the pain visceral; acceptance criteria make the fix testable. Nobody has to trust a vibe. They can read the evidence and agree on the target outcome.
Step 5: Prioritization Using Volume × Severity × Strategic Weight
Score candidates with a simple sheet: volume share × severity index × strategic weight. Severity blends percent negative sentiment, percent high effort, and churn risk density. Strategic weight reflects company goals, what you’re optimizing for right now. Sort, discuss for five minutes, lock.
This avoids endless horse-trading. You’ve made the trade-offs explicit and connected them to measurable signals. Rinse weekly. As signals shift, so does your stack rank. It’s a practical loop that mirrors mature pipelines in other domains, like the staged measurement seen in Neptune’s guide to end-to-end ML pipelines.
Step 6: Handoff And Measurement With Closed-Loop Monitoring
Create a ticket or PRD snippet that pairs the problem statement, driver, quotes, and scoring. Include a measurement date and the exact grouped view you’ll rerun. Example: “Expect a 30% reduction in negative sentiment for Onboarding within 30 days; validate with ‘Sentiment by Driver’ and attach three fresh tickets that no longer reproduce.”
After release, rerun the same views. Paste before-and-after charts and link the new tickets. Close the loop in the same artifact where you opened it. The habit is simple: same evidence, same lens, same cadence. That’s what builds trust.
How Revelir AI Operationalizes The Pipeline In Days
Revelir AI turns your conversations into evidence-backed metrics with full coverage and traceability. It ingests data in minutes, structures it into tags, drivers, and metrics, and lets you pivot like a spreadsheet while jumping straight to the quotes that matter. It’s the pipeline, prebuilt.
Full Coverage Ingestion With Zendesk Or CSV
Revelir AI connects to Zendesk or ingests CSV exports. Historical tickets load, ongoing updates sync, and every transcript is processed, no classifier building, no manual QA pass to get value. That gives you immediate coverage across your backlog so your first review uses complete data, not a thin slice.

From there, you work in Data Explorer: filter by sentiment, churn risk, effort, canonical tags, drivers, or custom AI metrics. It’s built for speed and clarity. And because coverage is 100%, you avoid the sampling trap that leads to missed signals and late detection of churn risk.
Analyze Data And Conversation Insights For Fast Validation
Revelir AI computes sentiment, churn risk, and customer effort, applies raw tags, canonical tags, and drivers, and keeps everything traceable. Any aggregate you see, “19 churn-risk tickets under Billing”, is one click away from Conversation Insights with the full transcript, summary, and metrics. That’s how you move from ranked lists to verified quotes without friction.
Need grouped views? Analyze Data summarizes “Sentiment by Driver” or “Churn Risk by Category” with interactive cells you can click to validate. Prefer to bring metrics into your BI? Export via API and keep your reporting in sync. This mirrors robust unstructured-data pipelines, capture, structure, verify, like you’d see in a well-designed RAG flow, minus the plumbing, as discussed in this overview of RAG pipeline stages. Let Revelir AI handle the heavy lifting while your team focuses on scope and sequencing. Ready to operationalize this pipeline on your own data? Get Started With Revelir AI.
Conclusion
You don’t win by reading more tickets. You win by turning every conversation into structured, traceable evidence and using a steady pipeline to prioritize, ship, and measure. Full coverage replaces guesswork. Drivers and quotes replace debates. And the loop closes every week so your roadmap reflects what customers actually said, proof included.
Frequently Asked Questions
How do I connect Revelir AI to my helpdesk?
To connect Revelir AI to your helpdesk, start by logging into your Revelir account. From there, navigate to the integration settings and select your helpdesk platform, like Zendesk. Follow the prompts to authorize the connection. Once connected, Revelir will automatically ingest your support tickets, including all relevant metadata and conversation text. This setup allows you to begin analyzing your data quickly, turning raw conversations into actionable insights without manual exports.
What if I want to analyze historical tickets?
If you want to analyze historical tickets, you can easily upload them using a CSV file. First, export your past tickets from your helpdesk as a CSV. Then, log into Revelir and go to the Data Management section. Select 'File Import' and upload your CSV. Revelir will parse the conversations and apply its AI metrics and tagging system, allowing you to explore insights from your historical data in just minutes.
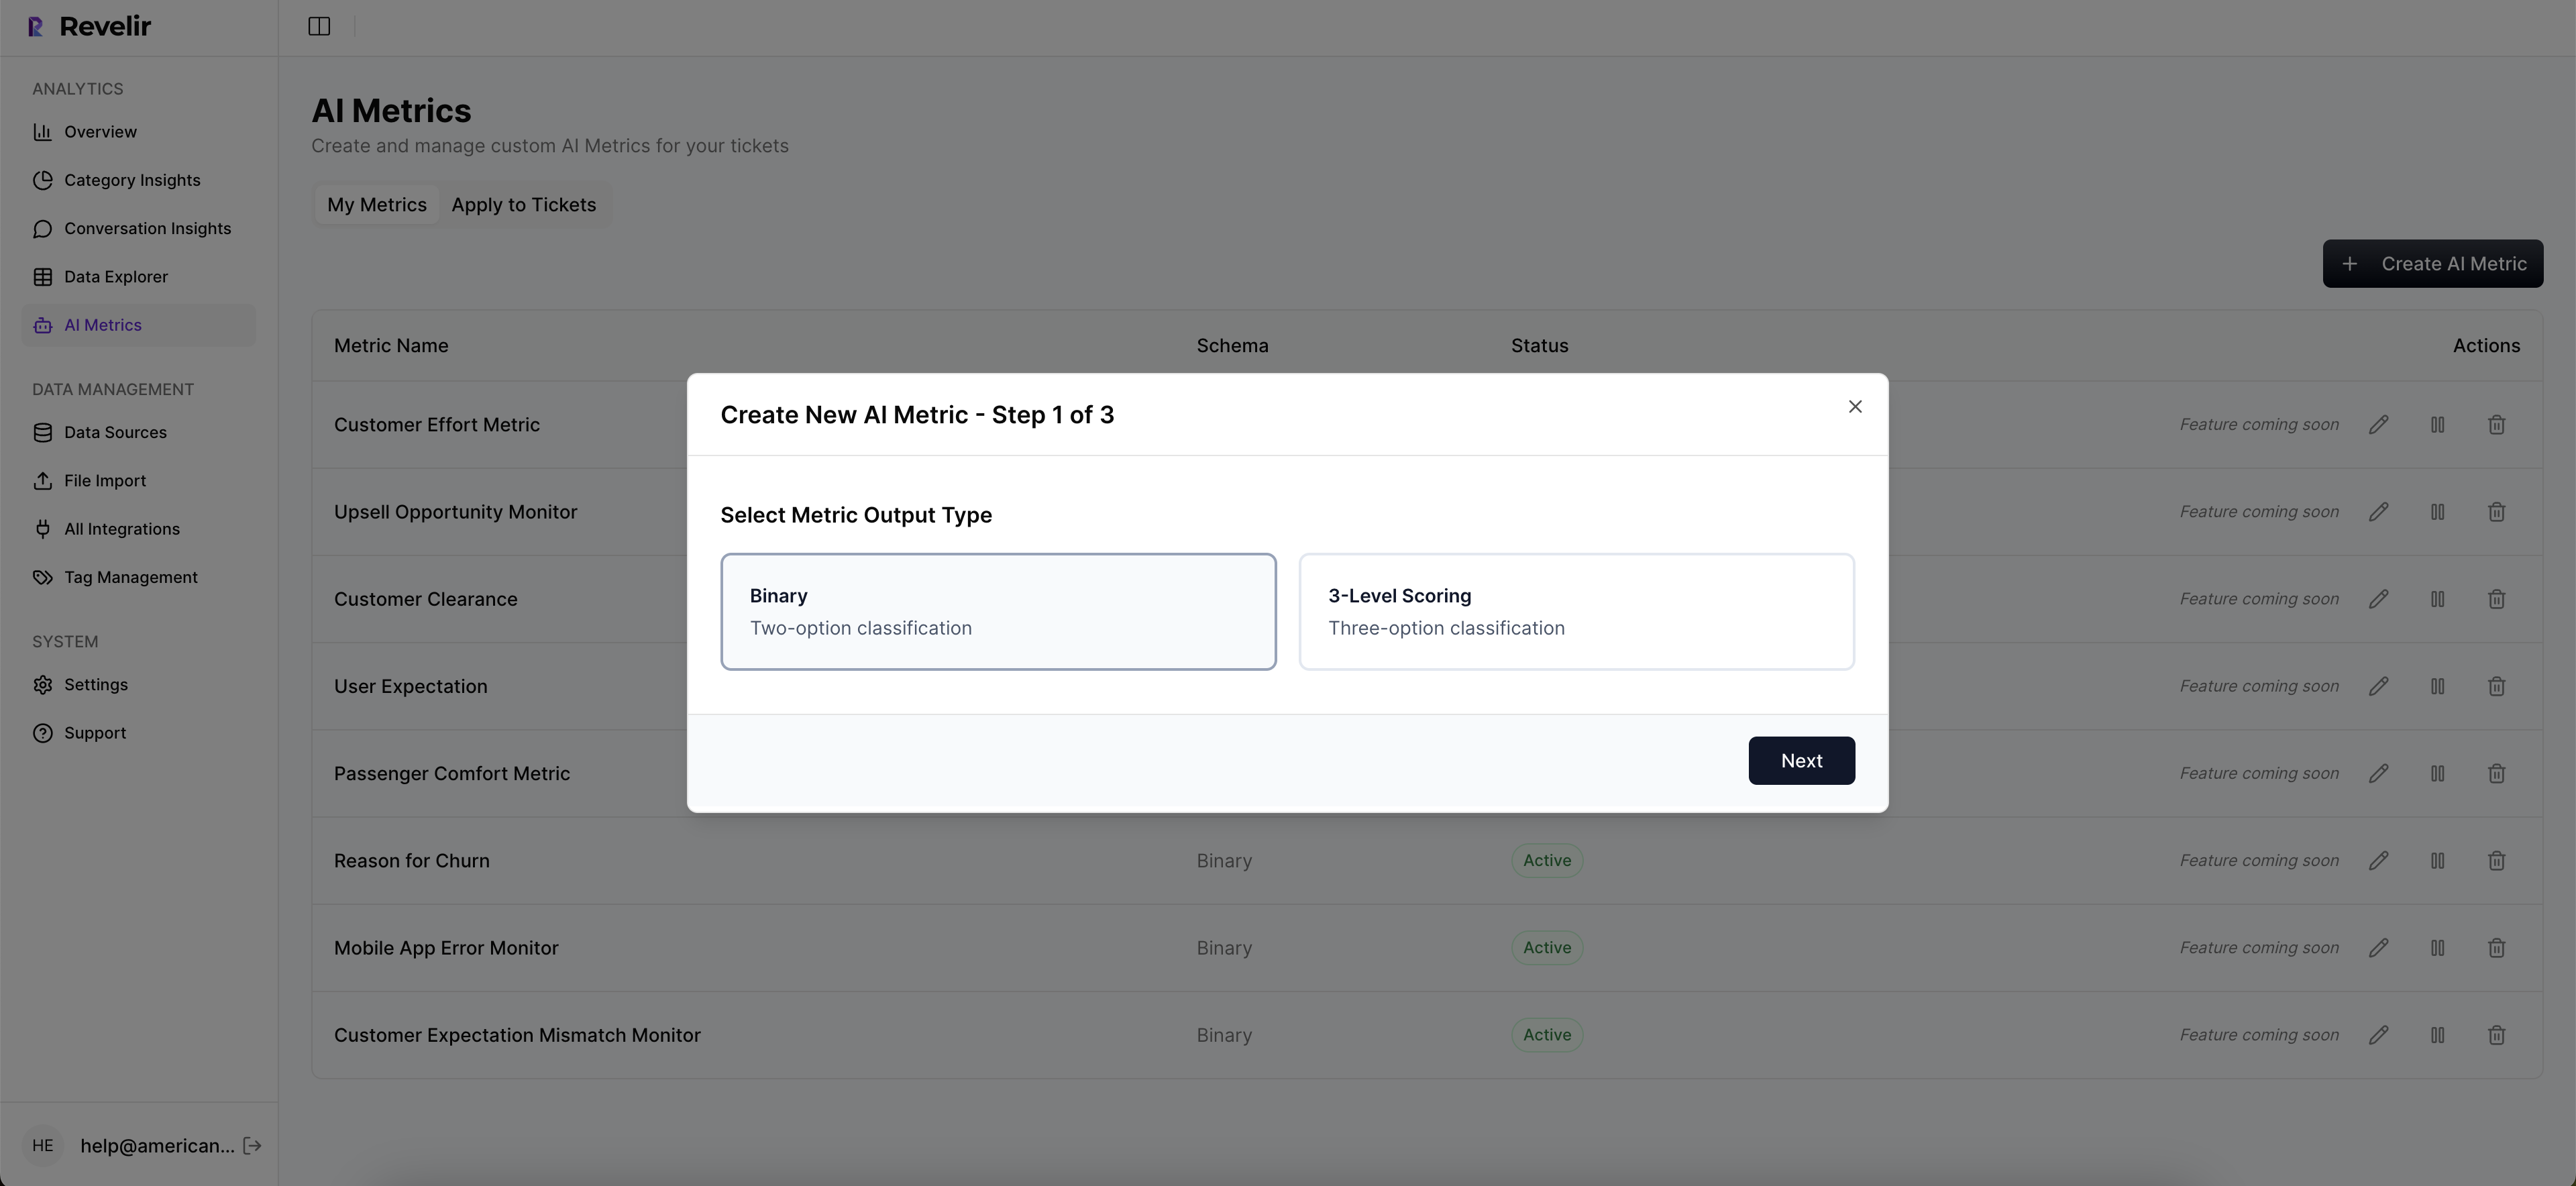
Can I customize the metrics in Revelir AI?
Yes, you can customize metrics in Revelir AI. Once your tickets are ingested, navigate to the settings where you can define custom AI metrics that reflect your business language. For example, you might want to track metrics like 'Upsell Opportunity' or 'Reason for Churn.' This customization allows you to tailor the insights to better fit your specific needs and priorities, ensuring that the data you analyze is relevant and actionable.
When should I use the Analyze Data feature?
You should use the Analyze Data feature whenever you need to understand patterns in your support tickets. This tool is particularly useful for answering questions like 'What’s driving negative sentiment?' or 'Which issues are most associated with high churn risk?' By selecting a metric to analyze and grouping it by dimensions like canonical tags or drivers, you can quickly surface insights that inform your product and customer experience decisions.
Why does Revelir AI focus on full-coverage processing?
Revelir AI focuses on full-coverage processing to ensure that every support conversation is analyzed, eliminating the biases that come with sampling. This approach allows you to catch early signals of churn risk and understand the full context of customer feedback. By processing 100% of your tickets, Revelir provides a comprehensive view of sentiment, frustration signals, and product feedback, enabling you to make data-driven decisions with confidence.