

You don’t detect churn risk by staring at a dashboard. You find it inside the words customers use when they’re frustrated, worried about renewal, or confused about pricing. That signal isn’t loud at first. It’s scattered across dozens of tickets. If you don’t structure it, you’ll miss it.
Here’s the uncomfortable truth. Most teams still sample tickets and watch CSAT curves. It feels responsible. It isn’t. You need 100% conversation coverage, metrics you can trust, and a direct path back to the exact quotes that justify action. That’s your playbook.
Key Takeaways:
- Stop sampling; analyze 100% of conversations and link every metric to quotes
- Build a baseline: transcripts, tags (raw + canonical), drivers, and AI metrics
- Create a reusable churn detection view by tier and renewal window
- Validate patterns with fast ticket reads and representative quotes
- Prioritize with a simple volume × severity score to build a triage queue
- Trigger proactive outreach tied to evidence, then measure 30/60/90 outcomes
Why Score-Only Dashboards Miss Churn Signals
Score-only dashboards miss churn signals because the signal starts as language, not numbers. Frustration cues, renewal anxiety, and direct churn mentions appear in tickets long before a health score moves. Scores hint. Conversations explain. When you turn those conversations into drivers plus evidence, you catch risk early and align the room faster.

The Metrics That Matter Are Buried In Conversations
Most churn precursors hide in plain sight: “not worth the price,” “switching after renewal,” “couldn’t get access for two weeks.” They’re early but they’re there. The problem isn’t the absence of data; it’s the absence of structure. You need drivers that leadership understands and AI metrics that identify churn risk and effort so you can act with confidence.
If you leave the words unstructured, people default to anecdotes. One bad thread becomes “the narrative.” That’s fragile. Instead, treat conversations as measurable fields. When churn risk equals yes and the driver equals billing, you don’t argue about whether it’s “real.” You click into five tickets, read the quotes, and move. That shift—from vibes to verifiable—changes the conversation.
Why Conventional Sampling Fails
Sampling seems efficient. It isn’t. It trades speed for blind spots exactly where you can’t afford them. The quiet pattern—account access issues for new enterprise users, pricing confusion among year-one customers—tends to get excluded. Same thing with subtle friction that compounds over time. You won’t see it in a 10% pull.
The fix is simple, not easy: complete coverage for detection, human reads for validation only. That sequence gives you confidence without bias and speed without rework. Once every conversation is scored and grouped, you can pivot by cohort and driver in seconds. Then sanity-check a handful of transcripts. You’ll save hours and recover signal you didn’t know you were missing.
What Is A Defensible Churn Alert?
A defensible alert pairs a metric with evidence. It’s “Churn Risk = Yes, Driver = Billing, Tier = Enterprise,” plus three quotes that show pricing confusion tied to a renewal. Executives don’t need a lecture; they need a link. They click from the dashboard to the exact conversations and decide.
This is the minimum bar. If an alert can’t be traced to examples, it won’t survive the first “show me.” Teams that adopt this standard move faster and argue less. If you want a quick primer on downstream tactics teams use to reduce risk, skim this overview of reduce customer churn approaches. Notice how the strongest plays start with clear reasons, not vague scores.
The Real Root Cause Of Missed Churn Alerts
Missed churn alerts happen when your support data isn’t structured into drivers and AI metrics you can pivot. You don’t need twenty tools; you need transcripts, a clean tagging layer, and trustworthy metrics. With those, you can isolate cohorts, validate with examples, and turn risk into a queue you triage weekly.

What Data Do You Actually Need?
You need three ingredients. First, full transcripts for every ticket. Second, a hybrid tagging layer: raw tags for discovery, canonical tags for clarity, and drivers for leadership-ready summaries. Third, AI metrics—sentiment, churn risk, and customer effort—applied across 100% of tickets. That’s it. With that baseline, the rest gets easier.
From there, we can slice by plan tier, renewal window, or product area. We can group by driver to see where risk concentrates. We can click into tickets and pull representative quotes to anchor decisions. Everything else—integrations, exports, BI—is optional until this foundation holds. You’ll get more leverage from clarity than tooling.
How Tags, Drivers, And Metrics Work Together
Raw tags discover emerging themes. They’re messy by design and useful for spotting new issues. Canonical tags normalize language so reporting stays clean. Drivers roll themes into leadership-ready buckets—Billing, Onboarding, Account Access—so people understand the “why” at a glance.
On top of that, AI metrics score each conversation: sentiment (positive/neutral/negative), churn risk (yes/no), and effort (high/low when detectable). Combine them in one view, filter by cohort, then group by driver. You’ll know what’s happening, why it’s happening, who it affects, and how severe it is. That’s how you move from anecdotes to action.
The Minimum Data And Tagging Checklist
Start simple. Confirm transcripts, timestamps, requester and account fields, plan tier or ARR band, and renewal date. Ensure churn risk, sentiment, and effort are enabled and visible as columns. Stabilize a small set of canonical tags and drivers—billing, onboarding, account access, technical issues. Create and save views per segment like “Enterprise, Next 90 Days.”
You can refine later. If you’re new to formal churn analysis, it’s helpful to align on common drivers and definitions. Guides like this perspective on churn risk in go-to-market models can help frame the discussion. But don’t overcomplicate it. A consistent baseline beats a perfect taxonomy that never ships.
The Hidden Costs Of Reactive Churn Management
Reactive churn management is expensive because it delays detection and invites debate. Each delay compounds—escalations, bigger backlogs, and rushed discounts at renewal. The cure is automation with traceability: analyze every conversation once, then click to proofs when challenged. You’ll save time, protect margin, and reduce firefighting.
The Time Tax You Pay Every Month
Let’s pretend your team handles 1,000 tickets a month. A 10% sample at three minutes each sounds small—until you realize it’s five hours for a partial view. Then add exports, spreadsheets, and meetings to interpret the slice. That’s more hours, more debate, and less conviction.
Meanwhile, risk grows quietly. Tickets stack up around one driver, but it’s not “obvious” yet, so no one moves. A consistent, automated analysis removes the monthly tax. Process 100% of tickets, score them once, and group by drivers. Human time shifts from digging to deciding. It’s not perfect, but it’s reliably better than handcrafted sampling.
When Trust Breaks In The Room
We’ve all been there. You present a chart; someone says “show me an example.” If you can’t click into the conversations behind the metric, the meeting stalls. Momentum dies. Now you’re scheduling a follow-up to pull quotes. That’s a week lost.
Evidence-backed traceability fixes this. Present a driver-level chart, then open the underlying tickets and read two quotes. The room aligns. Product gets the why, CS gets the who, finance sees the impact. If you’re building playbooks to standardize these handoffs, this community post on developing churn prevention playbooks is a useful reference. Just remember: without traceability, playbooks won’t stick.
What Is The Opportunity Cost Of Late Detection?
Late detection changes the shape of the problem. A solvable friction point becomes a renewal negotiation. Discounts expand, and escalations drain attention. Product ships a broad fix because the “why” is unclear, adding rework later. Support morale dips because the same issues resurface.
There’s a better path. Detect risk in-line—by driver and segment—then triage outreach within days. Even small reductions in preventable churn often cover the effort many times over. You don’t need a complex model; you need a consistent way to surface risk, validate it, and act fast.
Still working through this manually? There’s a simpler path. Learn More about operationalizing traceable churn detection from your support data.
The Human Side Of Risk, And Why It Hurts
The human cost of missed churn signals is real. You feel it as 3am escalations, tense renewal calls, and internal second-guessing. The irony? Most of it was visible in tickets a week earlier. With repeatable detection and validation, those scenarios become daytime problems, not overnight emergencies.
The 3am Escalation No One Wanted
You’ve seen it. A thread goes sideways, an executive pings a Slack channel, and now everyone’s awake. The root cause—say, account access loops for enterprise sign-ins—was detectable a week earlier across tickets under a single driver. But without a repeatable workflow, those patterns stayed invisible.
This isn’t about blame; it’s about process. When you have the detection view saved and updated daily, you can spot the rise, validate quickly, and brief the right team before it blows up. You’re not praying problems go away. You’re managing them on your schedule.
What Happens When A Renewal Goes Quiet?
Silence near renewal is a signal. Pair it with recent tickets flagged for churn risk and high effort under billing, and you know who to call and what to discuss. This is how you avoid the last-minute discount dance that erodes margin and trust.
Outreach works better when it’s specific. Quote the issue, offer a relevant fix, and propose a short call. For broader context on preparing stakeholders inside your org, skim a quick customer champion playbook. Then bring it back to basics: real quotes, clear drivers, timely action.
A Practitioner Workflow That Turns Tickets Into Churn Alerts, 5 Steps
A five-step workflow turns unstructured tickets into defensible churn alerts. Build a detection view, validate quickly with quotes, score and prioritize into a queue, trigger targeted outreach, then measure outcomes at 30/60/90 days. Keep it simple and consistent so the team uses it weekly.
Step 1: Build The Detection View
In Data Explorer, filter Churn Risk = Yes, optionally add Sentiment = Negative. Add plan tier or ARR band, and an upcoming renewal window (e.g., next 90 days). Bring in columns for Drivers, Canonical Tags, Sentiment, and Effort so severity is visible at a glance.
Click Analyze Data. Choose Metric = Churn Risk, Group By = Driver or Canonical Tag. Save the slice as “Churn Risk by Driver, Enterprise.” Now you have a reusable view, refreshed automatically, that you can open every Monday. You’re not rebuilding logic; you’re reviewing risk.
Step 2: Validate Evidence With A Lightweight Protocol
Use 100% coverage for detection, then validate with quick reads. For each top driver and tier, open 5–10 tickets in Conversation Insights. Confirm the theme, capture 2–3 representative quotes, and note the exact phrasing customers use around renewal or pricing.
You’re not aiming for perfection; you’re testing whether the pattern “makes sense.” If it looks noisy, refine canonical mappings or drivers. Re-run the view. This validation step takes minutes and pays back in meeting credibility later.
Step 3: Score And Prioritize Into A Triage Queue
Build a simple severity score to sort the list. Start with a clear rule: Churn Risk = 1 point, High Effort = 1, Negative Sentiment = 1. Accounts with a 3 get top priority, then sort by volume within each driver. Don’t over-engineer it on day one.
Share the queue with CS, and provide driver context to Product so systemic fixes can start in parallel. If you want a quick framing for why prioritization beats volume chasing, this note on at-risk customer identification is a decent sanity check. Then return to your list and move.
Step 4: Trigger Proactive Outreach With Clear Templates
Turn signals into action. Outreach triggers might include: Churn Risk = Yes within 90 days to renewal, Driver in Billing or Onboarding, and two recent negative tickets. Use a short template. Acknowledge the issue with a quote, offer a relevant fix or walkthrough, and propose a call. Keep it personal, not scripted.
Define handoffs to avoid loose ends. Support closes the current ticket; the CSM owns follow-up; Product logs the driver for backlog review. Keep examples attached so everyone sees the same “why.” This is how action stays coordinated instead of performative.
Step 5: Measure Impact And Iterate On A 30, 60, 90 Day Plan
At 30 days, track outreach response rate and reduction in repeat tickets by driver. At 60, compare churn-risk density before and after for contacted accounts vs. a matched baseline. At 90, correlate renewals for contacted accounts and note discount variance.
Refresh saved views, refine canonical tags where noise persists, and consider a custom metric like Reason for Churn to sharpen analysis. If you want a broader survey of analytics methods, this primer on churn analysis for SaaS is useful background—just don’t let framework shopping delay the basics.
How Revelir AI Automates And De-Risks This Workflow
Revelir AI automates detection with 100% coverage, scores every conversation with AI metrics, and preserves traceability down to the exact quote. Data Explorer handles your saved views and filters. Analyze Data surfaces drivers by tier. Conversation Insights provides the proof. Custom metrics and canonical tags keep the language clean.
Data Explorer Saved Views And Filters For Churn Risk
Revelir AI processes every ticket—no sampling—and exposes churn risk, sentiment, effort, tags, and drivers as columns and filters. You can save standard views by tier and renewal window so the team runs the same analysis in minutes. It’s your weekly risk roll-up without exports or spreadsheet gymnastics.

Because filters stack, you can isolate “Enterprise + Renewal in 90 Days + Churn Risk = Yes” in one view. Add columns for Sentiment and Effort to see severity immediately. Then share that slice across CS and Product so everyone starts from the same list, with the same definitions.
Analyze Data To Surface Drivers By Tier
With one click, Revelir’s Analyze Data calculates churn risk by driver or canonical tag and presents interactive tables and charts. Click any number to jump into the underlying tickets. That link is the difference between “interesting” and “actionable.”
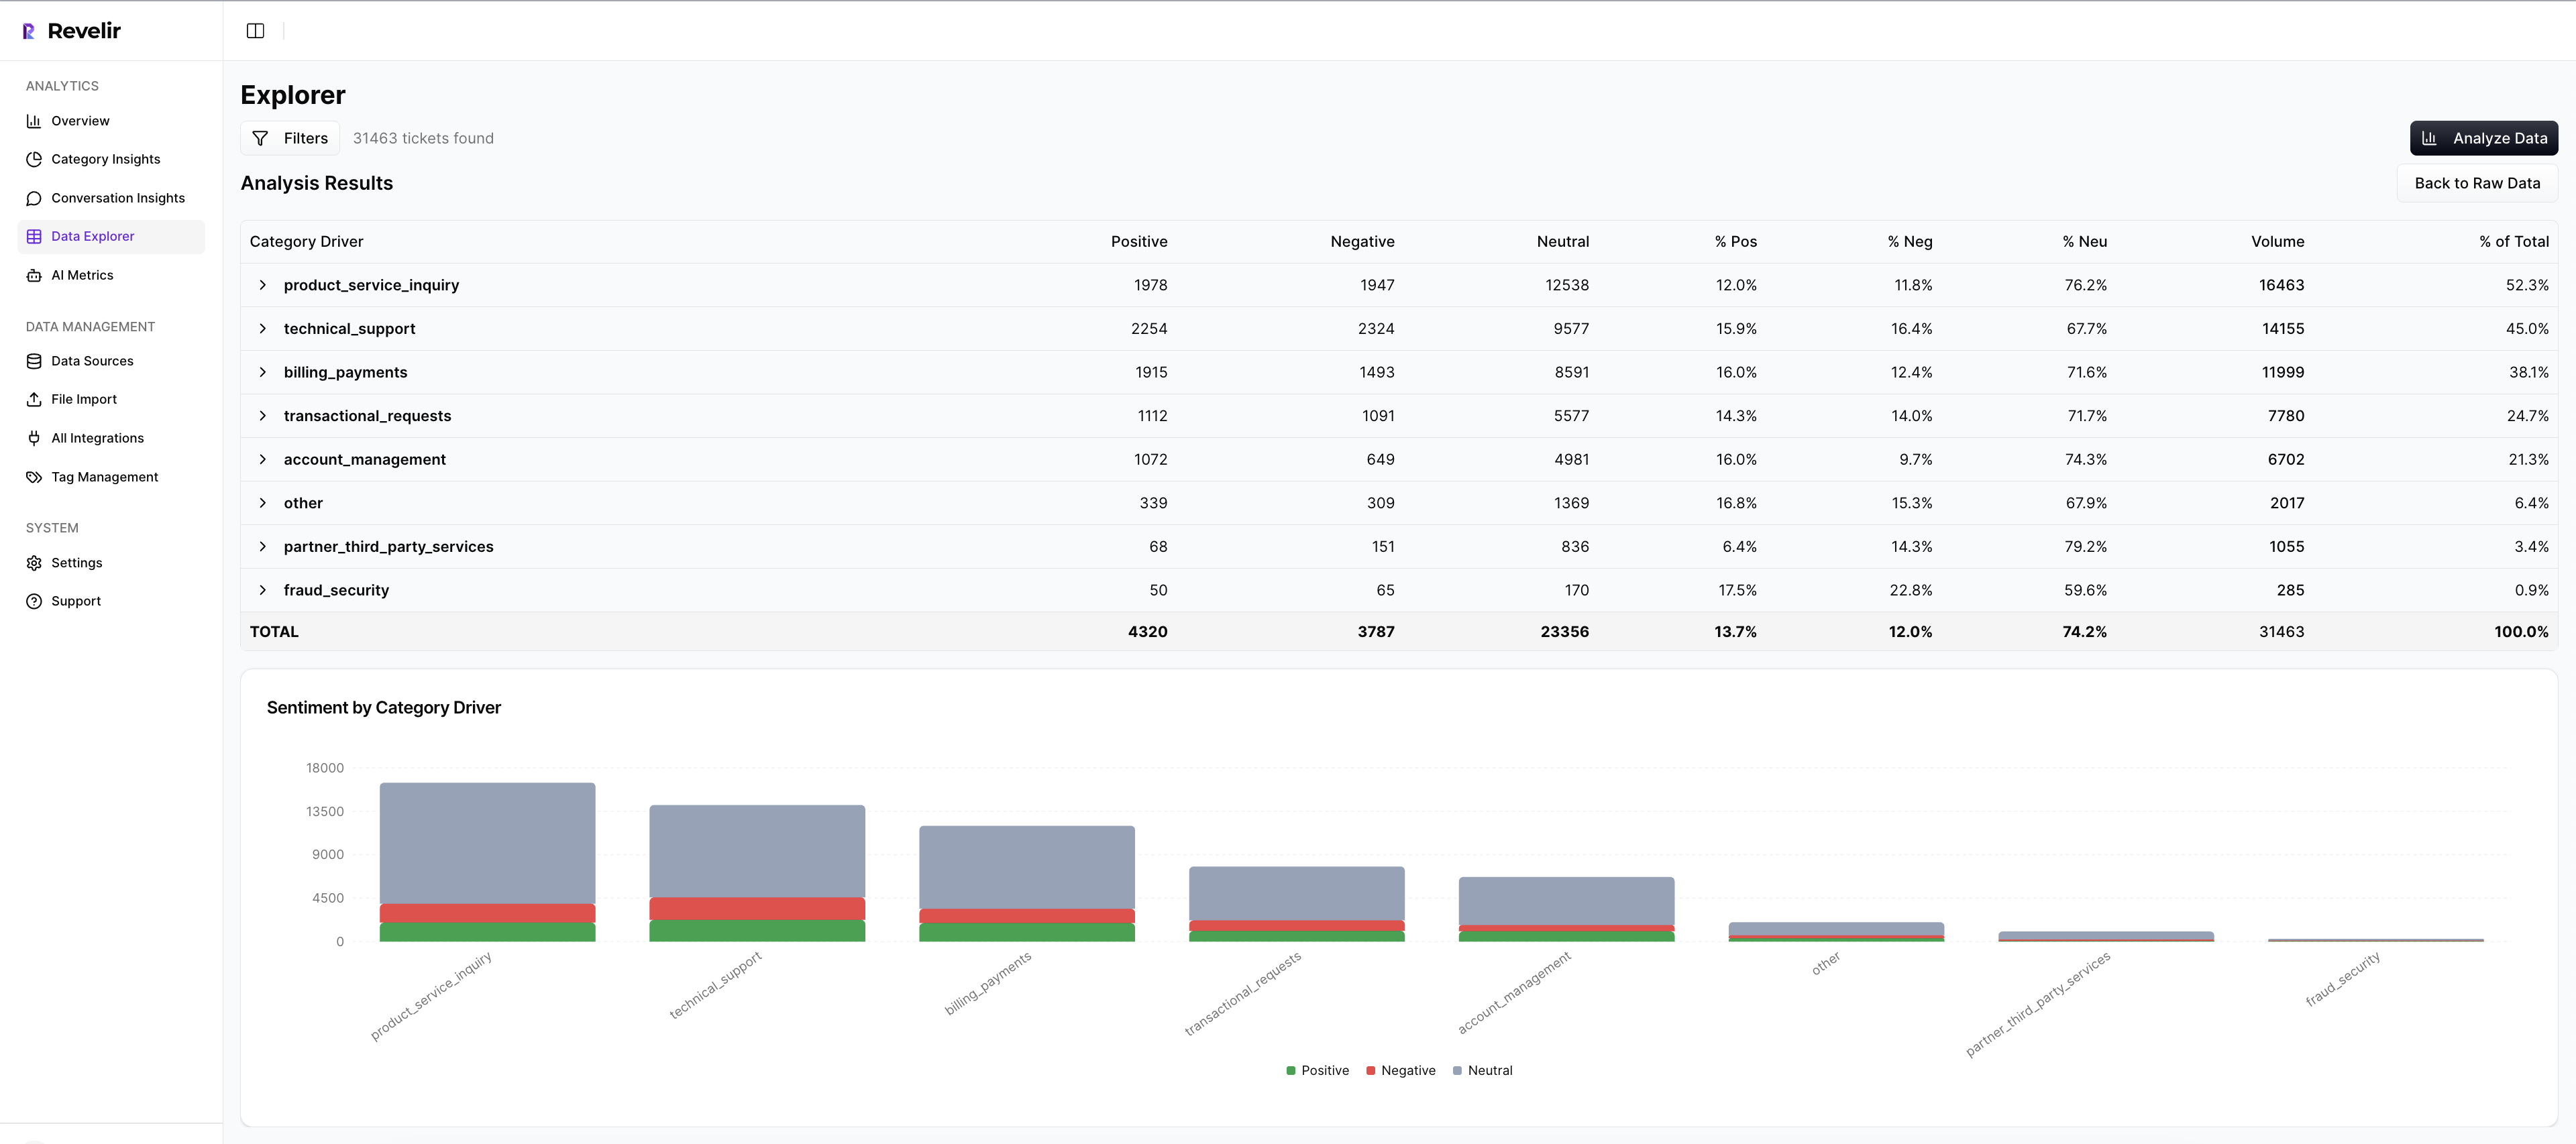
This is where volume meets severity. It makes your step one view repeatable and your step three scoring credible because the rollups and the tickets are always one click apart. No extra tooling. No manual consolidations.
Evidence-Backed Traceability In Conversation Insights
Every aggregate in Revelir AI links to its source conversations. In Conversation Insights, you see the full transcript, AI summary, assigned raw and canonical tags, drivers, and the metrics behind the alert. When someone asks for proof, you open two tickets and read two quotes. The room stays aligned.
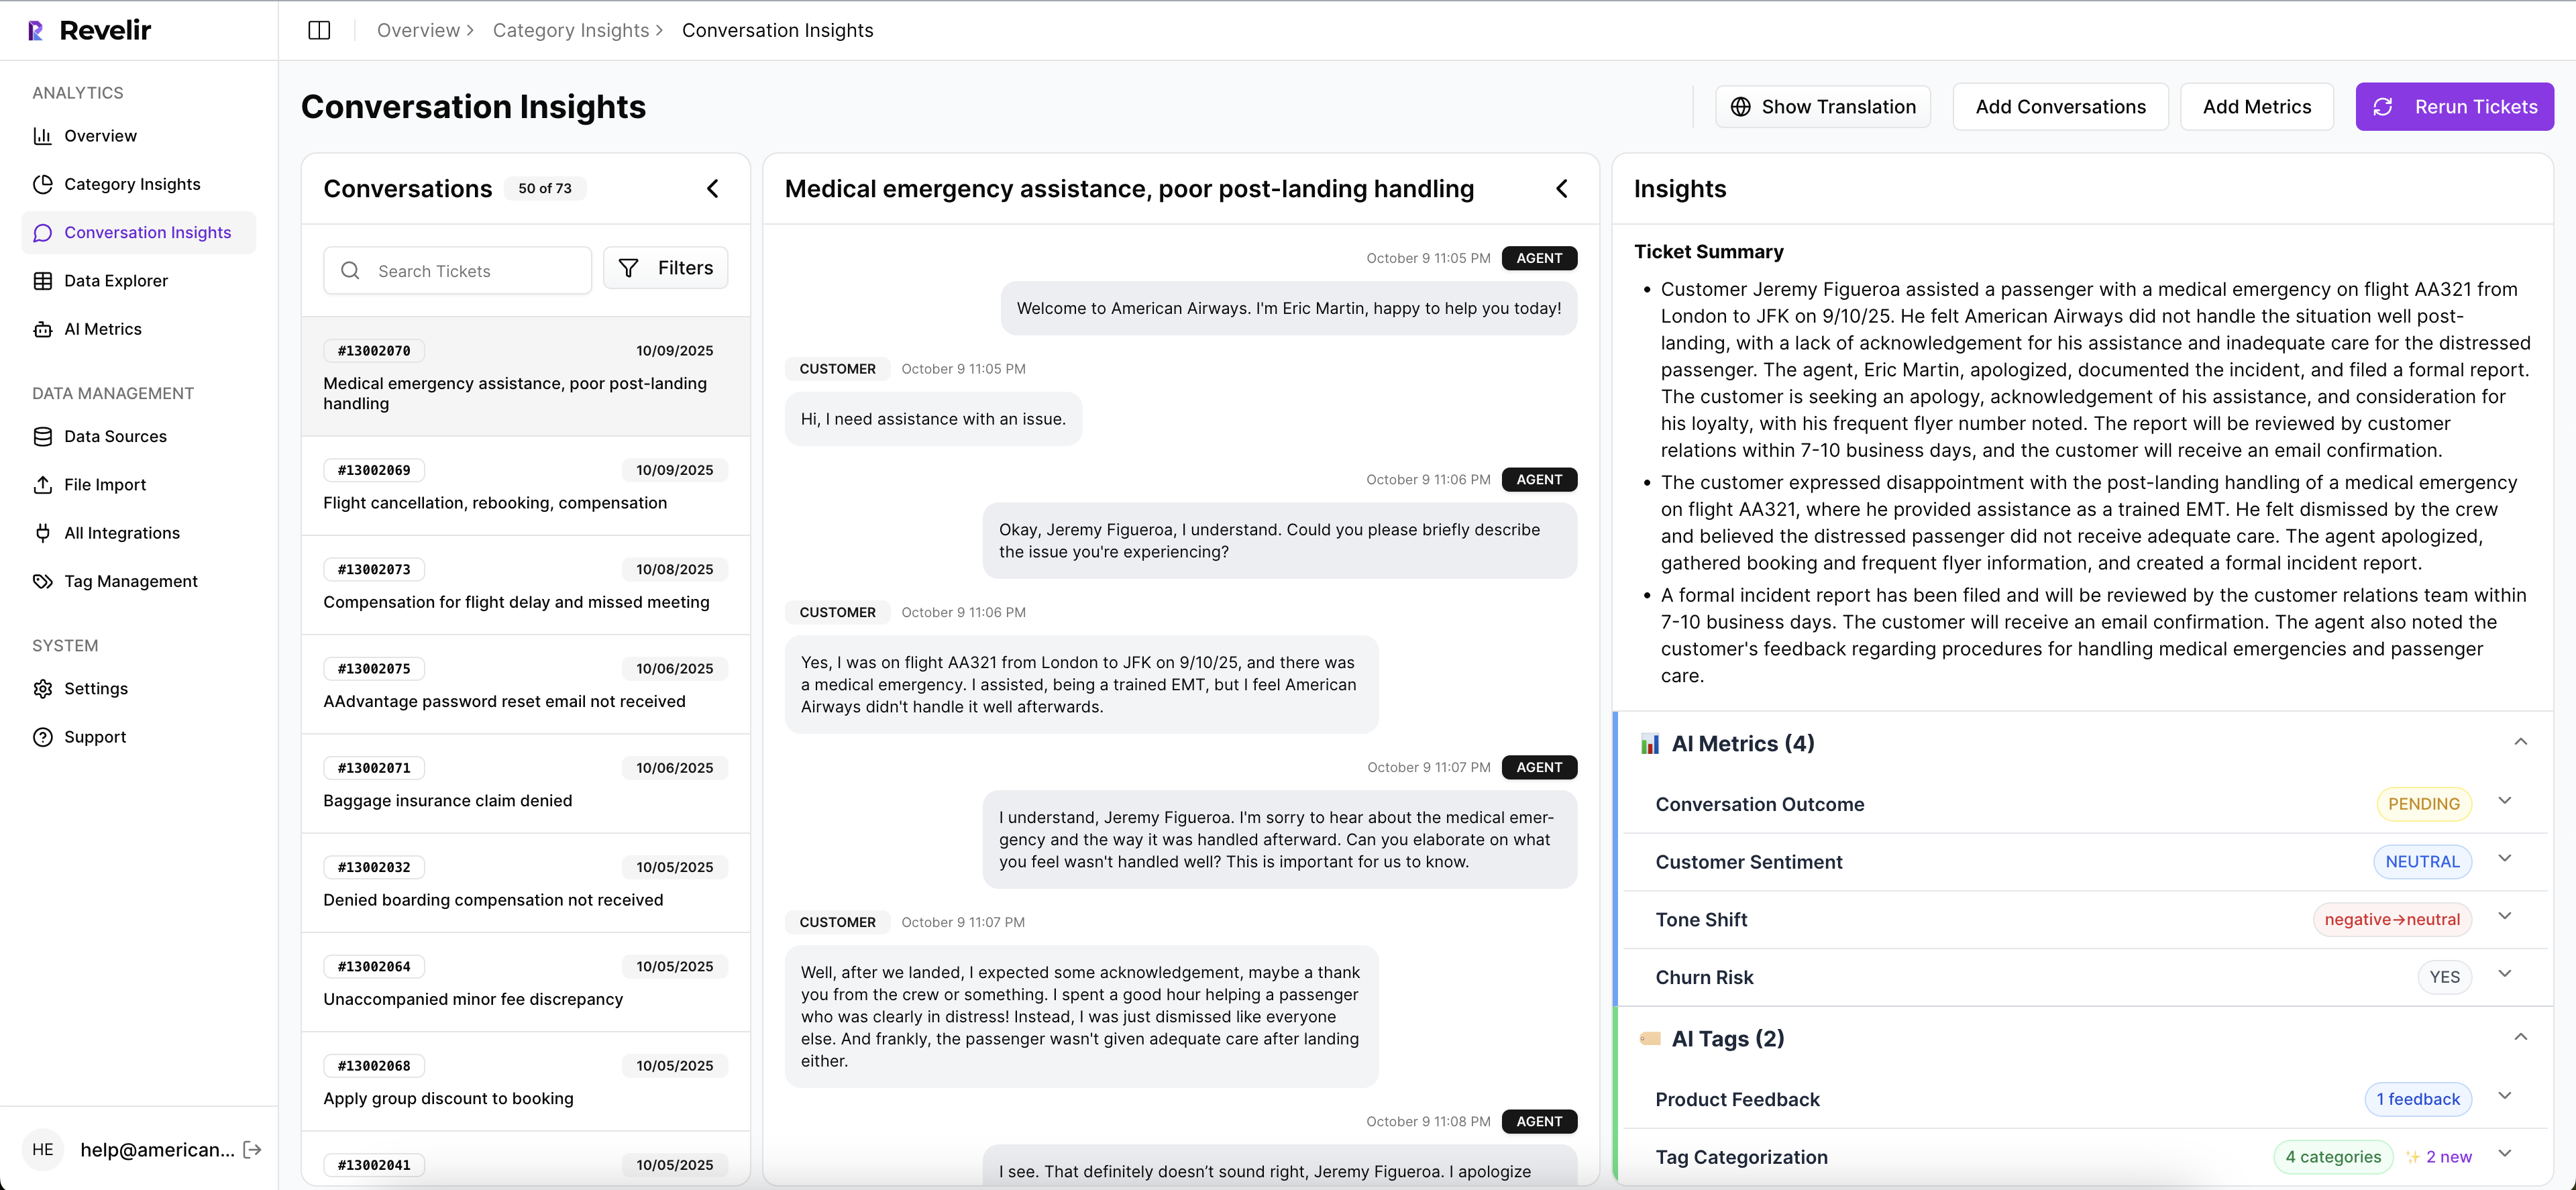
This traceability is not a nice-to-have; it’s what keeps decisions moving. It’s also how you train the organization to trust the data—by making the evidence visible by default, not by exception.
Custom AI Metrics And Canonical Tag Governance
When you need sharper signals, Revelir AI lets you define custom AI metrics, such as Reason for Churn, and apply them consistently across all conversations. Canonical tags and drivers keep language clean for leadership while raw tags continue to discover emerging issues under the surface.
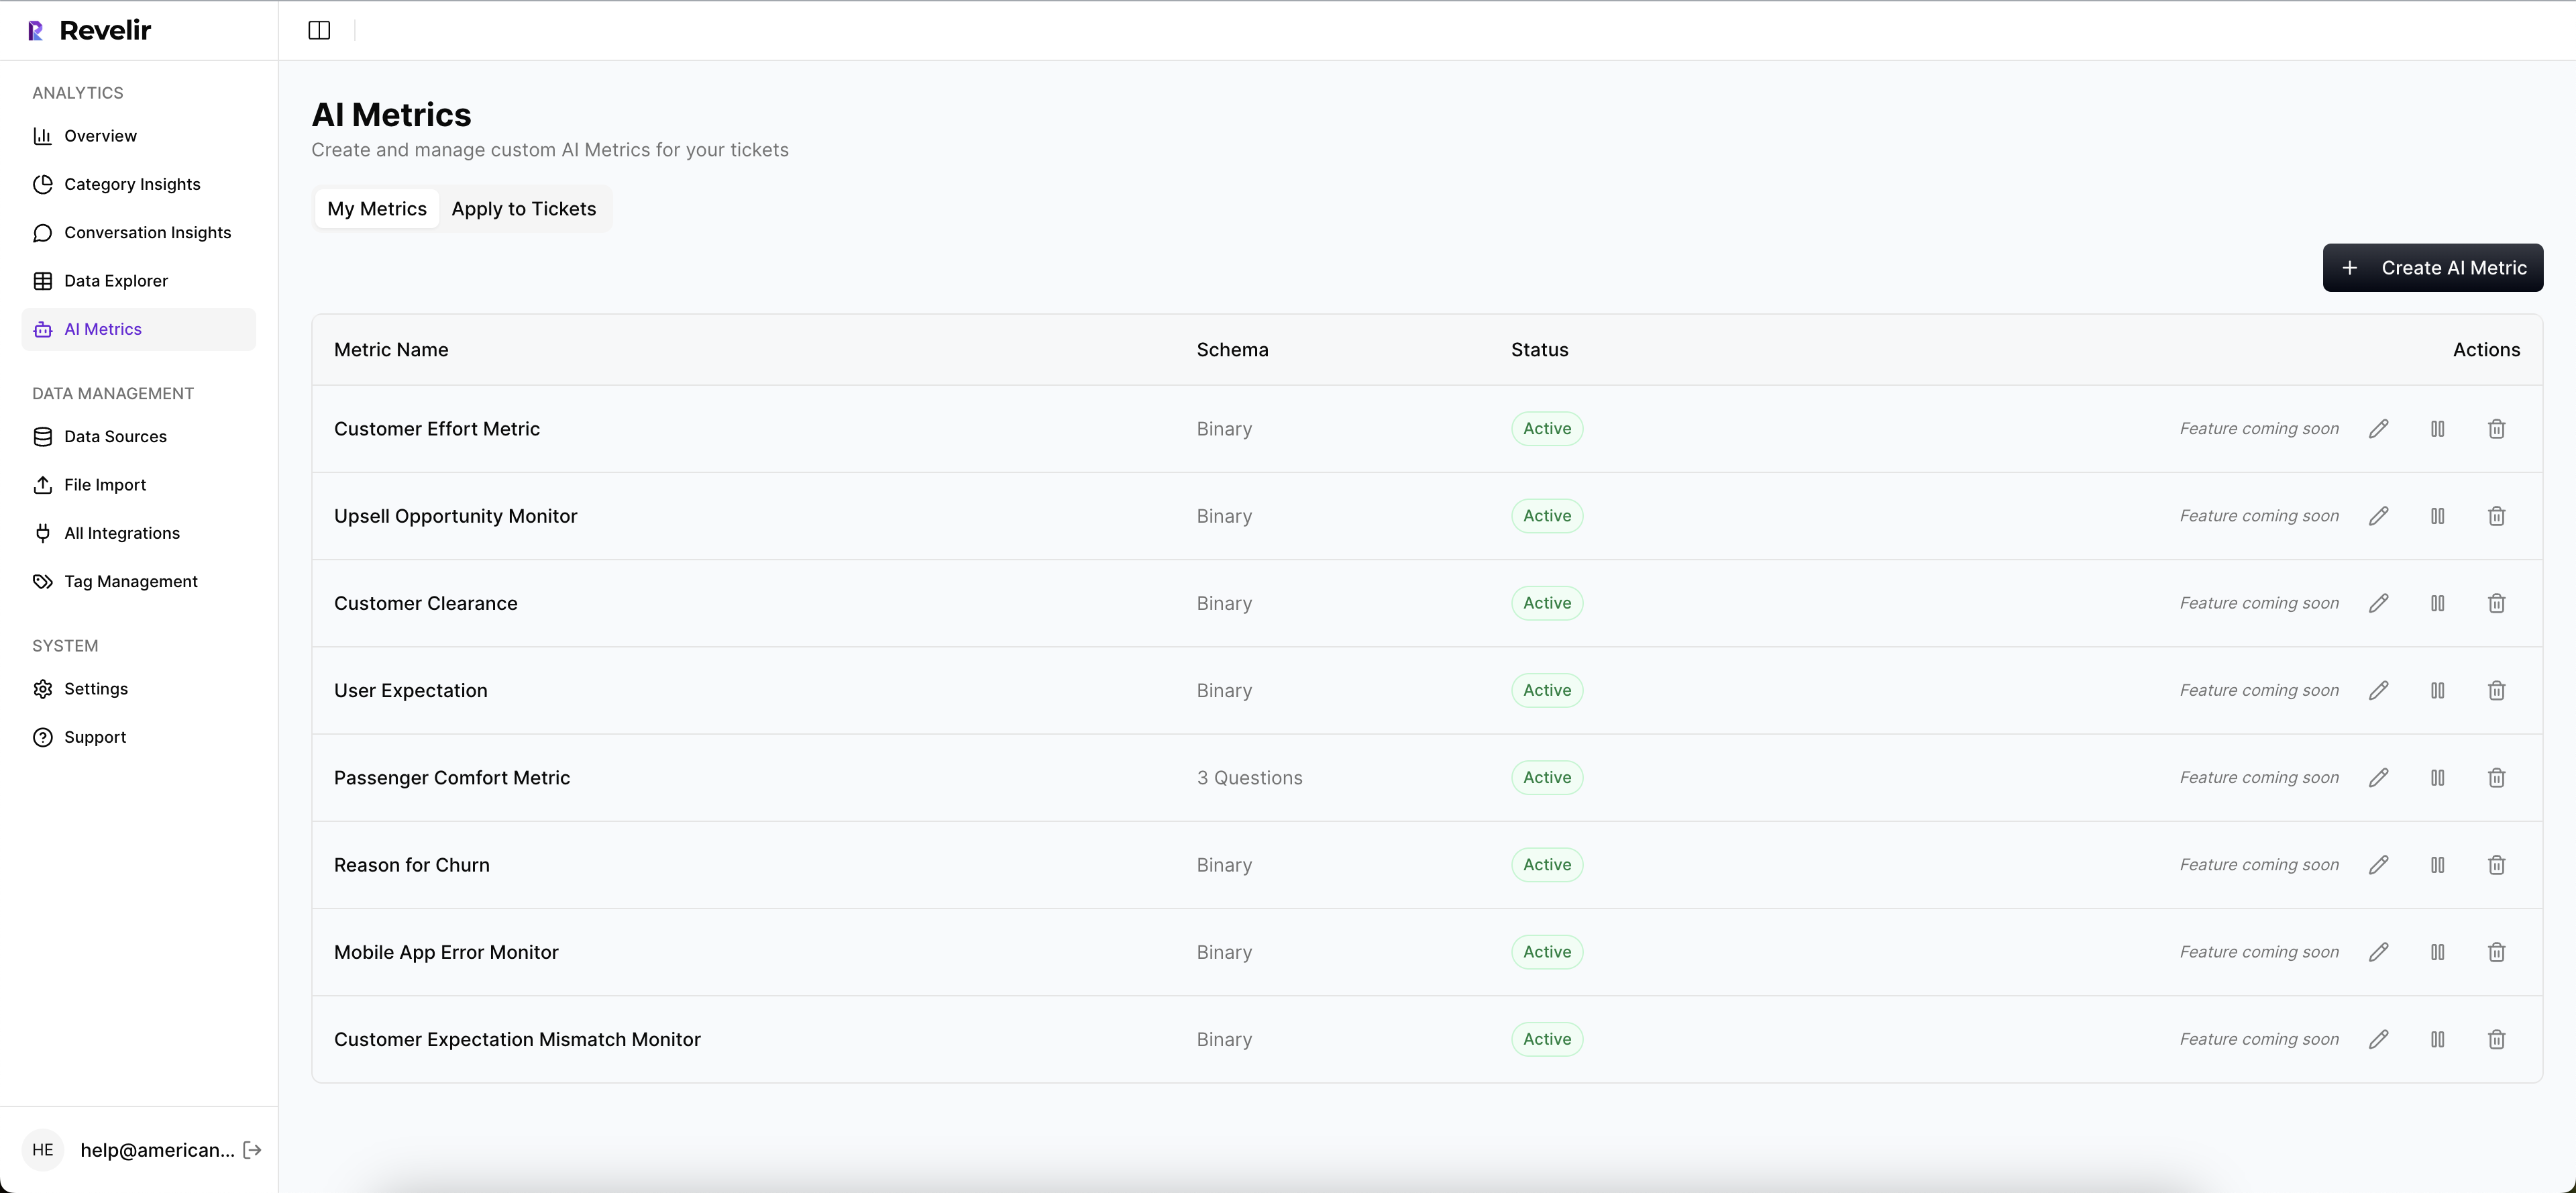
Over time, mappings improve, noise drops, and your 30/60/90 reviews get easier. Data Explorer remains the daily workspace; Analyze Data answers grouped questions; Conversation Insights validates with real examples. That loop is how you operationalize early detection without adding headcount.
Ready to operationalize this with your own data? See the workflow end-to-end. See How Revelir AI Works. If you’d rather dive in and test it with a CSV or Zendesk connection, you can start quickly. Get Started With Revelir AI.
Conclusion
You don’t need another dashboard. You need every conversation turned into measurable, evidence-backed signals you can pivot, validate, and act on. When you stop sampling and start linking metrics to quotes, churn risk shows up earlier, decisions move faster, and late-stage firefighting fades. That’s the playbook. And it’s repeatable.
Frequently Asked Questions
How do I analyze churn risk using Revelir AI?
To analyze churn risk with Revelir AI, start by filtering your ticket dataset for conversations flagged with 'Churn Risk = Yes.' Next, click on the 'Analyze Data' feature. Choose 'Churn Risk' as the metric and group by either 'Driver' or 'Canonical Tag.' Running this analysis will give you insights into which issues are contributing to churn risk. You can then drill down into specific tickets to validate these findings and gather direct quotes that highlight customer concerns. This process helps you prioritize follow-ups and improve customer retention.
What if I want to identify high-effort interactions?
To identify high-effort interactions, use Revelir's Data Explorer. First, apply a filter for 'Customer Effort = High.' Then, select the 'Analyze Data' option and choose 'Customer Effort' as the metric, grouping by 'Category Driver.' This will show you which areas are causing the most friction for customers. By examining the grouped results, you can pinpoint specific issues and read through the associated tickets to understand the context better. This approach allows you to address operational challenges effectively and enhance the customer experience.
Can I track sentiment trends over time?
Yes, you can track sentiment trends over time using Revelir AI. Start by accessing the Data Explorer and setting a date range for your analysis. Filter the tickets by 'Sentiment' to see how many conversations are positive, neutral, or negative. You can then use the 'Analyze Data' feature to group the results by 'Canonical Tag' or 'Driver.' This will help you identify which issues are affecting sentiment and allow you to monitor changes over time. Regularly reviewing these trends can guide your strategies for improving customer satisfaction.
When should I validate insights with conversation drill-downs?
You should validate insights with conversation drill-downs whenever you identify a significant trend or pattern in your data. For example, if you notice a spike in churn risk or negative sentiment in a specific category, click into the detailed view in Revelir's Conversation Insights. This allows you to see the full transcripts and AI-generated summaries of the tickets behind those metrics. Validating insights in this way ensures that your conclusions are backed by real customer conversations, which can help in making informed decisions for product or service improvements.
Why does Revelir AI emphasize 100% conversation coverage?
Revelir AI emphasizes 100% conversation coverage because it ensures that no critical signals are missed. When you analyze all conversations instead of sampling a subset, you capture all the nuances and subtle cues that indicate customer frustration or churn risk. This comprehensive approach allows you to identify patterns that might otherwise go unnoticed. By converting every conversation into structured metrics, Revelir provides you with actionable insights that are traceable back to the exact quotes, making your data more reliable and your decision-making more effective.