

You want a reproducible way to cut agent ramp time without crossing your fingers. 30day evidenceled agent onboarding does that by grounding training in evidence, not anecdotes. You use 100% of your ticket history, pick topics by impact, and back every decision with quotes. The result is fewer early escalations, faster confidence, and coaching that you can prove.
It’s usually where teams go wrong. They point new agents at a wiki, pray the queue is gentle, and then explain misses with “it depends.” You do not need to gamble. With Data Explorer, Analyze Data, and Conversation Insights, you make the plan obvious, measurable, and traceable to real conversations. Nobody’s checking feelings. You check evidence.
Key Takeaways:
- Define day 7, 15, and 30 goals from your own ticket data so success is unambiguous
- Build training from the top 10 real patterns, prioritized by volume and severity
- Replace sampling with full-coverage metrics and quote-level traceability
- Run a weekly, 30-minute coaching loop that links scores to transcripts
- Use saved views to catch early-warning signals and intervene faster
- Prove value with before-and-after slides tied to tickets, not slogans
Stop Teaching From Anecdotes: 30day evidenceled agent onboarding Starts With Evidence
Anecdote-led onboarding fails because it misses the real drivers of struggle. Evidence-led onboarding starts with your own tickets, defines clear 7, 15, and 30-day goals, and backs every claim with transcripts. When you show quotes next to metrics, debate ends and decisions speed up.

Define Ramp Goals And Checkpoints For Days 7, 15, And 30
Set a simple scorecard your team can rally around. MTTR, escalation rate, QA score, and first-contact resolution. Open Data Explorer, baseline last quarter’s new-hire cohorts, and chart realistic slopes for day 7, 15, and 30. Publish the goals on day 1 so there’s no ambiguity.
Here’s the pattern that works:
- Baseline last quarter’s new-hire metrics in Data Explorer
- Set checkpoints for day 7, 15, 30 with attainable slopes
- Share the scorecard with new agents and coaches on day 1
You’re not guessing. You’re anchoring the plan to your data so progress is visible and shared.
What Proof Convinces Leadership Fast?
Decide the audit trail up front. Save a Data Explorer view for each metric you’ll report and name them clearly. In weekly reviews, open the slice, click into Conversation Insights, and read two quotes that match the trend. This prevents a common mistake: arguing about representativeness.
Leaders move when the “why” is obvious. A chart is helpful, but a chart plus two clean quotes is undeniable. If you need broader onboarding context for planning, the 30-60-90 day planning guide is a useful companion.
How To Baseline In Under An Hour
Start with the last 60 to 90 days. Filter by new-hire tickets or time-on-team if you track it. Run Analyze Data with Sentiment and Churn Risk grouped by driver and canonical tag. Export counts and percentages for onboarding-related drivers to set your “before” snapshot.
To make this repeatable:
- Save the filters and analysis as a named view
- Store the export next to the view name and date
- Re-run the same view at day 30 to show lift without rebuilding anything
A short primer on onboarding fundamentals from Cornerstone OnDemand can help you frame expectations across HR and CX.
The Hidden Bottleneck In 30day evidenceled agent onboarding: Signal Over Noise
Onboarding breaks when training topics are chosen by memory, not evidence. The fix is extracting signal from 100% of tickets, then validating each pattern with quotes before it hits the curriculum. When you show agents what “good” looks like in your context, skill adoption speeds up.

Extract The Top 10 Patterns From Real Tickets
Start broad, then tighten. Use Analyze Data to group Sentiment or Customer Effort by driver and canonical tag. Sort by negative sentiment, high effort, or churn-risk density. For each candidate, click into Conversation Insights and skim a handful of transcripts to confirm pattern quality.
Lock in the list like this:
- Keep issues that have high volume and clear, teachable moments
- Drop items with muddy signals or scattered causes Pause. Check the quotes.
- Prefer topics where agents can practice a repeatable resolution path
- Include one “soft-skill” pattern where empathy or tone matters most
Now you’re training to the work, not to a slide.
Prioritize By Volume And Severity, Not Opinions
Opinions are loud. They’re also wrong as often as they’re right. Score each candidate by a simple priority index: volume times severity. Severity can be percent negative, percent high-effort, or percent churn-risk. If two items tie, pick the one with cleaner quotes. Clarity beats novelty during ramp.
You’ll avoid the classic mistake of chasing memorable one-offs. Agents need reps on the issues that actually show up.
Validate With Quotes Before You Train
For every chosen pattern, pull three representative quotes and the shortest transcript that shows the full arc from problem to resolution. Save the ticket links. These become the “truth anchors” inside micro-trainings and the QA rubric.
If the examples feel muddled, fix the canonical mapping or pick a cleaner pattern. Same thing with tone guidance. If empathy examples are fuzzy, pick better quotes before you build content.
The Cost Of Guesswork In Onboarding Programs
Guesswork wastes time and hides risk. Sampling 10% of tickets feels safe, but it misses quiet churn signals and delays fixes. One structured analysis plus a 10-ticket validation often beats hours of random review. When you quantify that waste, the business case gets easy.
Quantify The Sampling Trap So You Can Stop It
Let’s pretend you handle 1,000 tickets per month and “review” 10% at three minutes each. That’s five hours for a partial view that still misses subtle churn signals. To review 100% at that pace is 50 hours. One Analyze Data run plus 10-ticket validation takes under 30 minutes with higher confidence.
This isn’t theoretical. Sampling introduces bias precisely where you can’t afford it. The onboarding research from [Bridgespan] underlines the cost of slow, unclear ramp plans across teams.
Early Escalations Are A Coaching Tax
When agents learn on generic categories, they misclassify drivers and escalate avoidable issues. That creates rework and erodes confidence. Track early escalation rate for day 1 to day 15 separately from day 16 to day 30. If the first window is double the second, training order was wrong. Not the class.
Use that split to reorder your modules. You’ll see rework drop and confidence rise.
Build The Business Case In Two Slides
Slide 1 shows the baseline: MTTR, early escalations, and QA misses tied to drivers. Slide 2 shows projected gains from 30day evidenceled agent onboarding: sampling time eliminated, top five drivers covered by day 10, QA rubric aligned to Conversation Insights.
Tie the ask to coaching time and one week of content creation. Leadership buys clarity, not slogans.
What It Feels Like When Onboarding Runs On Hunches
Hunch-led onboarding feels chaotic. New agents get tickets that don’t match the playbook. Managers feel pressure to explain misses without proof. When you coach with quotes and show the path from metric to transcript, fear fades and skills stick. It’s human. And it works.
Make Space For The Human Experience
Use Conversation Insights in coaching to normalize the learning curve. Read a tough transcript together, name the driver, and underline the exact moment empathy or resolution completeness slipped. Ask the agent what they would try next, then show a gold-standard example from your saved set.
It’s not blame. It’s pattern recognition with receipts.
How Do You Reduce Fear Of Live Tickets?
Work in gradients so risk stays low while confidence climbs. Day 1 to day 3, shadow high-quality transcripts and summarize the driver and outcome. Day 4 to day 7, role-play using pulled quotes as prompts. Day 8 onward, pair on low-risk tickets while the coach tags drivers in real time.
A simple outline:
- Shadow and summarize drivers and outcomes
- Role-play with quotes as prompts
- Pair on low-risk tickets with live tagging support
If you want broader people-leadership context, see ADP’s take on onboarding practices that boost engagement.
Manager Cadence That Restores Control
Run a weekly 30-minute loop. Open saved views for new-hire tickets, filter by high effort or churn risk, and sample five conversations. Score with the QA rubric and attach two quotes. End with one micro-target for the next week.
The cadence turns coaching from abstract advice into precise, traceable improvements that compound.
Build The 30-Day Playbook With 30day evidenceled agent onboarding
A 30-day playbook works when it’s short, specific, and tied to your tickets. Five micro-trainings, a QA rubric anchored to transcripts, and three early-warning views give you control. Agents see what good looks like. Managers know where to focus. Progress shows up in the numbers.
Create Five Micro-Training Modules In One Week
Turn your top patterns into five modules: problem definition, three quotes from Conversation Insights, step-by-step resolution, and “what to say” templates. Keep each under 15 minutes. Assign Modules 1 and 2 by day 5, Modules 3 and 4 by day 10, and Module 5 by day 15.
Short, specific, evidence-backed beats long lectures every time.
Design A QA Rubric Tied To Conversation Evidence
Score four dimensions: accuracy of driver, empathy markers, resolution completeness, and correct tag usage. For each criterion, link a representative transcript that shows gold-standard execution. In reviews, click from the score to the quote. That keeps feedback objective and prevents ambiguity.
Agents start to self-check against the same evidence. That’s the point.
Coaching Cadence And Early-Warning Views
Save three views in Data Explorer for new hires: churn-risk tickets handled, high-effort conversations handled, and tickets with specific onboarding drivers. Review twice weekly for the first month. Rising counts trigger a targeted coaching session on that pattern.
Stop guessing. Start training to what the work actually is. Learn More
How Revelir AI Powers 30day evidenceled agent onboarding And Cuts Ramp Time
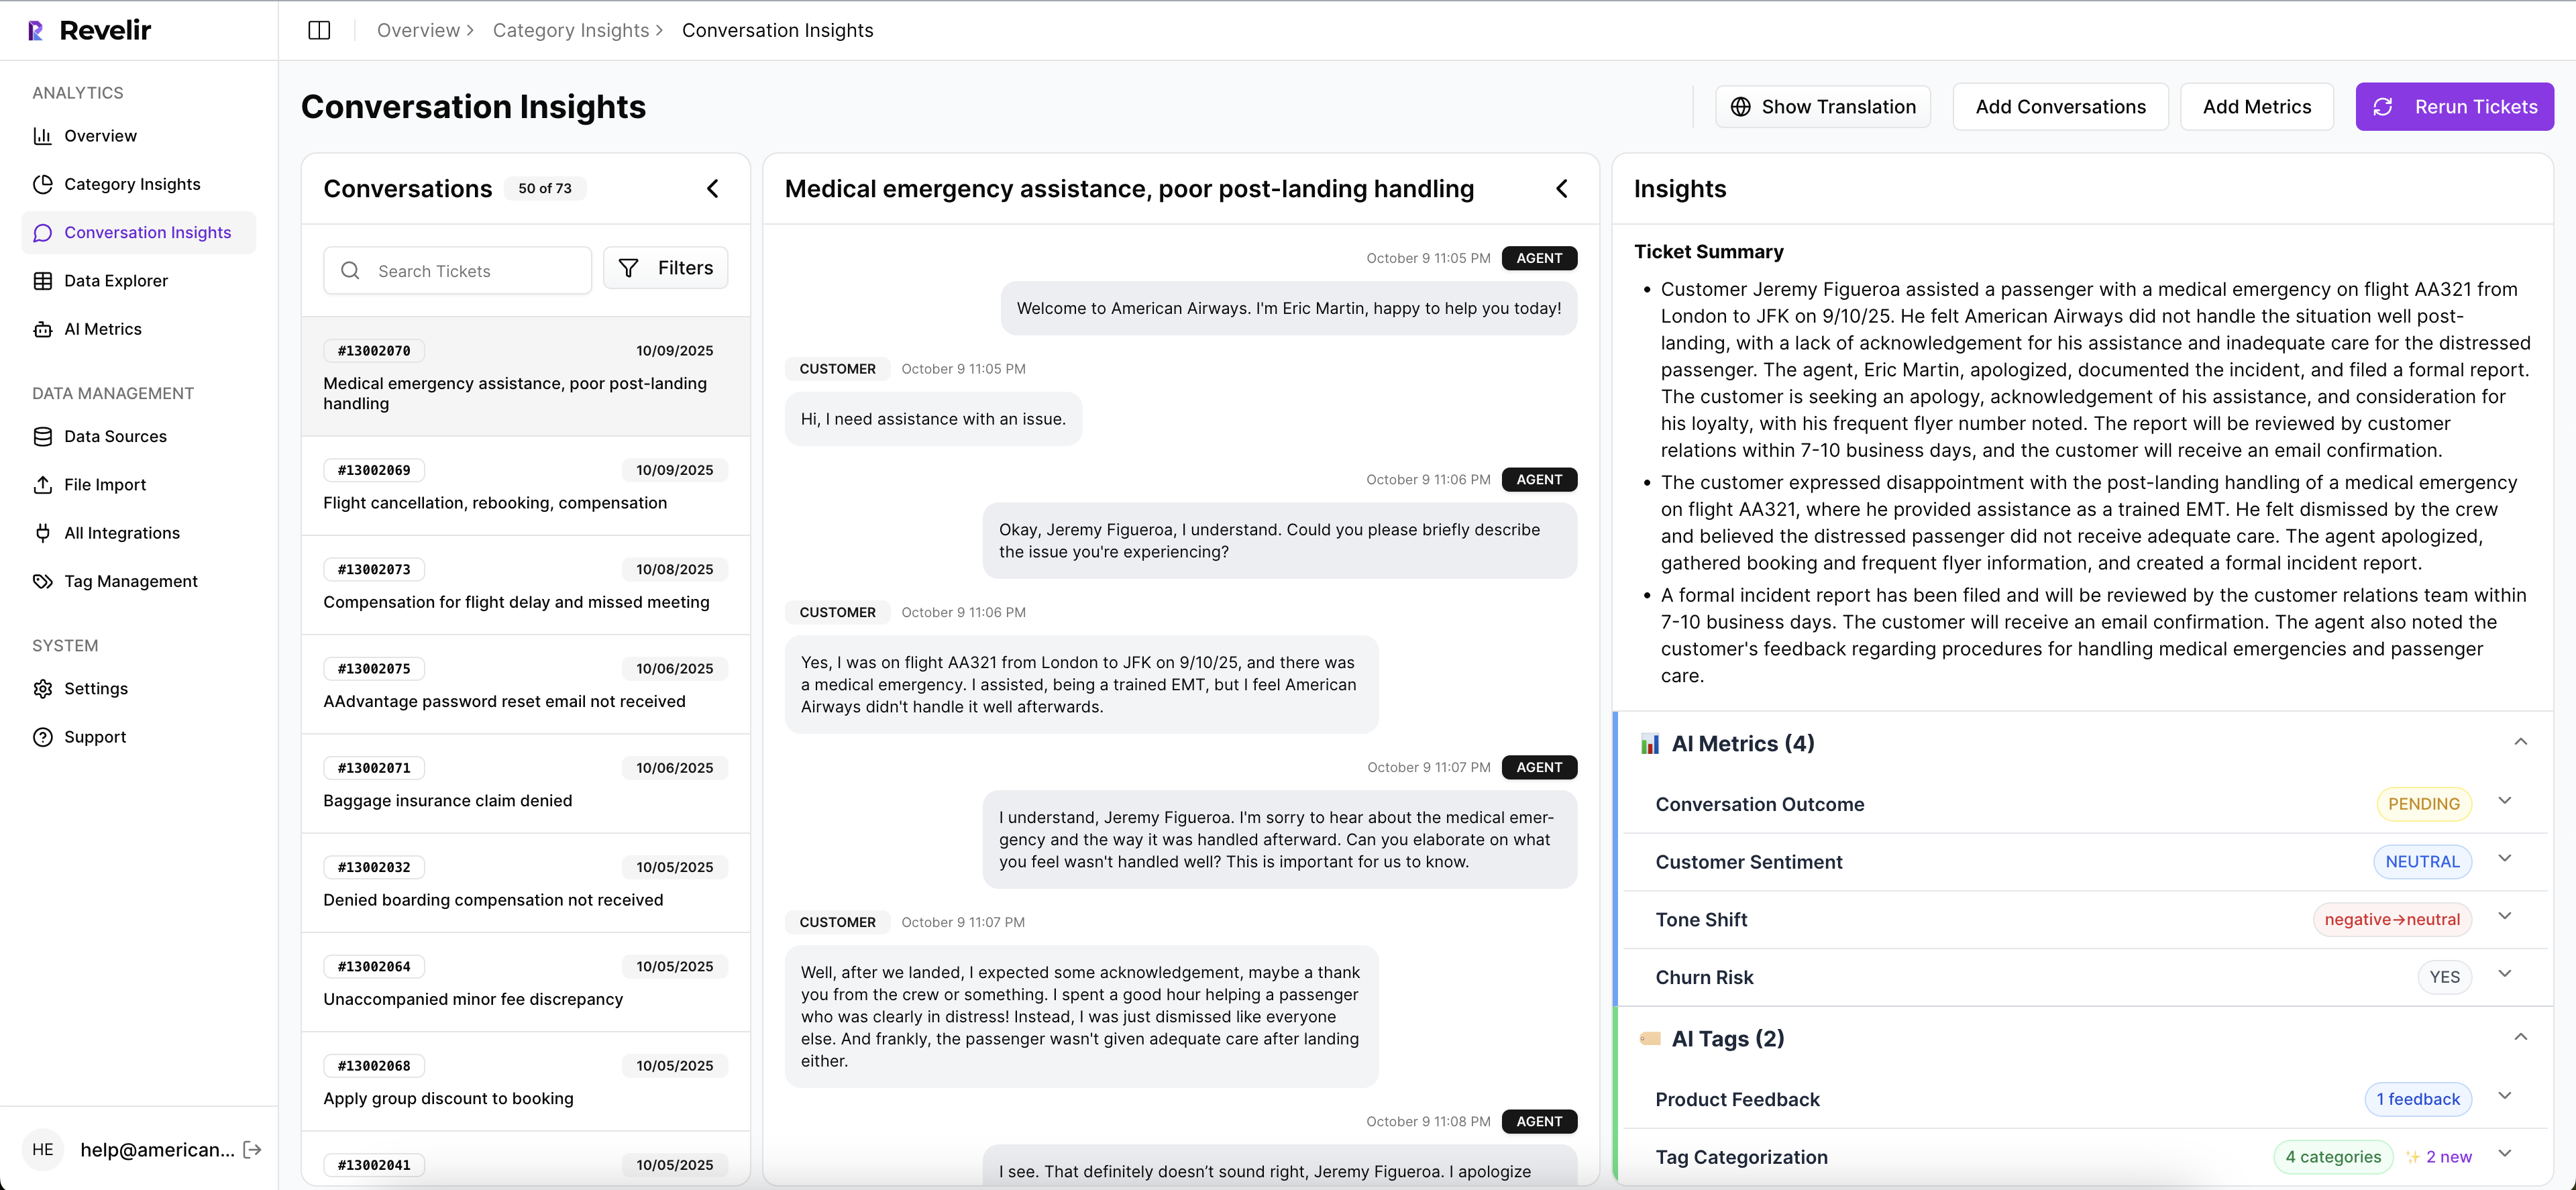
Revelir AI turns 100% of your support conversations into structured, traceable metrics you can act on. Full-coverage processing feeds AI Metrics like Sentiment, Churn Risk, and Customer Effort into Data Explorer and Analyze Data, so you isolate onboarding drivers in minutes and validate them with quotes in Conversation Insights.
Full-Coverage Metrics And Fast Prioritization
Revelir processes all uploaded or ingested tickets without sampling. Every conversation becomes a row with metrics and tags you can filter and group. In Analyze Data, you group Sentiment or Churn Risk by driver or canonical tag to surface high-volume, high-severity patterns fast. That replaces 50 hours of manual sampling with a 30-minute, defensible pass.

From there, you pick your five training modules based on impact, not memory.
Evidence-Backed QA And Coaching Loop
Every aggregate count in Revelir links to the exact transcripts behind it. Managers click from a KPI to Conversation Insights, pull three quotes, and update the QA rubric with gold-standard examples. That traceability reduces rework and ends the endless “is that tag fair?” debate because everyone reads the same evidence.
It also builds trust in the room where priorities are set.
Saved Views For Early-Warning Signals
Create saved views for new-hire tickets with churn risk, high effort, or specific onboarding drivers. Use them in your twice-weekly cadence to spot rising risk early and coach precisely. You don’t have to change agent workflows. Revelir sits on top of your helpdesk data via Zendesk integration or CSV upload and keeps analysis fresh.

Cut ramp time with evidence, not guesswork. See How Revelir AI Works
Conclusion
Evidence beats anecdotes, especially in the first 30 days. When you define goals from your own data, pick training topics by real impact, and tie every metric to quotes, ramp time drops and early escalations fall. The plan is simple: measure everything, teach with receipts, and coach to the patterns that actually cost you.
Ready to make that your new normal with full-coverage metrics and click-to-quote validation? Get Started With Revelir AI
Frequently Asked Questions
How do I set up Revelir AI for my team?
To get started with Revelir AI, first connect your helpdesk system, like Zendesk, or upload a CSV file of your past tickets. Once your data is ingested, Revelir will automatically process it, applying AI metrics and tagging. You can then use the Data Explorer to filter and analyze your ticket data, identifying key trends and insights. Make sure to define your canonical tags and AI metrics to align with your business needs. This setup typically takes just a few minutes, and you can start seeing insights almost immediately.
What if I need to customize metrics in Revelir AI?
You can customize metrics in Revelir AI by defining your own AI Metrics that reflect your specific business language. This allows you to create metrics like 'Upsell Opportunity' or 'Reason for Churn'. Simply go to the configuration settings and specify the metrics you want to track. Once set up, these custom metrics will be applied consistently across your conversations, giving you tailored insights that matter most to your team.
Can I track the effectiveness of my onboarding process?
Yes, you can track the effectiveness of your onboarding process using Revelir AI. Start by analyzing tickets related to onboarding issues in the Data Explorer. Use filters to isolate conversations with negative sentiment or high churn risk. Then, apply the Analyze Data feature to group insights by drivers or canonical tags related to onboarding. This will help you identify specific pain points and measure improvements over time, ensuring your onboarding process is effective and continuously refined.
When should I intervene with agents based on ticket data?
You should intervene with agents when you notice early-warning signals in ticket data, such as a rise in negative sentiment or high customer effort metrics. Use Revelir AI's Data Explorer to monitor these metrics regularly. If you see a spike in churn risk or frustration signals, it's a good time to step in and provide additional coaching or resources. Running a weekly review of these metrics can help you catch issues before they escalate, ensuring your agents are supported and equipped to handle customer concerns effectively.
Why does Revelir AI emphasize evidence-backed metrics?
Revelir AI emphasizes evidence-backed metrics because they provide a reliable foundation for decision-making. By analyzing 100% of your support conversations, Revelir ensures that insights are derived from actual customer interactions rather than anecdotal evidence. This approach helps teams identify real drivers of customer sentiment and churn risk, enabling them to make informed decisions about product improvements and agent training. With every metric traceable to specific conversations, you can build trust in your data and prioritize actions that truly address customer needs.